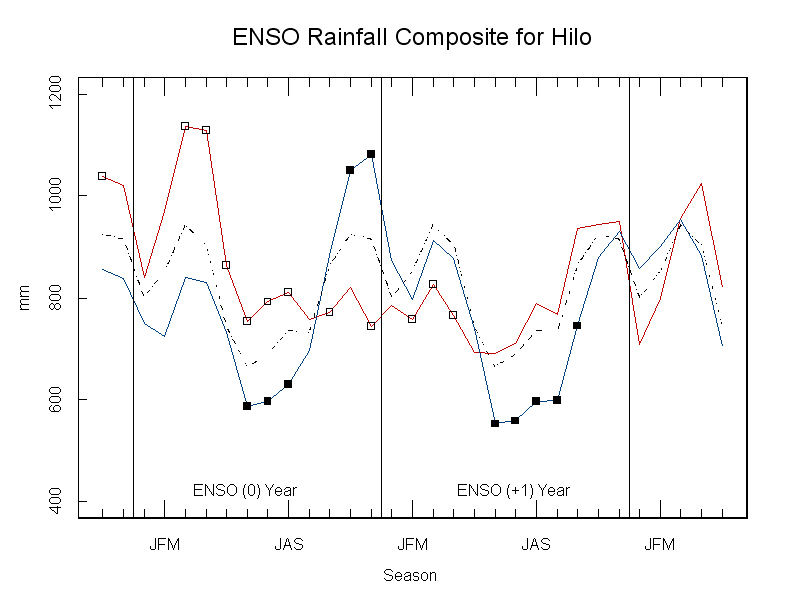
ENSO composite rainfall results for Hawaii and US-affiliated islands.
The dotted line denotes the climatological mean rainfall for
all years in the 1955-2007 period, the red line the mean for the 17 composited
warm ENSO episode years, and the blue line the mean
for the 15 cold episode years. Vertical lines denote calendar year changes. Each
plot shows composite rainfall for the period beginning about 5 seasons
before the boreal winter of a mature episode and ending about 5 seasons after
that winter.
Differences between the composited rainfalls for
the samples representing the warm phases of ENSO versus that of the
remaining (neutral plus cold phase) years passing a 2-tailed significance test
at the 0.05 level are indicated with a hollow square along the solid line.
Significant differences at the 0.05 level with respect to the cold phase composi
te rainfalls versus remaining (neutral plus warm phase) years are indicated
with a solid square along the dashed line.