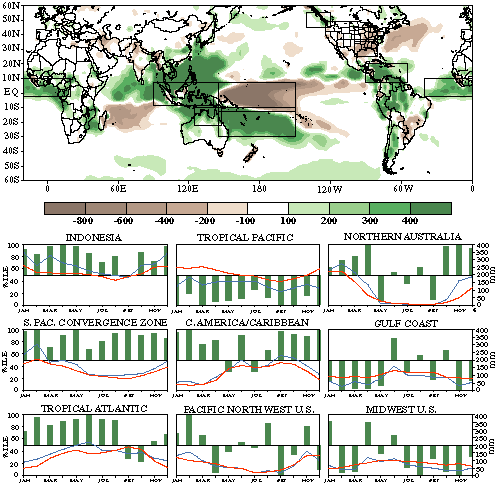
FIG. 15. January–December 1999 accumulated precipitation anomaly (top), and
regional area-averaged estimates of monthly mean precipitation amounts (mm, blue lines)
and precipitation percentiles (%, bars) during 1999 for the six boxed regions shown in top
panel. The monthly precipitation climatology (mm, dashed, red lines) is the 1979–95
base period monthly means. The percentiles are labeled on the left-hand vertical axis and
totals are labeled on the right-hand vertical axis. Precipitation amounts are obtained by
merging raingauge observations and satellite-derived precipitation estimates (Janowiak and
Xie 1999).
|
