Climate Assessment Table of Contents
Drought in the United States
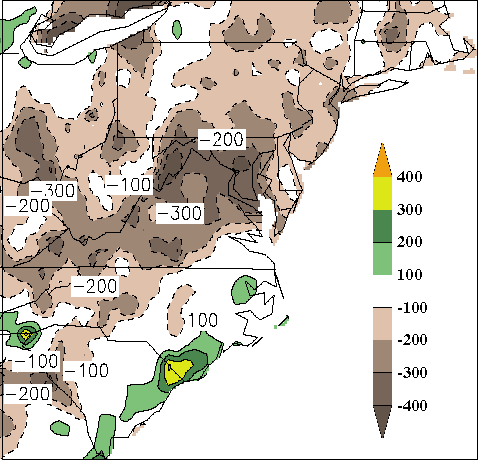
FIG. 38. Total precipitation (a) and anomalies (b) during 1 July 1998–31 July 1999. Units are mm. Anomalies are departures from the 1961–90 base period means.