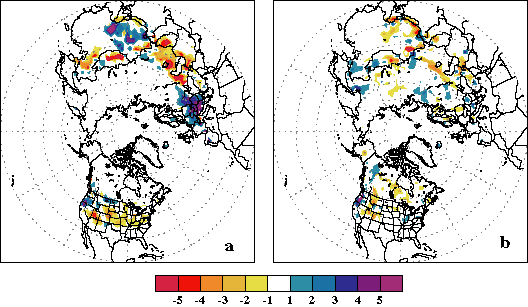
FIG. 4. Snow cover duration anomaly (weeks) during (a) December
1998–February 1999 and (b) March–May 1999. Values are derived from an
operational analysis of visual satellite imagery by NOAA/NESDIS. Anomalies are departures
from the 1972–98 base period means.
