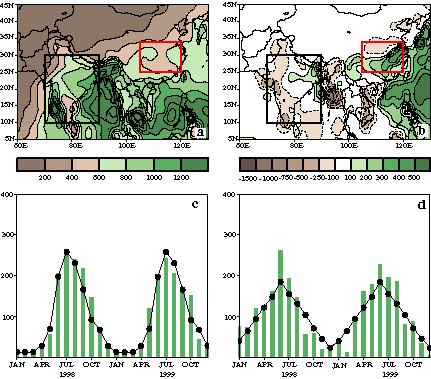
FIG. 53. (a) Climatological mean precipitation (mm)
and (b) precipitation anomalies (mm) for June–September 1999. Monthly time series of
total precipitation (mm, bars) and the 1961–90 mean (mm, line) averaged over (c) the
boxed region centered on India and (d) the boxed region centered on eastern China.
|
