Current Conditions
Forecasts
Expert Discussions
Composites
Linkage to Weather
FAQ's
Publications
|
| |
Current Conditions
|
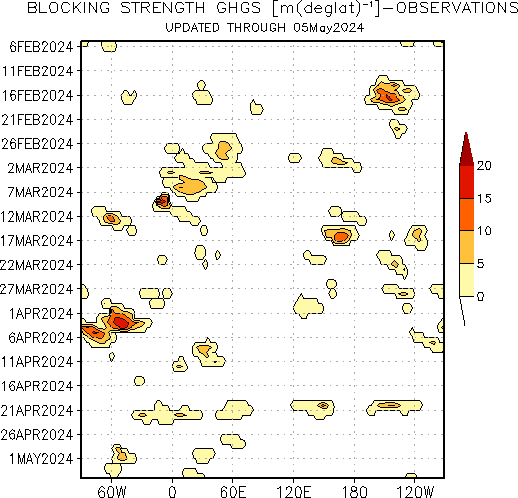
All colored regions in the hovmoller plot below
depict regions where the flow is blocked according to the blocking
index. The color scheme denotes the strength of the blocked flow as determined from the 500 hPa geopotential
height gradient measured from the blocking ridge equatorward (denoted GHGS in blocking index definition). The
presence of an intense cutoff low equatorward of the blocking ridge can act to enhance the blocking strength.
|
|
[Back to the Top]
|
Forecasts
|
|
[Back to the Top]
|
|
|
|
|
Expert Discussions
[Back to the Top]
|
|
|
|
|
Composites
|
|
Using the blocking index of Tibaldi and Molteni (1990) we can consider the frequency of DJF "blocked days" for Neutral, Warm and Cold episodes as defined by the magnitude of the SST anomalies in the tropical Pacific. Cold episodes are defined as [C+,C], warm episodes [W+,W], and neutral episodes as [W-,C-,N]. For each panel the number of DJF seasons is shown in square brackets. We have also included in the middle panel on the right-hand side a plot of the neutral episodes defined simply as [N]. This can be compared with the middle left-hand side panel where neutral episodes have been defined as [W-,C-,N]. In each panel the DJF 51 year average has been plotted in red for ease of comparison.
|
|
| |
|
[Back to the Top]
|
|
|
Linkage to Weather
[Back to the Top]
|
|
|
FAQ's
|
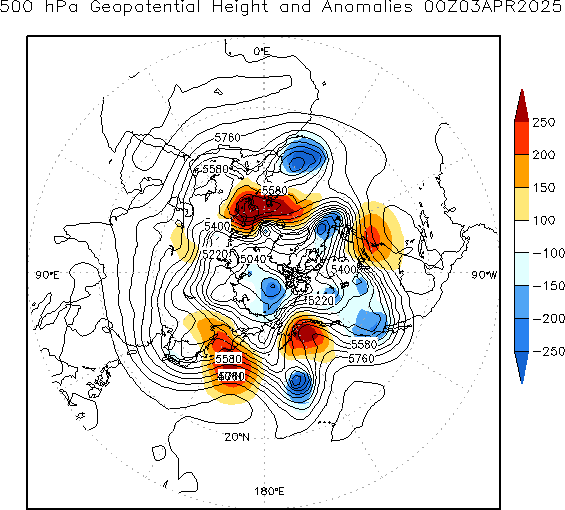
Atmospheric blocking is commonly referred to as the situation when the normal zonal flow is interrupted by strong and persistent meridional flow. The normal eastward progression of synoptic disturbances is obstructed leading to episodes of prolonged extreme weather conditions. On intraseasonal time scales the persistent weather extremes can last from several days up to a few weeks, often accompanied by significant temperature and precipitation anomalies. Examples of the 500 hPa height and anomaly fields associated with mature blocking episodes over the northeastern Atlantic and the North Pacific. These two regions are preferred areas for atmospheric blocking during the northern hemisphere cold season.
A common finding among scientific studies is that these long-lived weather extremes are associated with recurrent atmospheric flow anomalies. Numerous studies have found that the poor forecast skill beyond a few days results principally from the inability of numerical weather prediction models to simulate the onset and evolution of blocking flows.
Definition of Blocking Index Definition
[Back to the Top]
|
|
|
Publications
[Back to the Top]
|