[Next Article] -
[Previous Article]
Forecasts of Surface Temperature and Precipitation Anomalies
over the U.S. Using Screening Multiple Linear Regression
contributed by David Unger
Climate Prediction Center, NOAA, Camp Springs, Maryland
Screening multiple linear regression (SMLR) is used to predict
seasonal temperature and precipitation amounts for locations
over the mainland United States. Predictor data consist of
northern hemisphere 700-mb heights, near global SSTs and station
values of mean temperature and total precipitation amount from the
3-month period prior to the forecast initial time of March 1, 1996.
Forecasts for the mean temperature and total precipitation are made
for a series of 13 overlapping 3-month periods, at one month intervals,
beginning with Apr-May-Jun (AMJ) 1996 and extending through AMJ 1997.
Regression relationships were derived from data for the 1955-95 period.
Forecasts were produced from single station equations for 59 stations
approximately evenly distributed throughout the mainland U.S.
All predictors and predictands were expressed as
standardized anomalies relative to the developmental
data. Precipitation amounts were transformed by taking
their square roots prior to standardization in order to
help normalize their distribution. Twenty-five candidate predictors, selected from gridpoint values in
regions of known importance for climate prediction,
were offered for screening in the regression development. A few predictor locations were chosen on the
basis of data examination of the first 20 years of the
sample, referred to here as the base period. Information from the most recent 20 years was never used for
selection of candidate predictors (Unger, 1996a).
Initial testing indicated that cross-validation cannot
be used for SMLR (Unger 1996b) so a variation of a
retroactive real time (RRT) validation technique was
used. To estimate skill by RRT, a forecast equation
was derived from the base period and applied to the
next year's data to obtain independent data results. The
case was then added to the developmental sample, a
new relationship was derived and applied to the following year's data. Independent data statistics accumulate
on a year by year basis in exactly the same way as an
operational forecast procedure, except retroactively.
Forecasts were then obtained for the base period years
by application of RRT in reverse: deriving from the
"future" years and applying to the most recent year in
the withheld period (now the first half of the sample).
Each earlier case was then included in the development
sample, the relationships re-derived and applied to the
next earlier case. This bi-directional RRT (BRRT)
validation technique provides that each available case
contribute to a skill estimate as independent data in a
way similar to cross-validation except with a great
reduction in the distortion of results due to redundant sampling (Unger, 1996b).
A forward selection screening procedure was used
for equation development. The top 5 terms were
selected for each equation. Separate statistics were
accumulated for each equation length, so that results for
all the one, two, three, four and five term equations
were calculated. The optimum equation length was
then estimated by an objective learning procedure that
used the past performance at each RRT trial to "predict" which equation would perform the best on the
next. Verification statistics from this "best guess"
forecast were also kept separately and were used to
obtain the final skill estimate of the forecasts.
The verification used was the temporal correlation
coefficient between forecast and observation on the 40
independent cases at each of the 59 stations. An
average correlation coefficient was computed from the
root mean squared correlation coefficient with the signs
retained both in the squaring process and the final
square root. Field significance was measured by
comparison of scores from actual target years against
scores determined from 500 randomly shuffled target
periods. Field significance expresses the percentage of
time that the random forecast series outperformed the
actual forecasts.
The final forecasts are post-processed to obtain an
estimate of the likelihood of the above, normal, or
below class being observed, as defined by the terciles of
the distribution for each forecast element and location.
A forecast is assigned a class on the basis of the forecast distribution and skill. An estimate of the increased
likelihood of a given class is made to place the forecast
in a format similar to the operational long lead forecasts
issued by the CPC (O'Lenic, 1994). Currently these
probability assignments are obtained from the relationship between probability of a given class being observed, the inflated SMLR forecast and the predictive
skill. (Inflation sets the forecasts variance equal to
observed variance at each station.) This relationship is
based on forecast performance on independent data. If
the correlation skill of the forecast is under approximately .3, the forecast is not assigned to a class and is
regarded as a climatological forecast.
The forecasts for AMJ 1996 are shown in Figs. 1
and 3 with the corresponding skill estimates for each
station shown in Figs. 2 and 4. Temperature forecasts
for JJA 1996 and the associated skill are shown in Figs.
5 and 6 respectively. Shading indicates areas of sufficient skill to assign a tercile category to the forecast.
Contours within the shaded areas on the forecast maps
indicate estimates of a 5 and 10 percent probability
anomaly for the category. Note that the skill estimates
are based on the actual forecasts, and not the post
processed category assignments, which are presented
only for clarity of presentation.
The numbers plotted in Figs. 1, 3, and 5 indicate
station values of the regression forecast for the standardized anomaly of temperature or the square root of
precipitation amount. Forecasts are damped according
to the forecast-observation correlation on independent
data so that the squared error between forecast and
observation will be minimized. Non-zero numbers
plotted outside of shaded regions generally indicate
forecast anomalies of substantial magnitude at stations
with some skill, but lower than the skill threshold to
choose a forecast category with confidence.
Temperature forecasts (Fig. 1) show below normal
temperatures along the North Pacific coast, and above
normal temperatures in scattered locations in the
southern U.S. and eastern New England. The average
correlation for this forecast is .25 with a field significance of .000. The forecasts show some contradiction
near the Great Lakes, where areas of below normal,
near normal and above normal temperatures neighbor
each other in a region where the spatial correlation of
temperature anomalies are quite high.
Because the regression forecasts are derived from
single station equations, inconsistencies, such as those
near the Great Lakes for AMJ 1996 can be considered
to be similar to an ensemble forecast for the region,
with the variability in the forecasts introduced by the
station to station variability in the development sample.
Thus, different forecasts where temperature anomalies
are spatially correlated might be considered to be
different "opinions", or possibilities, for the region.
While the contradictory predictions may provide useful
guidance to assess uncertainty, they diminish the value
of the forecasts by failing to provide a realistic final
assessment for the region. Future work will be required
to provide an objective method to locate and resolve
inconsistent forecasts.
Precipitation forecasts for AMJ 1996 show considerably less skill than for temperature forecasts, with
an average correlation of .11 and a field significance of
.11. Forecasts show a weak tendency for below normal
precipitation over the East coast and in central Texas.
The summertime temperature forecast for the U.S.
is shown in Figure 5. The East coast and southwestern
U.S. show a tendency to be warm, with some pockets of
near normal scattered in some localized regions. The
average correlation for this map is .23 and the field
significance is .002. Precipitation forecasts for summer (not shown) hint at continued dry conditions
extending from Ohio to Virginia.
References
O'Lenic, E., 1994: A new paradigm for production and
dissemination of the NWS's long lead-time seasonal climate outlooks. Proceedings of the Nineteenth Annual Climate Diagnostics Workshop.
College Park, Maryland, November 14-18, 1994.
408-411.
Unger, D. A., 1996a: Long lead climate prediction
using screening multiple linear regression. Proceedings of the Twentieth Annual Climate Diagnostics Workshop. Seattle, Washington, October
23-27, 1995 (in press).
Unger, D. A., 1996b: Skill assessment strategies for
screening regression predictions based on a small
sample size. Preprints, Thirteenth Conference on
Probability and Statistics in the Atmospheric
Sciences. San Francisco, CA., February 21-23,
1996. 260-267.
Figures
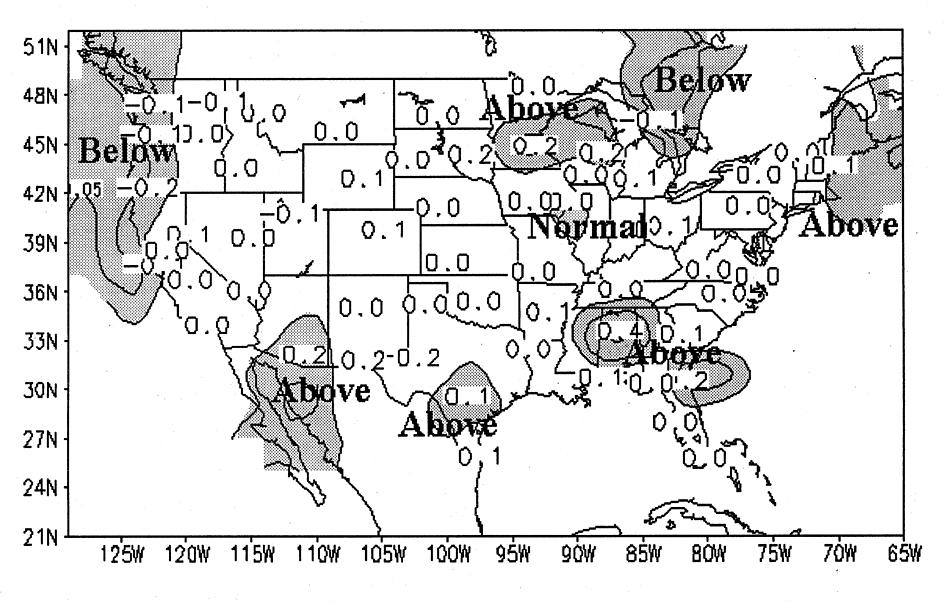
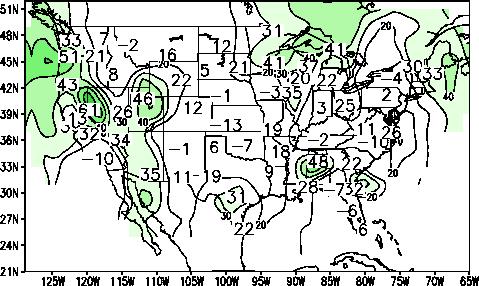
Figure 1. (left) A 1-month lead screening regression-based temperature
forecast for AMJ 1996. Contours are estimated probability anomalies for
the specified tercile. Shaded areas delinate the area of correlation
skill greater than 0.3. Plotted numbers are station values of the
standardized anomaly.
Figure 2. (right) Distribution of skill for the 1-month lead
regression forecast for AMJ 1996 temperatures. The values shown are the
correlation between forecast and observation for the 1956-1995 period.
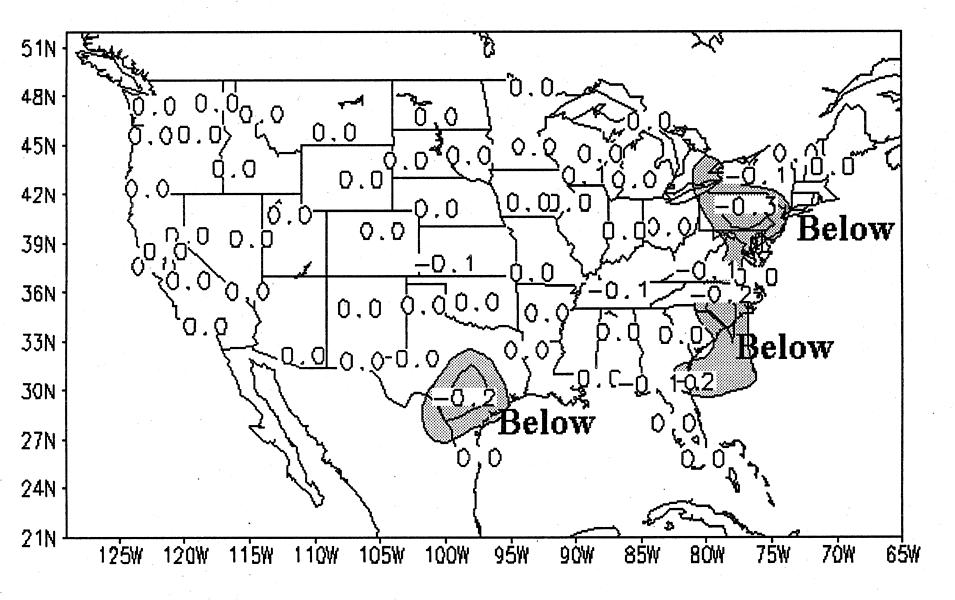
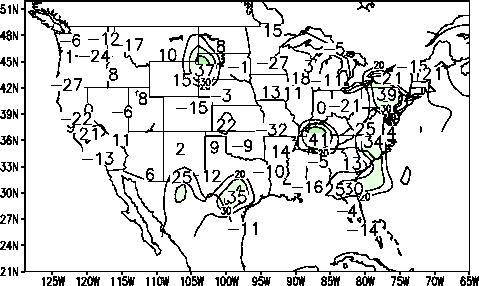
Figure 3. (left) Same as figure 1 except for precipitation forecasts.
Figure 4. (right) Same as figure 2 except for precipitation skill.
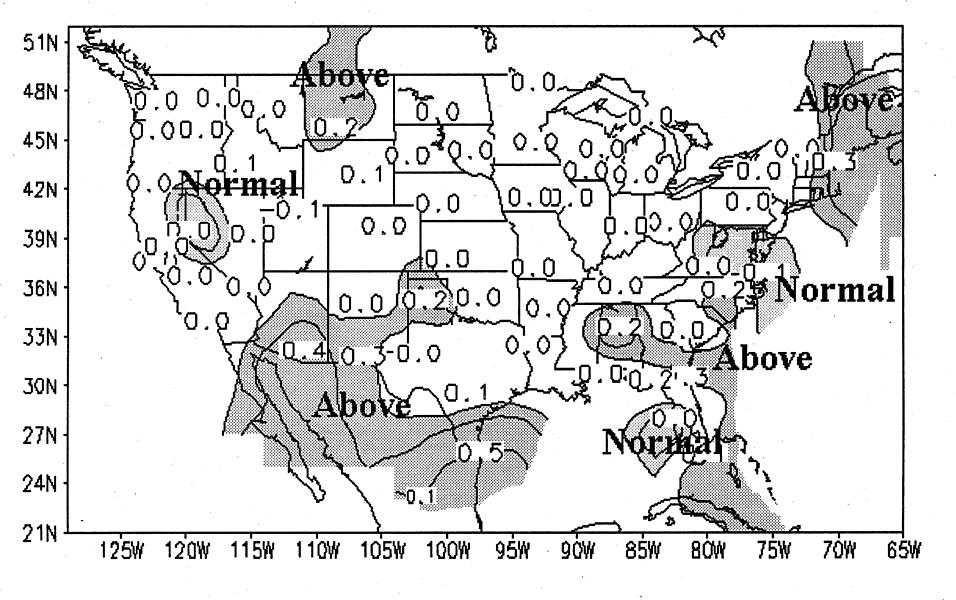
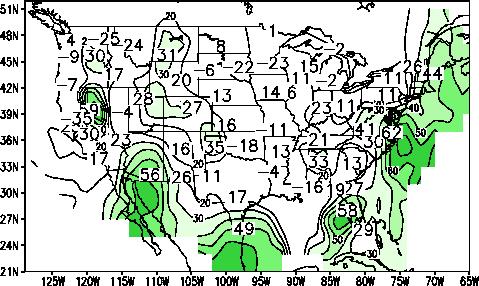
Figure 5. (left) Same as figure 1 except for JJA 1996.
Figure 6. (right) Same as figure 2 except for JJA 1996.
[Purpose] -
[Contents] -
[Editorial Policy] -
[Next Article] -
[Previous Article]