Severe and recurrent rainfall deficits across the African continent
during the past two to three decades have been detrimental to the economy
of the African nations. Thus, policy makers and funding agencies often
face tough challenges to make relief plans. There clearly is a need for
forecasts of short-term climate fluctuations, such as for seasonal total
rainfall one or more seasons in advance. The African Desk, established
at the Climate Prediction Center (CPC) of the NWS/NCEP, has been experimenting
with African seasonal forecasting in collaboration with the CPC. While
numerical approaches are being considered, work so far has focused more
on statistical methods. Here we apply canonical correlation analysis (CCA)
to produce an experimental forecast for rainfall anomalies in the region
of eastern Africa (10S-10N, 25E-50E) for the Oct-Nov-Dec 1996 period. The
boreal spring and fall months comprise the climatologically rainy season
in eastern Africa, as this is when the highest temperatures and atmospheric
moisture content (i.e. the ITCZ) occur at this tropical region along the
immediate equator.
The CCA method is a multivariate regression that relates patterns
in predictor fields to patterns in the predictand field. The prediction
design used here is the same as that of the CCA used as one of the tools
for operational climate prediction in the U.S. (Barnston 1994), based on
earlier work of Barnett and Preisendorfer (1987). Four consecutive 3-month
predictor periods are followed by a lead time and then a single 3-month
predictand, or target, period. Forecast skill experiments have indicated
that the global SST field serves best as a predictor. While additional
fields such as upper air geopotential height, tropical low-level wind or
outgoing longwave radiation might well enhance skill farther, data sets
of these fields do not extend far enough into the past to satisfy the CCA's
need for a long-term (e.g. at least 25-year) data record from which to
identify the dominant relationships. The predictor and predictand data
sets used here begin in 1955. For the 1996 eastern African rainfall prediction
shown below, the predictor data are the global SST anomaly field over the
four 3-month periods of Sep-Oct-Nov 1995, Dec-Jan-Feb 1995-96, Mar-Apr-May
and Jun-Jul-Aug of 1996. Using data from 1955-94, relationships between
the prior year's SST anomaly evolution and the target year's Oct-Nov-Dec
eastern African rainfall anomaly patterns are linearly modeled by the CCA.
The predictor SST data for the current forecast are then projected onto
the preferred relationships derived from the past years, and a forecast
for the 1996 target season is developed. Here the lead time is 1 month,
as the latest predictor data used are those of August 1996, preceding the
beginning of the target period by 1 month.
The predictor SST data were derived from a combination of the COADS
data (Slutz et al. 1985) and more recent OI data (Smith et al. 1996). The
predictand Sahel rainfall data come from the gridded global rainfall data
set developed by M. Hulme (Hulme 1994), at 2.5 by 3.75 latitude-longitude
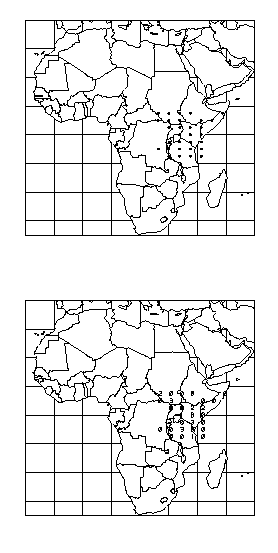
resolution, resulting in 29 points in eastern Africa (Fig. 1). A rainfall
data set consisting of individual stations has also been tested, with results
shown in Thiao et al. (1996) and Barnston et al. (1996). The gridded data
used here tend to show slightly higher skill in parts of Africa having
sparser data, such as eastern Africa. This may be because the gridded data
are developed using stations that have major gaps during some periods,
while the station data set completely excludes such stations.
The diagnostic data produced by CCA indicate that expected skill
is mainly poor in predicting Oct-Nov-Dec precipitation in eastern Africa
at 1-month lead, with average region wide correlation skill of 0.13, and
0.40 or higher skill at a couple of locations. Highest skills tend to occur
in southern Sudan. A cross-validation design is used in obtaining these
skill estimates, where each year is held out of the developmental data
set in turn, and then used as the forecast target.
The forecast presented below is expressed in terms of anomalies (i.e.,
departures) from climato-logical probabilities of the occurrence of three
equiprobable categories: below normal, near normal and above normal rainfall
(B, N, and A, respectively). The climatological probability of each of
these categories is 1/3; that is, over a long time period, each category
is observed one-third of the time. The forecast provides the estimated
deviation from these long-term probabilities for the period being forecast.
For example, if a 0.07 probability anomaly for below normal rainfall is
forecast, then the probabilities of the below, near and above normal categories
to occur would be 0.403, 0.333 and 0.263 instead of the climatological
probabilities of 0.333, 0.333, 0.333. In some cases the probability of
the near normal category may be elevated at the expense of the two outer
categories. Expressing the forecasts in terms of probability anomalies
enables uncertainty to be incorporated into the forecasts. It also assumes
knowledge on the part of the users regarding the rainfall amount intervals
defined by the bottom, middle and top thirds of the distribution. In a
rough sense, these categories may often be equated to drought, normal,
or excessive rainfall cases.
The probability forecast for eastern Africa for Oct-Nov-Dec 1996
is shown in Fig. 2. The numbers on the map are probability anomalies for
the above (A) normal category (X100). Slightly positive departures from
climatological probabilities in the direction of above average rainfall
for Oct-Nov-Dec are indicated for most of the locations having sufficient
combinations of forecast skill and forecast signals to result in any departure.
The field significance of the collective skill over all 29 grid points,
computed using Monte Carlo randomizations (indicating the probability that
the skill level of this forecast map could have occurred by chance), is
0.047. This satisfies the 0.05 level generally used as the threshold for
field significance.
Although 6 CCA predictor-predictand modes are used in this prediction,
the leading one to two modes typically contribute to the majority of the
skill, especially when skill is modest as it is here. Mode 1, which describes
an interdecadal SST trend, does not govern this forecast heavily because
the recent SST patterns have not projected strongly onto this mode. The
spatial loading patterns of mode 2, however, suggest that an important
determinant of the current forecast is the SST anomaly in the eastern tropical
Pacific (including but not limited to the ENSO state) and also a North
Atlantic versus South Atlantic SST anomaly difference. A warm eastern tropical
Pacific SST tends to be associated with positive rainfall anomalies in
eastern Africa, as is the case for positive anomalies in the North Atlantic
and negative anomalies in the South Atlantic. In the most recent several
months, while the ENSO state has been mildly negative, the northern versus
southern Atlantic SST anomaly pattern has been conducive to enhanced eastern
African rainfall. The latter situation has been a stronger influence than
the ENSO state in the current rainfall forecast.
The probability anomalies shown in Fig. 2 are all quite weak, with
none exceeding 0.05. While this is mainly because of the modest skill at
most of the locations, it is secondarily due to the neutrality of the forecast
signal for this particular prediction. That is, the anomalies in the predictor
SSTs are not strongly indicative of a well-defined anomaly pattern in the
African rainfall for the coming several months. This makes sense in view
of the lack of a strong overall anomaly in the tropic-wide SST over the
last several months. While the tropical Pacific SST has continued to be
slightly cooler than average, the influence of this anomaly has been outweighed
by the positive SST anomalies in the Indian ocean and tropical and south-subtropical
Atlantic ocean.
References
Barnston, A.G., W. Thiao and V. Kumar, 1996: Long-lead forecasts of seasonal precipitation in Africa using CCA. Wea. Forecasting, 11, in press.
Hulme, M., 1994: Validation of large-scale precipitation fields in
general circulation models. In Global Precipitation and Climate Change,
M. Desbois and F. Desalmand, Ed., NATO ASI Series, Springer-Verlag, Berlin,
466 pp.
Slutz, R., S.J. Lubler, J.D. Hiscox, S.D. Woodruff, R.J. Jenne, D.H. Joseph,
P.M. Steurer, and J.D. Elius, 1985: Comprehensive Ocean Atmosphere Data
Set. NOAA, Boulder, CO, 268 pp. [Available from Climate Research Program,
ERL, R/E/AR6, 325 Broadway, Boulder, CO 80303.]
Smith, T.M., R.W. Reynolds, and C.F. Ropelewski, 1994: Optimal averaging
of seasonal sea surface temperatures and associated confidence intervals
(1860-1989). J. Climate, 7, 949-964.
Thiao, W., A.G. Barnston and V. Kumar, 1996: Teleconnections and seasonal
rainfall prediction in Africa. Proceedings of the 20th Annual Climate
Diagnostics Workshop, Seattle, Washington, October 23-27, 1995, 413-416.
Figures
Fig. 1. (top) The 29 grid points used as the rainfall predictand
for the eastern African CCA predictions.
Fig. 2. (bottom) The CCA-based rainfall probability anomaly forecasts for
the eastern African region of Africa for Oct-Nov-Dec 1996. Values shown
are deviations from climatological probabilities for the above normal category.
For example, 3 implies (B,N,A) probabilities of 0.303, 0.333, 0.363, while
-2 implies 0.353, 0.333, 0.313. See text for further details.