|
[click on map for larger image]
The
CPC weekly Degree Day Assessment discusses the Heating Degree Day (HDD) or
Cooling Degree Day (CDD) outlook for the coming week, and reviews
temperature and degree day statistics for the past week and the heating
season (November - March) or cooling season (May - September) to date. This
Assessment can assist energy managers in anticipating and analyzing fuel
demand, because degree days quantitatively reflect the public need for
energy to heat and cool businesses and dwellings.
For
any individual day, degree days indicate how far that day's average
temperature departed from 65oF. HDD's, which measure heating
energy demand, indicate how far the average temperature fell below 65oF
(since cooler weather means more heating fuel demand). Similarly, CDD's,
which measure cooling energy demand, indicate how far the temperature
averaged above 65oF. In both cases, smaller values represent
less fuel demand, but values below 0 are set equal to 0, because energy
demand cannot be negative. Furthermore, since energy demand is cumulative,
degree day totals for periods exceeding 1 day are simply the sum of each
individual day's degree day total. For example, if some location had a mean
temperature of 60oF on day 1 and 80oF on day 2, there
would be 5 HDD's for day 1 (65 minus 60) and 0 for day 2 (65 minus 80, set
to 0 since degree days cannot be negative). For the day 1 + day 2 period,
the HDD total would be 5 + 0 = 5. In contrast, there would be 0 CDD's for
day 1 (60 minus 65, reset to 0), 15 CDD's for day 2 (80 minus 65),
resulting in a 2-day CDD total of 0 + 15 = 15.
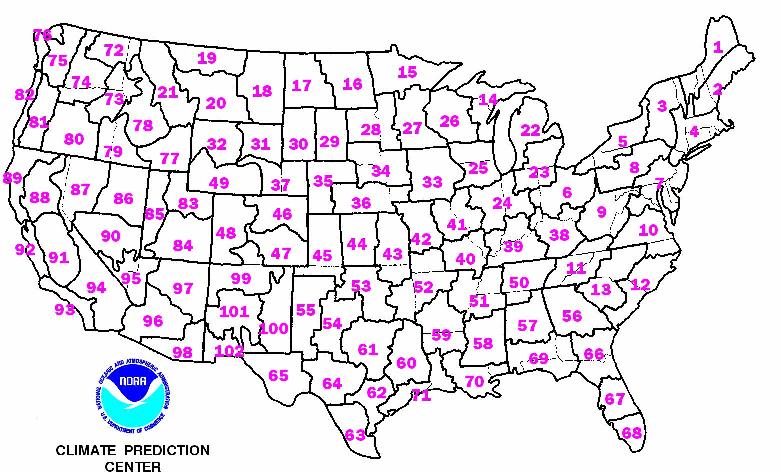
In
this Assessment, degree day and temperature statistics are based on
areally-averaged numbers for each of 102 climate regions of approximately
equal area that cover the contiguous 48 states.
• The Latest Assessment [updated
November 6, 2000]
The
first full week of November is expected to bring abnormally low
temperatures to most areas from the Plains to the West Coast while relatively
warm conditions cover locations from the Mississippi River eastward. As a
result, HDD totals 30 to 60 below normal for November 6 – 12 are expected from
the central and northeastern Gulf Coast northward through the Ohio Valley,
Appalachians, and southern Atlantic coast, and also in northern New England.
Temperatures in these areas are anticipated to average among the warmest
20% of expected occurrences for this time of year, based on 1990-1999 data.
Conversely, at least 30 more HDD’s than normal are forecast from the Plains
to the West Coast, with much of the central Great Plains, the High Plains, and
the central and northern Rockies expected to record HDD anomalies exceeding
+60.
The
latest Climate Outlook issued by the Climate Prediction Center on October
12 called for warmer than normal temperatures to again cover large sections
of the country during the upcoming winter, but conditions are expected to
average near normal in most of the central and northern Plains, central and
northern Mississippi Valley, Great Lakes region, Northeast, and some
adjacent areas.
• Supplementary Information
• Outlook Maps, Graphs, and Tables
CPC produces U.S. outlook
maps for degree days, departures from normal, and average temperature
percentile; tables of population-weighted state, regional, and national
averages by state; and probability of exceedence graphs.
• U. S. Degree Day Outlook Maps by U.S. Climate
Regions
Based on output statistics
from the Medium Range Forecast Model (MRFMOS).
• 7-Day Total HDD
The sum of each day's degree day forecast in each of 102 climate
regions that cover the contiguous 48 states.
• 7-Day Departures from Normal HDD
The amount by which the 7-day total for each climate
region departs from the average degree day total for the same 7 days
during 1990-1999. Negative numbers reflect less energy demand than
normal.
• 7-Day Average Temperature
Percentiles
Compares the anticipated 7-day average temperature for
each climate
region to the expected range of averages for the same 7 days, based on
the 1990-1999 distribution of observations.
• State Degree Day Outlook Tables
• Heating
Degree Days
• Cooling
Degree Days
• Probability of
Exceedence Graphs
• Monitoring & Data
CPC produces maps showing
observed degree days, departures from normal, averaged temperature
percentile, and winter energy savings based on temperature; and provides
station and regional data.
• U.S. Degree Day Maps
• Last Week HDD &
HDD
• Season-to-Date
• HDD's
for Full 1999-2000 Season (November - March)
• CDD's for Full 2000 Season
(May - September)
• Winter Season Departure from Normal Energy Usage
Based on Heating Degree Days
•1999-2000
•1998-99
•1997-98
• Current Statistics (Projected and Observed) by Climate Region
•Degree
Day and Temperature Anomalies/Percentiles (HTML)
•Degree
Day and Temperature Anomalies/Percentiles (ASCII)
• Current Statistics (Observed) by State
•Degree
Day Deviations from Normal
• Forecast Verifications
Maps comparing forecast and observed degree day statistics
• March
6 - 12, 2000 HDD
• March
13 - 19, 2000 HDD
• March
20 - 26, 2000 HDD
• March
27 - April 2, 2000 HDD
• April
4 - 10, 2000 HDD
• April
10 - 16, 2000 HDD & CDD
• April
17 - 23, 2000 HDD & CDD
• April
24 - 30, 2000 HDD & CDD
• May
1 - 7, 2000 CDD
• May
8 - 14, 2000 CDD
• May
15 - 21, 2000 CDD
• May
22 - 28, 2000 CDD
• May
29 - June 4, 2000 CDD
• June
5 - 11, 2000 CDD
• June
12 - 18, 2000 CDD
• June
19 - 25, 2000 CDD
• June
26 – July 2, 2000 CDD
• July
3 - 9, 2000 CDD
• July
10 - 16, 2000 CDD
• July
17 - 23, 2000 CDD
• July
24 - 30, 2000 CDD
• July
31 – August 6, 2000 CDD
• August
21 - 27, 2000 CDD
• September 11 - 17,
2000 CDD
• September 18 - 24,
2000 CDD
• October 2 - 8, 2000 CDD
• October 16 - 22, 2000 CDD
& HDD
• October 23 - 29, 2000
CDD & HDD
|
