|
Contributors:
- Angell, J.K. ERL/Air Resources Laboratory
- Gelman, M.E. NWS/Climate Prediction Center
- Hofmann, D. ERL/Climate Monitoring and Diagnostic Lab.
- Long, C.S. NWS/Climate Prediction Center
- Miller, A.J. NWS/Climate Prediction Center
- Nagatani, R.M. NWS/Climate Prediction Center
- Oltmans, S. ERL/Climate Monitoring and Diagnostic Lab.
- Planet, W.G. NESDIS/Office of Research and Applications
Concerns of possible global ozone depletion (e.g. WMO/UNEP, 1994) have led to major
international programs to monitor and explain the observed ozone variations in the
stratosphere. In response to these, as well as other long-term climate concerns, NOAA has
established routine monitoring programs utilizing both ground-based and satellite
measurement techniques (OFCM, 1988).
Selected indicators of stratospheric climate are presented in each Summary from
information contributed by NOAA personnel. A Summary for the Northern Hemisphere
is issued each April, and, for the Southern Hemisphere, each December. These Summaries
are available on the World-Wide-Web, at the site: http://www.cpc.ncep.noaa.gov
with location: products/stratosphere/winter_bulletins
Further information may be obtained from:
Alvin J. Miller
NOAA Climate Prediction Center
5200 Auth Road
Washington D. C. 20233
Telephone: (301) 763-8071, ext. 7552
Fax: (301) 763-8125
E-mail: alvin.miller@noaa.gov
ABSTRACT Total ozone values over Antarctica during September and October 1997
were extremely low, 15 percent to more than 40 percent lower than amounts previous to the
early 1980's. The minimum values measured in 1997 were only slightly higher than record
low values observed in recent years. The area covered by the "ozone hole", with
total ozone values of less than 220 Dobson Units, was as much as 22 million square km in
late September to early October 1997, and larger than 16 million square km during all of
September and October 1997. Ozone profiles over the South Pole in 1997 showed nearly
complete destruction of ozone from just below 14 to just over 20 km, the largest vertical
extent of total depletion ever observed. Furthermore, in 1997 the region of substantial
ozone destruction extended up to 23 km in altitude, about 2 km higher than when the
current continuous NOAA ozonesonde series began at the South Pole in 1986. Lower
stratosphere temperatures over the Antarctic region in September and October 1997 were
near record low values, and sufficiently low (lower than -78°C) from May to October, for
polar stratospheric clouds to form over a large region, augmenting stratospheric ozone
destruction.
I. DATA SOURCES
The data available are listed below. This combination of complementary data, from
different platforms and sensors, provides a strong capability to monitor global ozone and
temperature.
| METHOD OF OBSERVATION |
| Parameter |
Ground-Based |
Satellite/Instrument |
| Total Ozone |
Dobson |
NOAA/SBUV/2 |
|
|
Nimbus-7/SBUV |
| Ozone Profiles |
Balloon - Ozonesonde |
NOAA/SBUV/2 |
|
|
Nimbus-7/SBUV |
| Temperature Profiles |
Balloon - Radiosonde |
NOAA/TOVS |
|
We used the total column ozone data from the NASA Nimbus-7 SBUV
instrument from 1979 through 1988, the NOAA-11 SBUV/2 from January 1989 to August 1994,
the NOAA-9 SBUV/2 instrument from September 1994 to June 1997, and the NOAA-14 SBUV/2
beginning July 1997. Solar Backscatter Ultra-Violet instruments can only produce data for
daylight-viewing conditions, so no SBUV/2 data are available at polar latitudes during
winter darkness. Increasing loss of NOAA-11 data at sub-polar latitudes was caused by
satellite precession from 1989 to 1994, resulting in SBUV-2 viewing during darkness also
at those latitudes. NOAA-14 total ozone data have not yet been validated to the extent of
NOAA-9 and NOAA-11 data. From preliminary comparisons of coincident data, however, we know
that NOAA-14 zonally averaged total ozone amounts are about 2 percent higher than those
from NOAA-9.
II. DISCUSSION
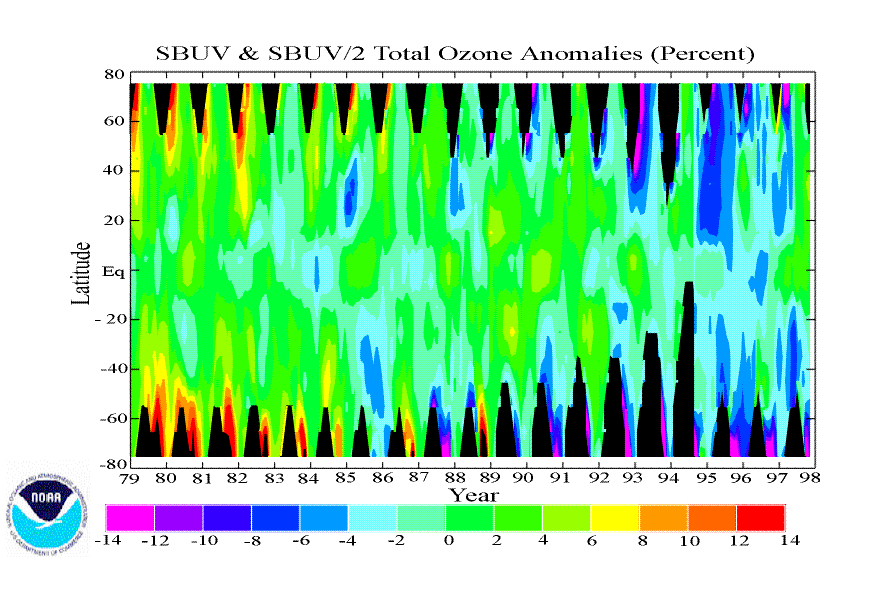
Figure 1 shows monthly average anomalies (percent) of
zonal mean total ozone, as a function of latitude and time, from January 1979 to November
1997. The anomalies are derived relative to each month's 1979-97 average. Certain aspects
of the long-term global ozone changes may be readily seen. Largest anomalies are shown for
polar regions in winter-spring months of each hemisphere. Positive anomalies of more than
10 percent in the earlier years change to consistent negative anomalies of greater than 10
percent for recent years. In September and October 1997, zonal mean anomalies in the south
polar region exceeded 14 percent (more than 28 percent lower than in earlier years).
In mid-latitudes, ozone has also been substantially lower in recent years than in
earlier years. The large negative anomalies seen in Figure 1
for the Northern Hemisphere extra-tropics during 1992-1993 (Gleason et al., 1993) were
related to the Mt. Pinatubo eruption in mid-1991. Those negative anomalies decreased in
1994 with the diminishing aerosol loading, but large negative total ozone anomalies again
developed in the Northern Hemisphere middle latitudes, peaking in early 1995. Stolarski et
al. (1992), Hollandsworth et al. (1995) and Miller et al. (1995), have indicated that the
trends of total ozone in mid-latitudes are statistically significant and are about -2 to
-4 % per decade. During 1997, Southern Hemisphere middle latitudes showed substantial
negative total ozone anomaly, peaking in April at up to 8 percent below the long-term
average. No significant trend has been found over the equatorial region. The positive
anomaly of up to 5 percent in 1997 replaced slightly negative values of 1996, with the
changes associated with the equatorial quasi-biennial oscillation. As mentioned in the
previous section, however, July to November total ozone data from NOAA-14 are biased by
about 2 percent higher than the NOAA-9 data, as seen from coincident data in the months
immediately preceding July 1997. That bias must be taken into account when interpreting
results using the preliminary NOAA-14 data.
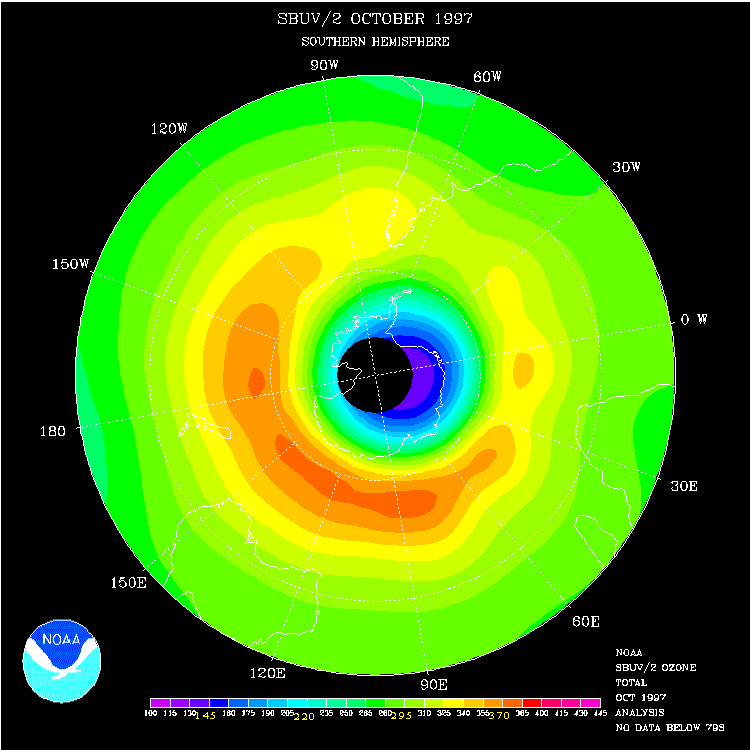
A map of monthly average Southern Hemisphere SBUV/2 total ozone for October 1997 is
shown in Figure 2. The region of highest ozone (yellow and
orange colors) is seen equatorward of the Antarctic region. Very low total ozone values
(blue and purple) are shown over most of the Antarctic continent. "Ozone hole"
values first began to appear over the Antarctic region in the 1980's (Farman et al.,
1985). In late August 1997, the "ozone hole" developed (defined by values below
220 Dobson Units), reaching lowest values approaching 100 DU in early October. Lowest
ozone values periodically moved off the South Pole, with the low ozone often extending
over the southern part of South America. "Ozone hole" values continued during
October and persisted till the middle of November 1997. Return to more normal polar
springtime conditions occurred rapidly with the collapse of the winter polar stratospheric
vortex.
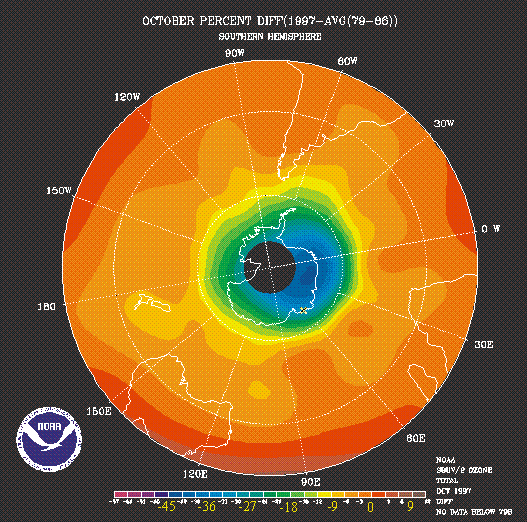
Figure 3 shows the percent difference between the monthly
mean total ozone for October 1997 and eight (1979-86) monthly means for October (Nagatani
et al., 1988). For October 1997, decreases in total ozone of 15 to more than 40 percent
(green and blue) are shown over Antarctica. Negative anomalies of approximately 10 percent
also extend over the southern tip of South America and New Zealand.
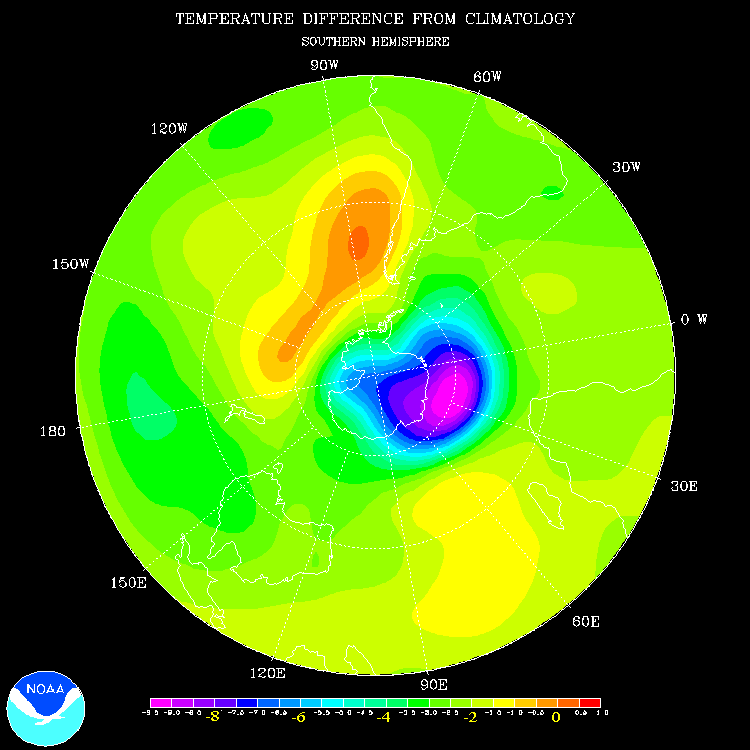
The October 1997 map of 50 hPa temperature anomaly (deviations from the 1979 to 1994
October average) is shown in Figure 4. Although, for
convenience, the base periods for the ozone anomaly map and the temperature anomaly map
are different, we note that the shape of the ozone anomaly field in Figure
3 is very similar to the distribution of 50 hPa temperature anomalies for October
1997, shown in Figure 4. This indicates the significant
meteorological dynamic component for the total ozone and temperature anomalies (Finger et
al., 1995).
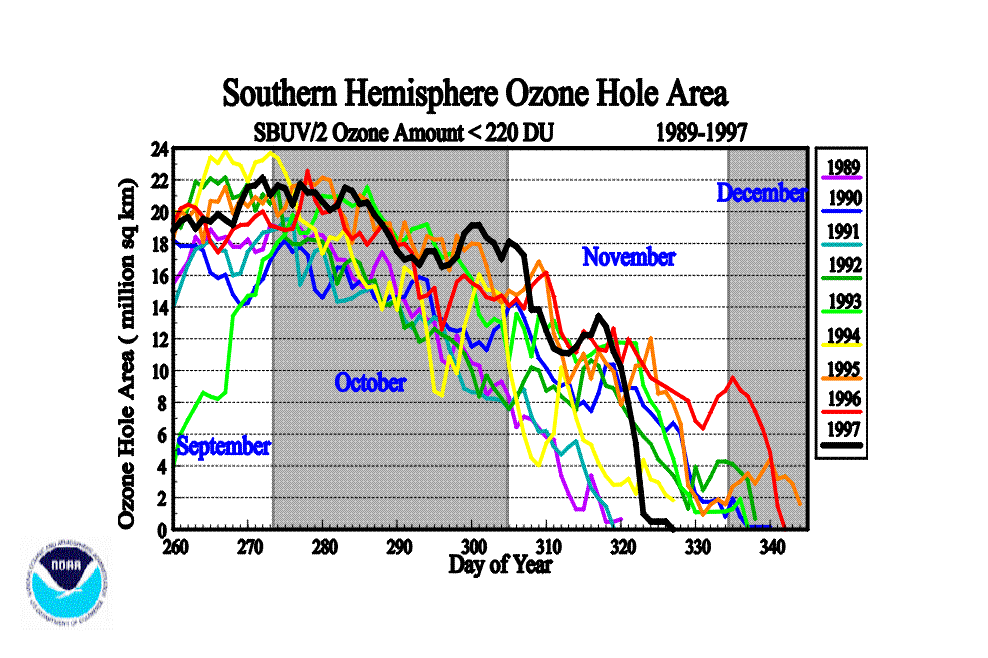
Figure 5 shows the area covered by the "ozone
hole". In the Southern Hemisphere winter-spring of 1997, the area of the ozone hole
was similar to recent record-setting years, and substantially larger than earlier years
such as 1989 and 1990. The ozone hole area was larger than 16 million square km during all
of September and October 1997, with maximum area about 22 million square km during late
September to early October. The area diminished after mid-October, and the region of
extremely low ozone quickly disappeared in mid-November 1997. The duration in 1997 was
different from most other recent years, when the ozone hole values persisted into late
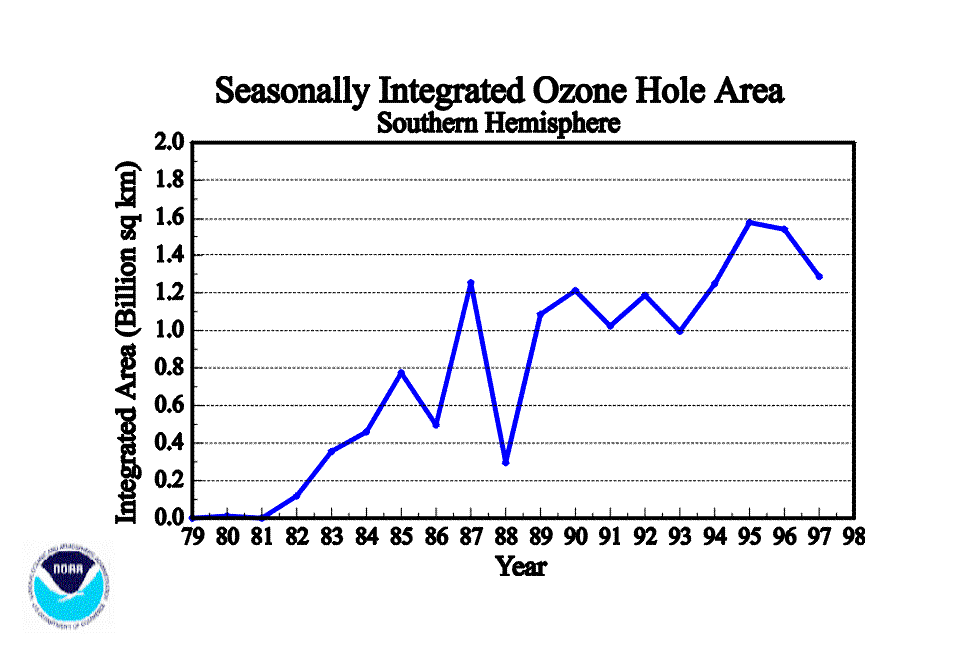
November and early December. An upward trend from 1979 to 1997 is shown in Figure 6 in the combined area covered by the ozone hole and its
time of duration (from September to December of each year). Although the seasonally
integrated area of the ozone hole for 1997 was not as large as for some recent years, the
increase for recent years from earlier years is quite apparent.
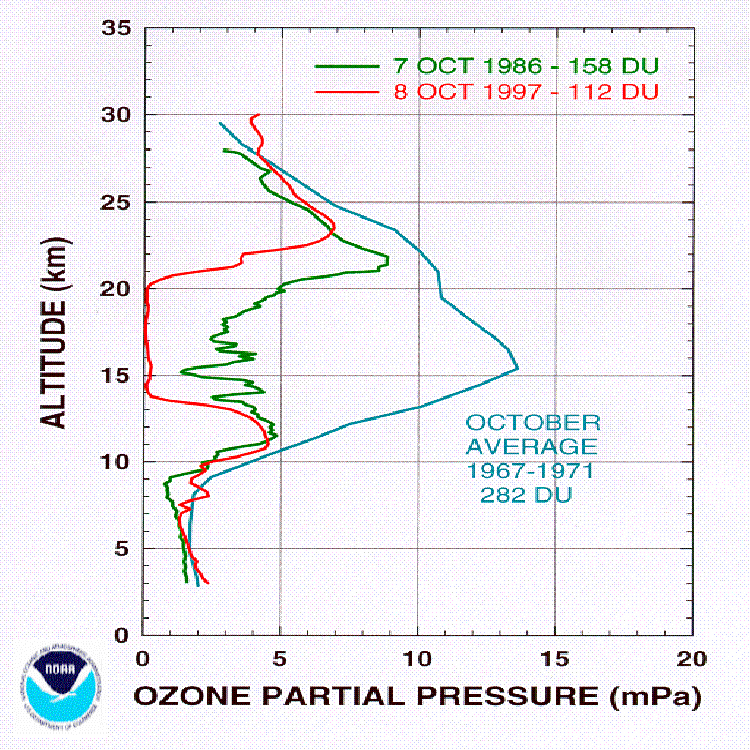
Minimum total column ozone at the South Pole in 1997 was measured by the balloon-borne
ozone sounding on October 8. The total ozone value of 112 DU for that sounding was similar
to minimum values of the past several years. Figure 7
compares the October 8, 1997 profile with the minimum total ozone profile of 1986 (158 DU)
when NOAA's continuous ozonesonde program at South Pole began. Also shown is the average
of South Pole ozonesonde profiles from previous measurements in October from 1967-1971
(282 DU). This comparison shows the remarkable growth of the ozone hole over a thirty year
period. Of special interest in 1997 is the extent of the altitude region over which total
destruction of ozone was observed, from just below 14 km to just over 20 km. This is the
largest zero-ozone region observed to date, and the region of total destruction also
extended to higher altitudes than ever before. The extension of the ozone hole in the
vertical direction is clear from comparison of the 1986 and 1997 ozone profiles. Whereas
the top of the substantially depleted ozone region was near 21 km in 1986, it is now near
23 km.
Temperatures in the lower stratosphere are closely coupled to ozone through dynamics
and photochemistry. Extremely low stratospheric temperatures (lower than -78°C) over the
Antarctic region are believed to contribute to depletion of ozone, in that low
temperatures lead to the presence of polar stratospheric clouds (PSCs). PSCs enhance the
production and lifetime of reactive chlorine, leading to ozone depletion (WMO/UNEP, 1994).
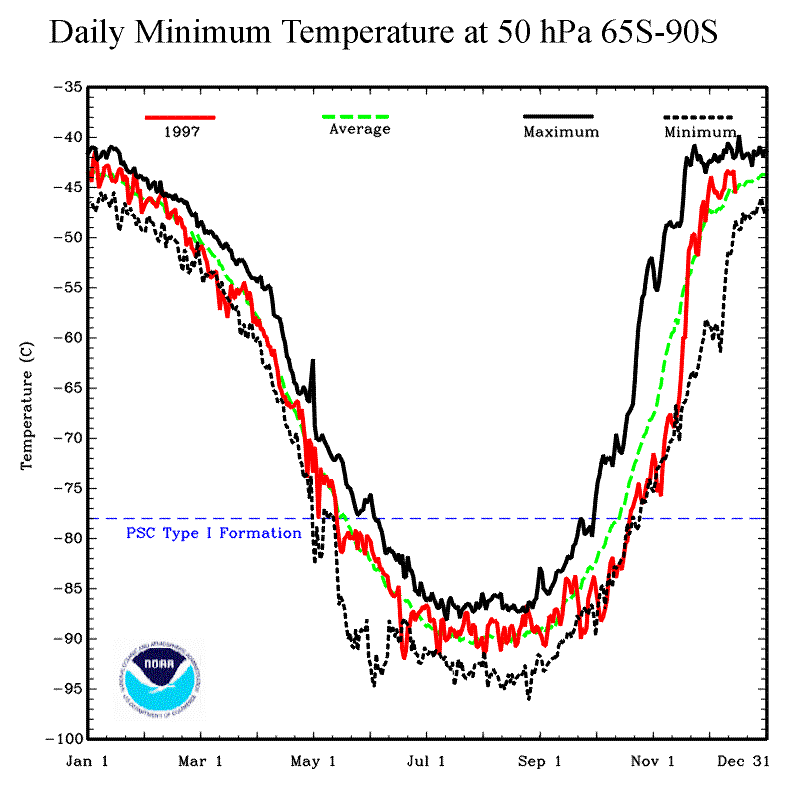
Daily minimum temperatures over the polar region, 65°S to 90°S at 50 hPa
(approximately 19 km) are shown in Figure 8. From the end of
September through October1997, minimum temperatures in the polar region were substantially
lower than average and near record low values. Minimum temperatures were sufficiently low
(lower than -78°C) from May through October 1997 for polar stratospheric clouds to form
and allow enhanced ozone depletion.
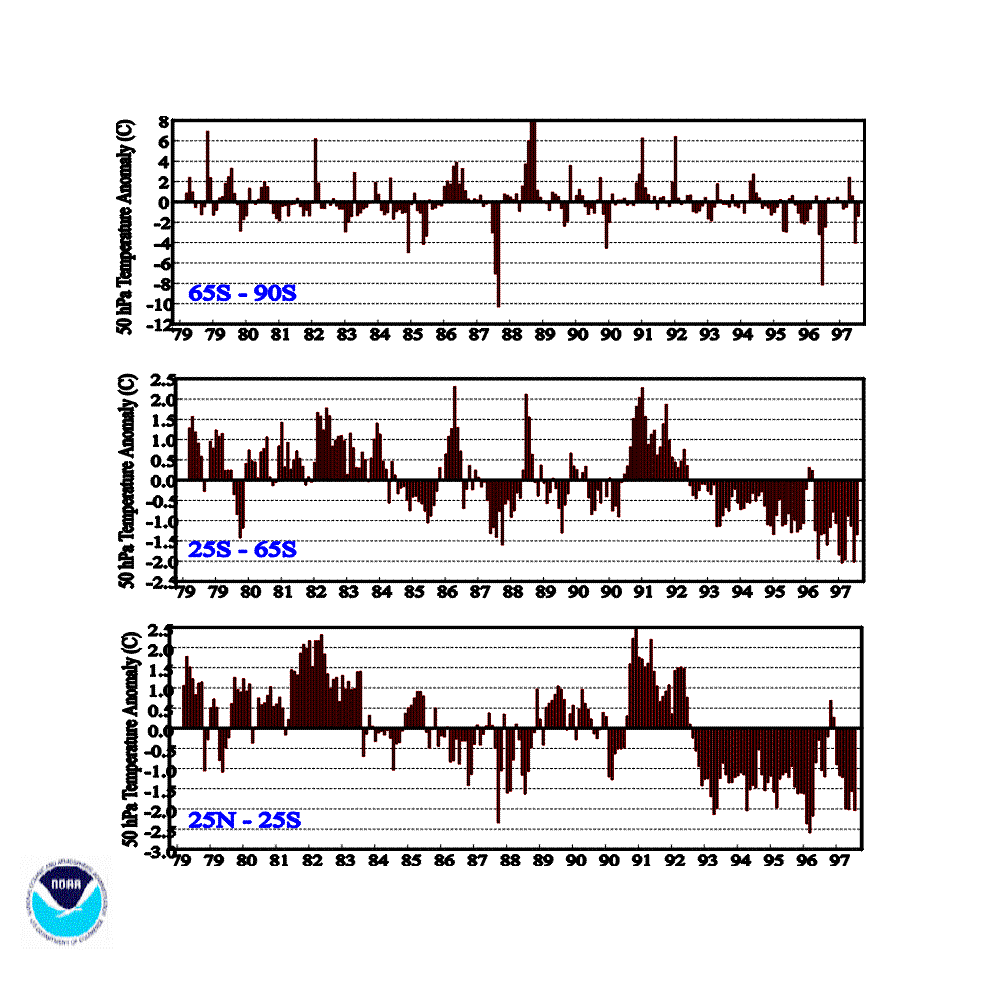
Figure 9 shows monthly average temperature anomalies at
50 hPa for three latitude regions, 65°S-90°S, 25°S-65°S, and 25°N-25°S (after Gelman
et al., 1986). For the mid-latitude and equatorial regions, temperature anomalies during
1997 were near record low values. For the south polar region, temperatures were near
average for most months, but substantially below average for September and October 1997.
III. CONCLUDING REMARKS
In 1997, very low total column ozone values (near 100 DU) were again observed over
Antarctica. Ozone depletion of 15 percent to more than 40 percent in total ozone was
observed over Antarctica compared to amounts observed previous to the early 1980's.
Vertical soundings over the South Pole again in October 1997 showed nearly complete
destruction of ozone at altitudes between 14 and 20 km. The altitudes of substantial ozone
destruction in 1997 extended up to near 23 km, about 2 km higher than in 1986.
Although total reactive halogen, termed "effective equivalent chlorine" or
EECl, has peaked at the surface (Montzka et al., 1996), it is not expected to peak in the
stratosphere until 1998-1999. Thus, the vertical extension of the ozone hole is likely a
result of the continued increase in stratospheric EECl. Another possible contributing
factor is abnormally low temperatures at these levels, which would increase the presence
of polar stratospheric clouds necessary for the chlorine-catalyzed, heterogenous ozone
destruction process. It is expected that as EECl levels begin to decline in the
stratosphere during the first decades of the 21st century, this extension of the
"ozone hole" will reverse, and this will be a sensitive indicator of the
beginning of ozone hole recovery (Hofmann et al. 1997). Although minimum October Antarctic
ozone levels are not expected to be much different for the next 10-20 years, ozone could
be further reduced by about 10% for a few years following a major volcanic eruption, as
was the case following the 1991 eruption of Pinatubo, with total ozone reaching values in
the 90 DU range in 1993 (Hofmann et al., 1996). Such eruptions temporarily place aerosol
particles in the lower stratosphere which augment stratospheric cloud particles and
exacerbate the heterogenous ozone destruction process.
Lower stratosphere temperatures over the Antarctic region during September and October
1997 were near record low values, and were sufficiently low from May to October for ozone
destruction to proceed on polar stratospheric clouds within the polar vortex. Total ozone
declined over mid-latitudes at the rate of about 2 to 4 percent per decade since 1979.
A full explanation of ozone and temperature anomalies must include all aspects of ozone
photochemistry and meteorological dynamics. Continued monitoring and measurements
including total ozone and vertical profiles are essential toward this end.
IV. REFERENCES
Farman, J.C., B.G. Gardiner and J.D. Shanklin, 1985: Large losses of total ozone in
Antarctica reveal seasonal CLOx/NOx interaction, Nature, 315, 207-210.
Finger. F.G., R.M. Nagatani, M.E. Gelman, C.S. Long, and A.J. Miller, 1995: Consistency
between variations of ozone and temperature in the stratosphere. Geophys. Res. Lett.,
22, 3477-3480.
Gelman, M.E., A.J. Miller, K.W. Johnson and R.M. Nagatani, 1986: Detection of long-term
trends in global stratospheric temperature from NMC analyses derived from NOAA satellite
data. Adv. Space Res., 6, 17-26.
Gleason, J., P.K. Bhartia, J.R. Herman, R. McPeters, P. Newman, R.S Stolarski, L.
Flynn, G. Labow, D. Larko, C. Seftor, C. Wellemeyer, W.D. Komhyr, A. J. Miller, and W.
Planet, 1993: Record low global ozone in 1992. Science, 260, 523-526.
Hofmann, D.J., S.J. Oltmans, J.A. Lathrop, J.M. Harris, and H. Voemel, 1996: Record low
ozone at the South Pole in the Spring of 1993, Geophys. Res. Lett., 21,
421-424.
Hofmann, D.J., S.J. Oltmans, J.M. Harris, B.J. Johnson, and J.A. Lathrop, 1997: Ten
years of ozonesonde measurements at the South Pole: implications for recovery of
springtime Antarctic ozone, J. Geophys. Res., 102, 8931-8943.
Hollandsworth S.M., R.D. McPeters, L. Flynn, W.G. Planet, A.J. Miller, and S. Chandra,
1995: Ozone trends deduced from combined Nimbus 7 SBUV and NOAA-11 SBUV/2 data. Geophys.
Res. Lett., 22, 905-908.
Miller, A.J., G.C. Tiao, G.C. Reinsel, D. Wuebbles, L.Bishop, J. Kerr, R.M. Nagatani,
J.J. DeLuisi, and C.L. Mateer, 1995: Comparisons of observed ozone trends in the
stratosphere through examination of Umkehr and balloon ozonesonde data. J. Geophys.
Res., 100, 11209-11217.
Montzka, S.A., J.H. Butler, R.C. Myers, T.M. Thompson, T.H. Swanson, A.D. Clarke, L.T.
Lock, and J.W. Elkins, 1996: Decline in the tropospheric abundance of halogen from
halocarbons: implications for stratospheric ozone depletion, Science, 272,
1318-1322.
Nagatani, R.N., A.J. Miller, K.W. Johnson, and M.E. Gelman, 1988: An eight year
climatology of meteorological and SBUV ozone data, NOAA Technical Report NWS 40, 125pp.
OFCM, 1988: National Plan for Stratospheric Monitoring 1988-1997. FCM-P17-1988. Federal
Coordinator for Meteorological Services and Supporting Research, U.S. Dept. Commerce,
124pp.
Stolarski, R., R. Bojkov, L. Bishop, C. Zerefos, J. Staehelin, and J. Zawodny, 1992:
Measured trends in stratospheric ozone, Science, 256, 342-349.
WMO/UNEP, 1994: Scientific assessment of ozone depletion: 1994. Report No. 37, WMO.
|


