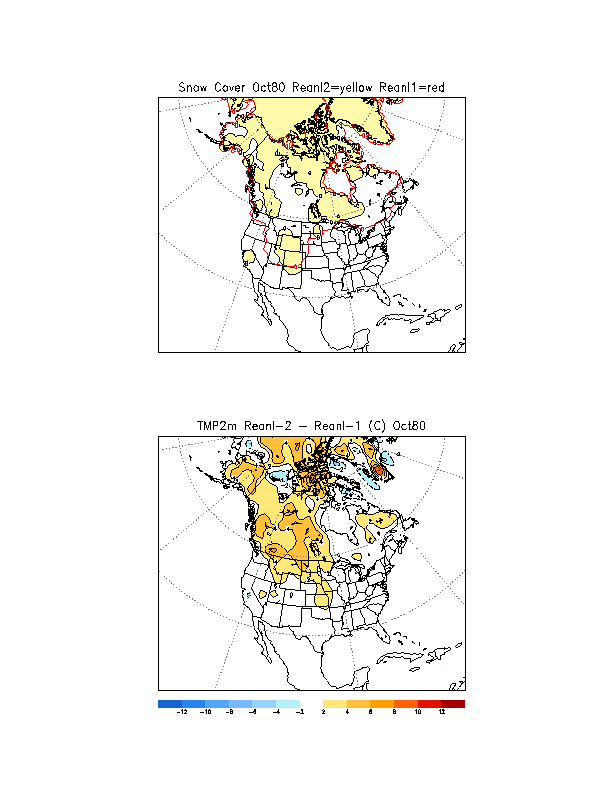
Fig 1. Yellow is the observed snow cover as used by Reanalysis 2, and the red line indicates the (wrong) snow cover used by N/N Reanalaysis (October 1980).
Fig 2. The difference between the 2 meter temperature between Reanalaysis-2 and N/N Reanalysis (October 1980). This shows the local effect of using the wrong snow mask.