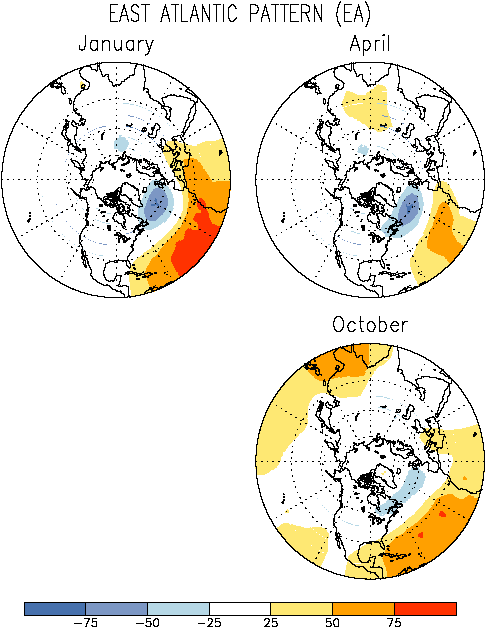
Map (Positive Phase)
Plotted Historical Time Series : (January 1950-February 1997)
Monthly Tabulated indices Part I: Last 13 months of indices for selected teleconnection patterns, as appears in the Climate Diagnostics Bulletin.
Plotted Recent Monthly Time Series
Plotted Recent Daily Time Series
Table Archive of Indices Dating Back to 1950
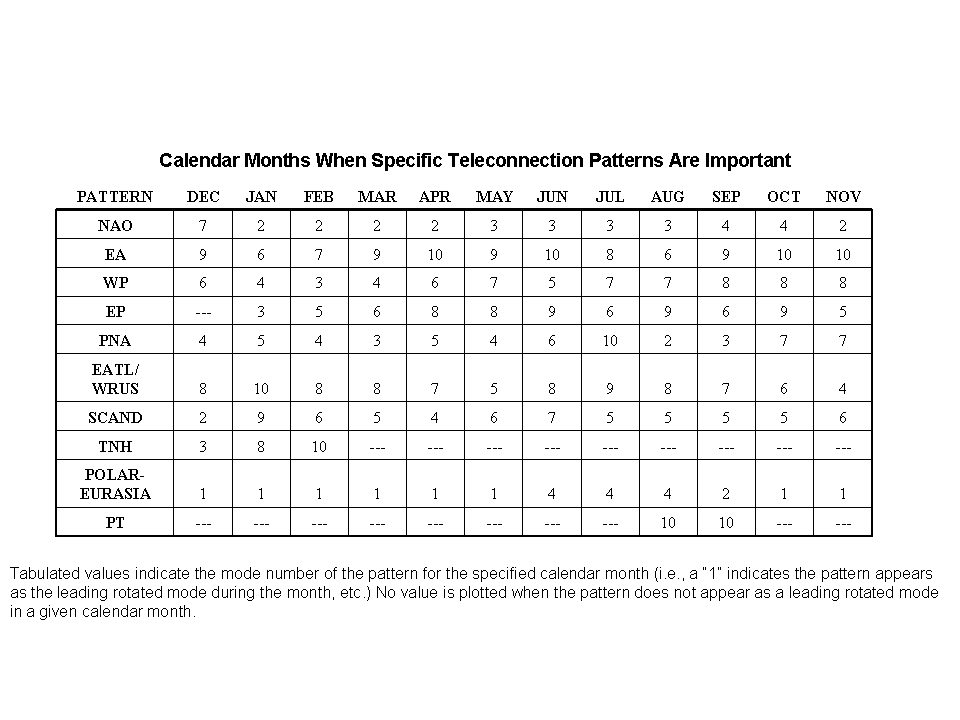
Table showing Calendar months when specific teleconnection patterns are important
The East Atlantic pattern is the second of three prominent modes of low-frequency variability over the North Atlantic, appearing in all months except May-August. The pattern is structurally similar to the NAO, and consists of a north-south dipole of anomaly centers which span the entire North Atlantic Ocean from east to west. However, the anomaly centers in the EA pattern are displaced southeastward to the approximate nodal lines of the NAO pattern. For this reason, the EA pattern is often mistaken as simply a slightly `southward-shifted' NAO pattern. Also, the lower-latitude center contains a strong subtropical link, reflecting large-scale modulations in the strength and location of the subtropical ridge. This subtropical link also makes the EA pattern distinct from its NAO counterpart. This EA pattern is similar to that shown in the Barnston and Livezey (1987) study, but is distinctly different from the EA pattern originally defined by Wallace and Gutzler (1981).