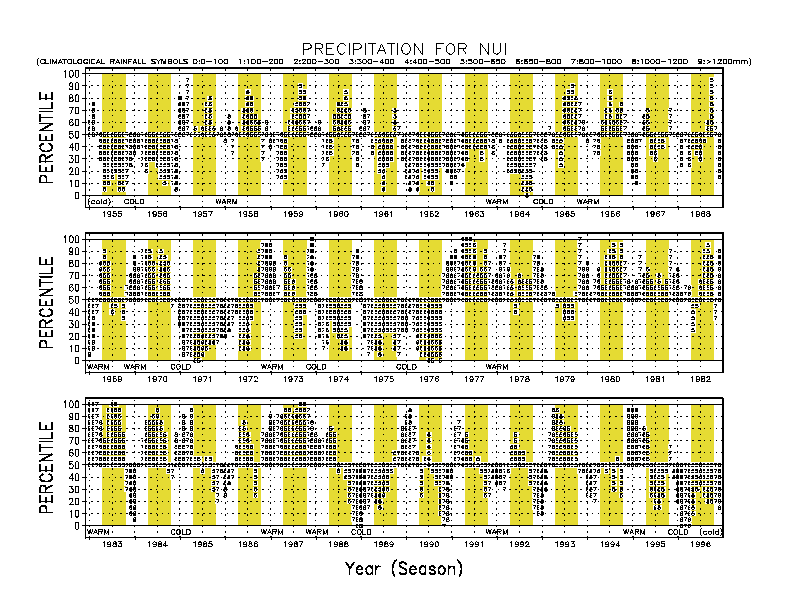
Histogram of the percentiles of rainfall for running 3-month periods in chronological order from 1955
through 1996. Numerical symbols that form the bars of the histogram reflect the climatological rainfall amount for the season in question; these repeat
identically from one year to the next. The climatological rainfall amount categories represented by each numerical symbol used to form the histogram
bars are shown in the legend along the top of the figure. Histogram bars are plotted with respect to the median, extending upward for above-median
percentiles and downward for sub-median percentiles. Percentiles are rounded to the nearest 5 %ile, such that 50 %ile indicates 47.5-52.5 %ile, 35
indicates 32.5-37.5 %ile, etc. The 0 and 100 %iles denote the 0.0-2.5 and 97.5 to 100.0 %iles intervals, respectively. The numerical symbols enable
a user to determine whether a period of rainfall deficit (shown as a downward-directed bar) coincides with a rainy part of the year or a dry part of the
year. To further facilitate the recognition of the normal wetness of the time of year, the shading
indicates the six driest 3-month periods of the year. The shading repeats identically for each year as a fixed cycle, in similar fashion to the numerical
symbols. The ENSO status of each boreal winter is shown underneath the main panels of the histogram.