|
The
canonical correlation analysis (CCA) forecast of SST in the central Pacific
(Barnett et al. 1988, Science, 241, 192‑196; Barnston and
Ropelewski 1992, J. Climate, 5, 1316‑1345), is shown in Figs.
F1 and F2. This forecast
is produced routinely by the Prediction Branch of the
Climate
Prediction
Center
. The predictions from the National Centers for
Environmental Prediction (NCEP) Coupled Forecast System Model (CFS03) are
presented in Figs. F3 and F4a,
F4b. Predictions
from the Markov model (Xue, et al. 2000: J. Climate, 13,
849‑871) are shown in Figs. F5 and F6.
Predictions from the latest version of the LDEO model (Chen et al.
2000: Geophys. Res. Let., 27, 2585‑2587) are shown in Figs.
F7 and F8.
Predictions using linear inverse modeling (Penland and Magorian 1993:
J. Climate, 6, 1067‑1076) are shown in Figs. F9
and F10. Predictions from the Scripps / Max
Planck Institute (MPI) hybrid coupled model (Barnett et al. 1993: J.
Climate, 6, 1545‑1566) are shown in Fig. F11.
Predictions from the ENSO‑CLIPER statistical model (Knaff and
Landsea 1997, Wea. Forecasting, 12, 633‑652) are shown in
Fig. F12.
Niño 3.4 predictions are summarized in Fig. F13,
provided by the Forecasting and Prediction Research Group of the IRI.
The CPC and
the contributors to the Forecast Forum caution potential users of this
predictive information that they can expect only modest skill.
Outlook
A transition from weak warm-episode (El Niño) conditions to ENSO-neutral
conditions is expected during the next three months.
Discussion
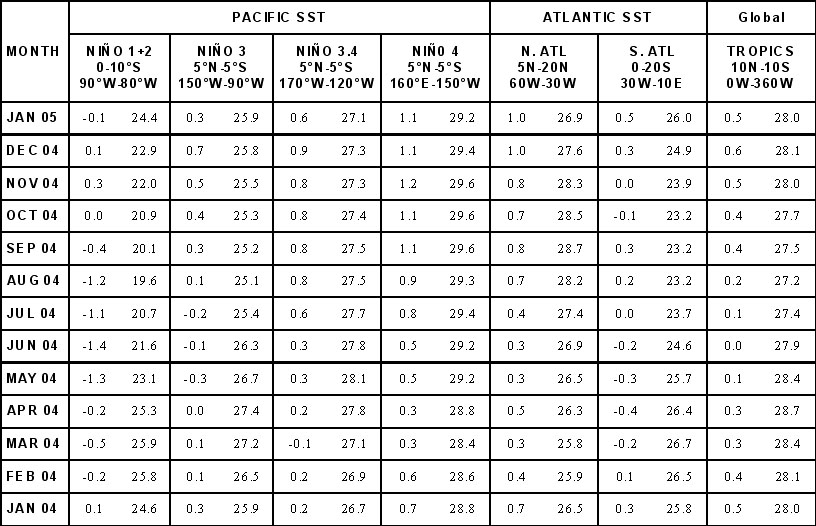
Sea
surface temperature (SST)
anomalies decreased in the equatorial Pacific everywhere east of the date
line during January 2005, resulting in decreases in all of the Niño
indices with the exception of Niño 4 (Table
T2). However, positive
sea surface temperature (SST) anomalies greater than +1°C (~1.8°F)
persisted in portions of the central and western equatorial Pacific (Fig. T18).
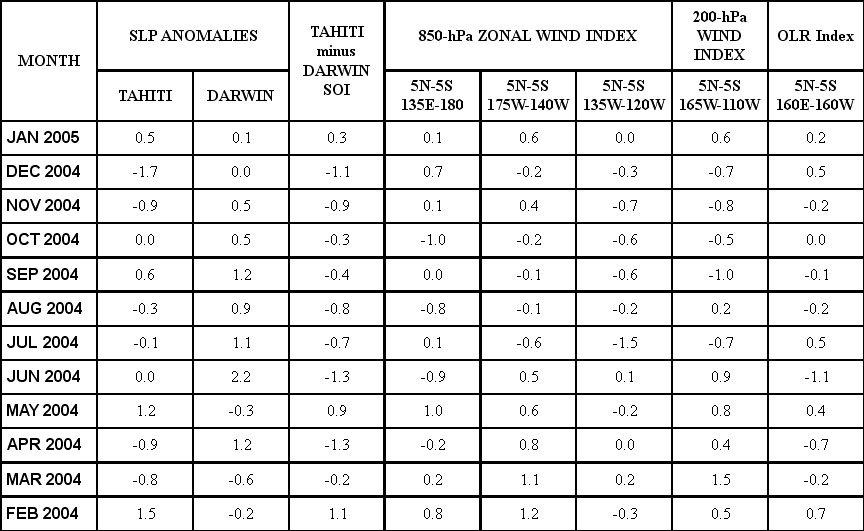
The pattern of anomalous warmth in the equatorial Pacific in recent
months (Fig. T9) and the most recent
five-month running mean value of the Southern Oscillation Index (-0.5)
(Fig. T1) indicate that a weak warm
(mid-Pacific El Niño)
episode is continuing. However, through December
2004 there was a lack of
persistent enhanced convection over the anomalously warm waters of the
central equatorial Pacific (Fig. T11), which
has limited El Niño-related impacts.
Through most
of 2004 MJO activity resulted in week-to-week and month-to-month variability
in many atmospheric and oceanic indices (Tables
T1 and T2). The MJO
activity weakened considerably during early November 2004 and remained weak
through mid-December. During the last half of December the MJO strengthened,
as enhanced convection and precipitation over the
Indian Ocean
shifted eastward across
Indonesia
into the western tropical Pacific by early January.
Since then enhanced convection has persisted in the western equatorial
Pacific and expanded eastward into the central equatorial Pacific (Figs.
T11 and T25),
accompanied by a weakening of the low-level easterly winds over the region (Fig.
T13). At this time it is not clear whether the
recent enhanced convection and weakening of the easterly winds in the central
equatorial Pacific are transient features (related to the MJO) or perhaps
evidence of a coupling between the anomalously warm waters and the overlying
atmospheric circulation.
The value of the Oceanic Niño
Index (ONI; 3-month running mean average of SST anomalies in the Niño
3.4 region – computed using the Extended Reconstructed SST version-2 data
set) for November 2004 – January 2005
is +0.8°C,
which satisfies the NOAA operational definition of El Niño
for the sixth consecutive month. Based on the recent evolution of
oceanic and atmospheric conditions and on a majority of the statistical and
coupled model forecasts (Figs. F1,
F2, F3, F4a,
F4b, F5, F6,
F7, F8, F9,
F10, F11, F12
and F13),
it seems most likely that weak warm episode (El Niño) conditions will gradually weaken during the next three months and
that ENSO-neutral conditions will prevail during the last half of 2005.
Weekly
updates of SST, 850-hPa wind, OLR and features of the equatorial subsurface
thermal structure are available on the
Climate
Prediction
Center
homepage at:
http://www.cpc.ncep.noaa.gov/
|


