Pacific warm episode (El Niño)
conditions continued to weaken during February 2003 as sea surface
temperature (SST) anomalies decreased across the equatorial Pacific (Table
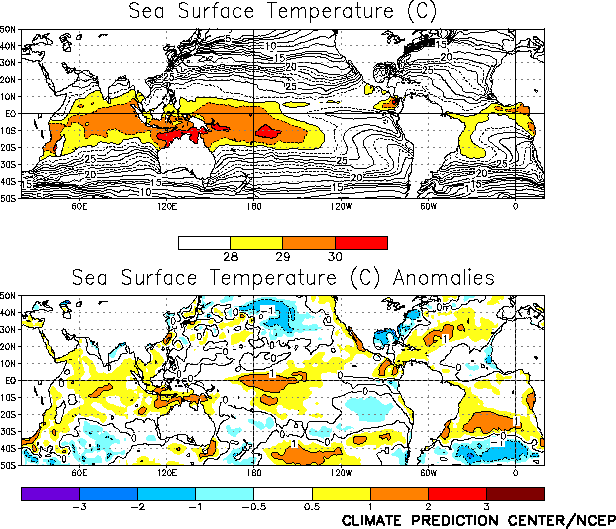
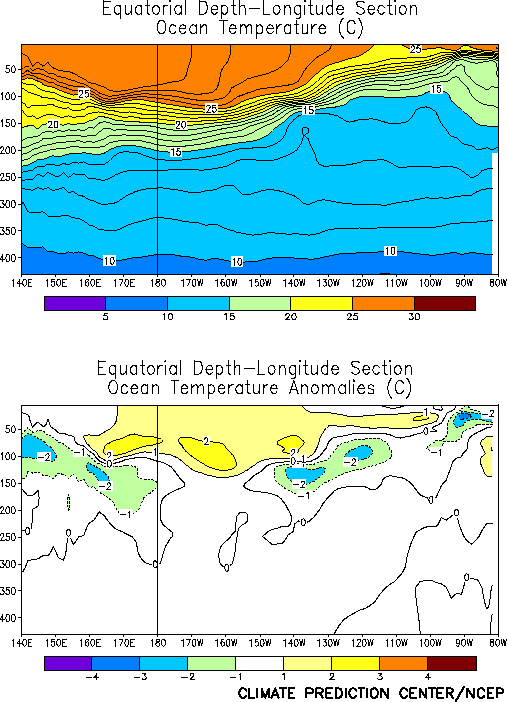
T2). SSTs remained more than 1.0°C
above normal in the central Pacific between 170°E
and 155°W, but were slightly cooler
than normal east of 120°W (Fig.
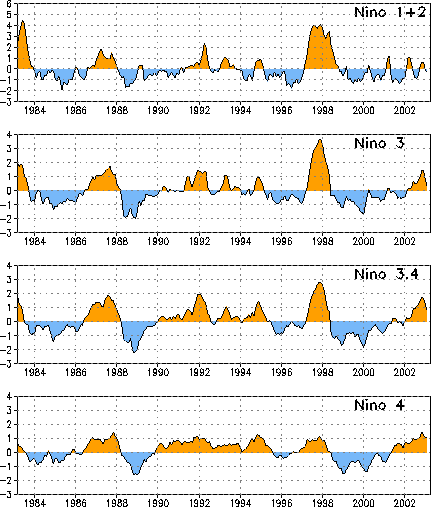
T18). The anomalies in all four Niño
region indices decreased for the second consecutive month, with the largest
decrease again occurring in the Niño
3 region (Table T2, Fig. T5). The values observed in both Niño
3 and Niño 3.4 were the smallest
since May 2002 (Table T2, Fig. T5).
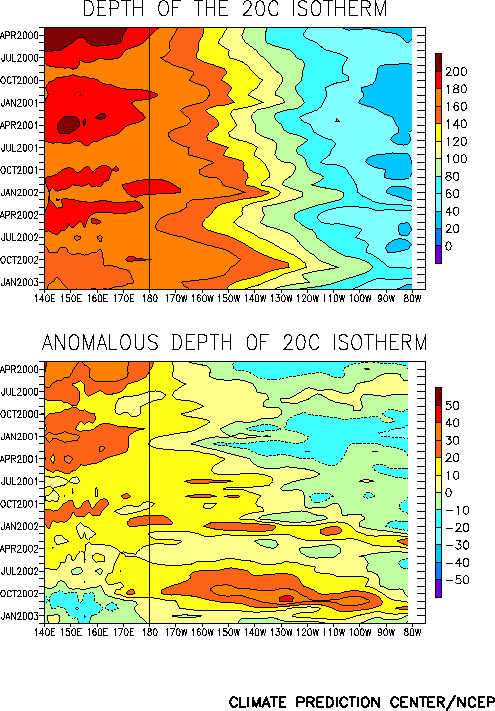
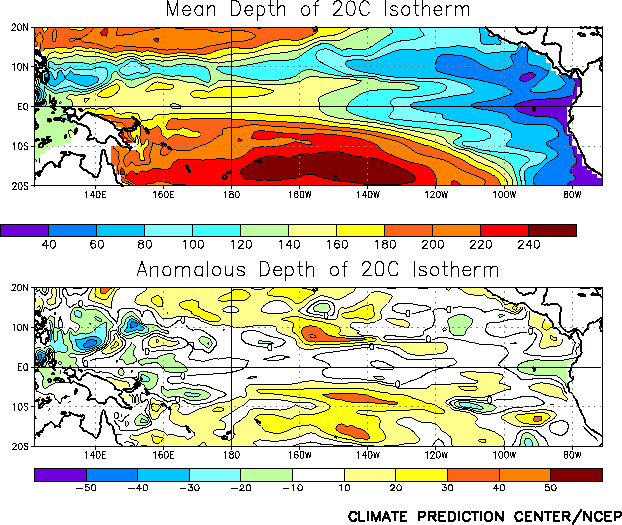
Consistent with weakening El Niño
conditions, the oceanic thermocline continued to shoal across the
east-central and eastern equatorial Pacific, with near-normal depths
observed during February across the central and eastern Pacific (Figs. T15,
T16). The shoaling has contributed to a decrease in upper-ocean
heat content, with anomalies decreasing to 1-2°C
above normal in the central and east-central Pacific (Fig. T17). Also
associated with this decrease in thermoclime depth, negative ocean
temperature anomalies (1-2°C below
normal) were recorded beneath the positive anomalies in the east-central
Pacific.
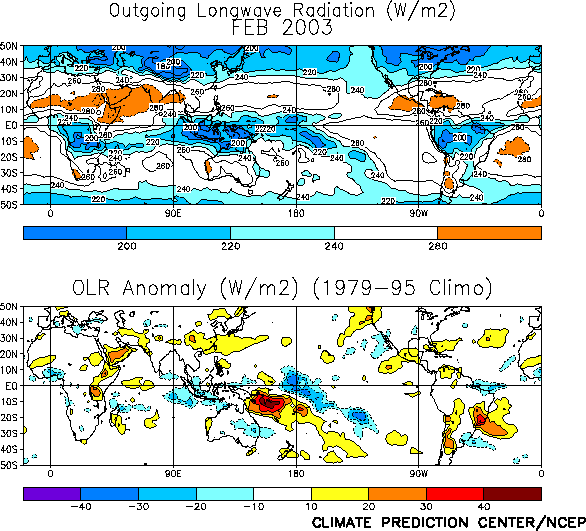
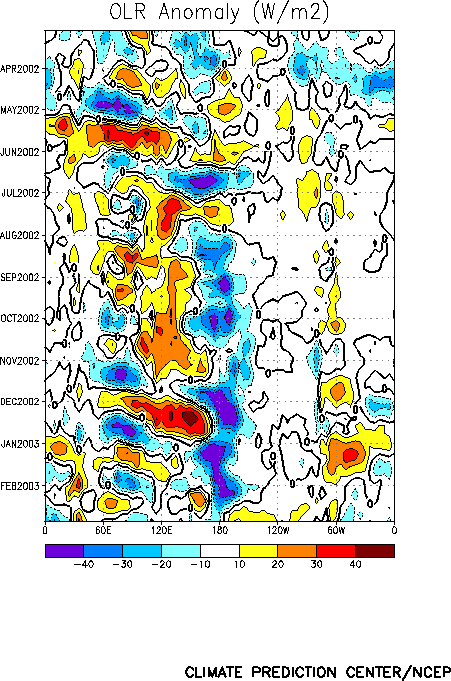
Convection (precipitation and cloudiness) remained enhanced across the
central equatorial Pacific and was near-normal or slightly above normal over
Indonesia during February (Fig. T25). Enhanced convection has
persisted over the central equatorial Pacific since August (Fig. T11),
consistent with ongoing warm episode conditions. Elsewhere, the pattern of
convection in the south-central Pacific reflected an eastward shift from
normal in the position of the South Pacific Convergence Zone.
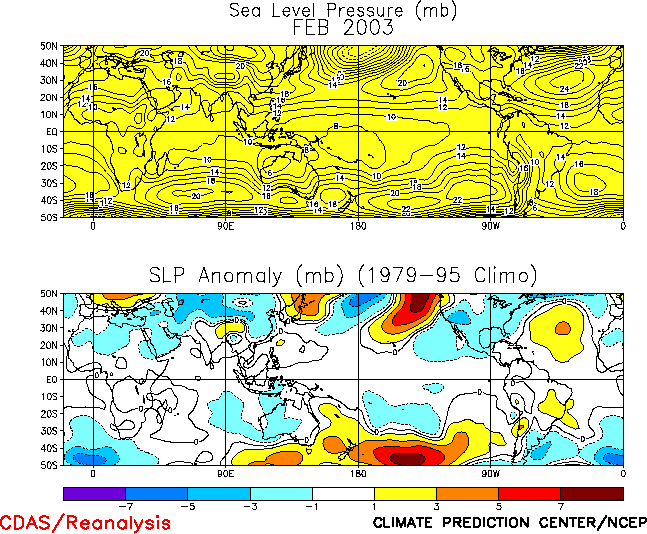
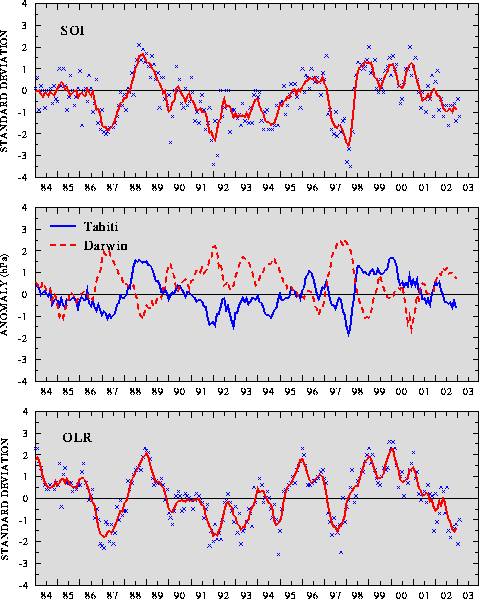
The tropical sea-level pressure (SLP) pattern during February featured
small negative SLP anomalies over the Indian and Pacific oceans and small
positive anomalies over the Atlantic (Fig. T19). This pattern was
associated with negative values of both the Tahiti-Darwin Southern
Oscillation Index (SOI) (-1,2) and the equatorial SOI (-0.2) (Figs. T1,
T2, respectively). The SOI has been negative for the past twelve months
(Fig. T1).


