|
1. Northern Hemisphere
The
500-hPa circulation pattern during February featured above-average heights
over the central North Pacific, the high latitudes of the
North Atlantic
, and throughout the polar region, and below-average heights over the
southwestern
United States
, and across the central
North Atlantic
eastward to the
Caspian Sea
(Fig. E9). The main surface temperature
departures during the month included above-average temperatures over
North America
and the central/ high latitudes of the
North Atlantic
, and below-average temperatures across the southern half of
Europe
and much of central/ eastern
Asia
(Fig. E1). The main precipitation anomalies
reflected well above-average totals over the southwestern
United States
and the
Caspian Sea
region, and significantly below-average precipitation from
Greenland
eastward to central
Russia
(Figs. E3, E5, E6).
a.
North America
The 500-hPa circulation pattern during February featured
above-average heights over much of
North America
. A pronounced split-flow configuration was also evident over western
North America
, with one branch of the westerlies entering the continent over northern
British Columbia
and the other entering over the
Baja
Peninsula
. These conditions were associated with a southward shift of the main jet
steam and storm track across the western U.S., which resulted in
significantly below-average precipitation in the Pacific Northwest and
above-average precipitation in the Southwest, Southern California, and the
southern Inter-Mountain regions of the United States (Figs. E3,
E5). Significantly above-average precipitation
during October 2004-February 2005 has led to a dramatic improvement in
long-term drought conditions in these latter three regions.
b.
North Atlantic
and
Europe
A high-amplitude omega-block
dominated the circulation over the
North Atlantic
during February (Fig. E9). Individual
components of this blocking pattern included a large-amplitude ridge over
the central
North Atlantic
, and flanking upper-level troughs over both the western
North Atlantic
and southern
Europe
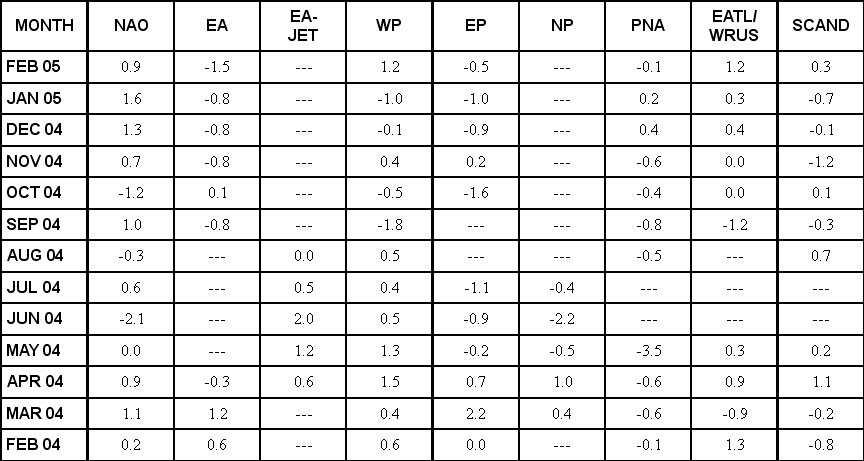
. This pattern reflected an ongoing strong negative phase (-1.5) of the
East Atlantic
teleconnection pattern, which has prevailed in five of the last six months (Table
E1, Fig. E7).
During February, the primary
storm activity in
Europe
was associated with the southern branch of a pronounced split-flow pattern (Fig.
E10). As a result, southeastern
Europe
, northern
Africa
, and portions of the
Middle East
, recorded above-average precipitation during the month, while the high
latitudes of the
North Atlantic
,
Scandinavia
, and western/ central
Russia
recorded significantly below-average precipitation (Fig. E3).
The
North Atlantic
also saw a continuation of exceptionally warm SSTs at both high latitudes
and in the subtropics (Fig. T18). This
warmth reflects the ongoing warm phase of the Atlantic multi-decadal mode
that began approximately in 1995 (Goldenberg et al. Science, 2001).
2. Southern Hemisphere
The 500-hPa circulation pattern during February featured
above-average heights over the western and central South Pacific, southern
South America
, and the central
Indian Ocean
, and below-average heights over the high latitudes of the eastern South
Pacific, in the areas just west of and just east of central
South America
, and over southeastern
Australia
(Fig. E15). In
South America
, the main surface temperature and precipitation anomalies were associated
with the persistent upper-level trough-ridge-trough pattern centered over
the continent. This circulation contributed to exceptionally warm surface
temperatures across southern
South America
, with departures in many areas exceeding the 70th percentile of
occurrences (Fig. E1). Well below-average
precipitation was also observed over much of central and southern
South America
, in association with the persistent upper-level ridge (Fig. E3).
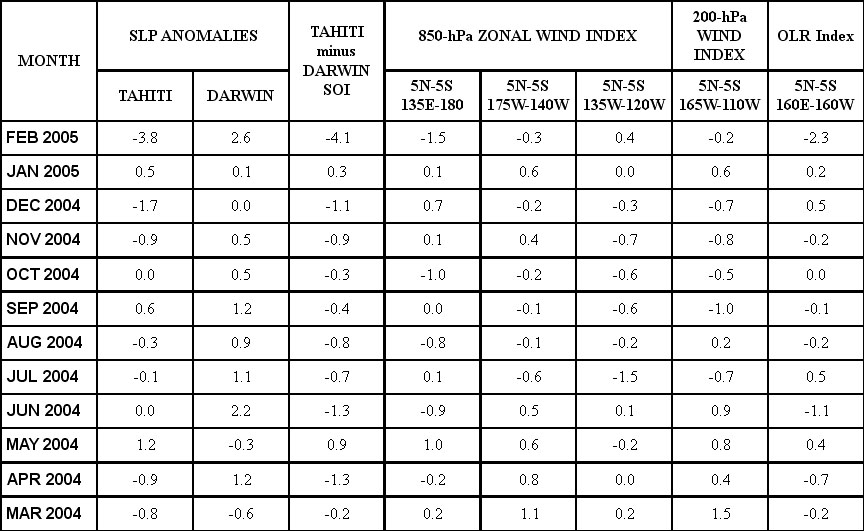
In
Australia
, anomalously warm and dry conditions in the north were consistent with a
near record negative value of the SOI during February (Table T1).
Anomalously cool and wet conditions in the southeast were consistent
with an enhanced upper-level tough and below-average surface pressure.
In southern
Africa
the rainy season normally lasts from October to April. During February
area-mean precipitation totals were well below-average, and generally in the
lowest 20th percentile of occurrences (Fig. E4).
The largest rainfall deficits were observed in
Mozambique
, where totals in many areas were below the 10th percentile of
occurrences. These deficits reflected an equatorward contraction of the main
region of tropical convection (Fig. T25),
which occurred in association with an anomalous upper-level cyclonic
circulation across southern
Africa
(Fig. T22). Exceptionally warm conditions
were again observed in South Africa during February, along with a
continuation of near-record sea-surface temperatures (ranging from 1°-2°C
above average) surrounding the country. These anomalously warm SSTs began
developing during June-August 2004, and have been at near-record levels
since November 2004.
|


