Skip Navigation Links www.nws.noaa.gov 
NOAA logo - Click to go to the NOAA home page National Weather Service   NWS logo - Click to go to the NWS home page
Climate Prediction Center


CPC Search
 
HOME > Expert Assessments > Climate Diagnostics Bulletin  
 

figure t28

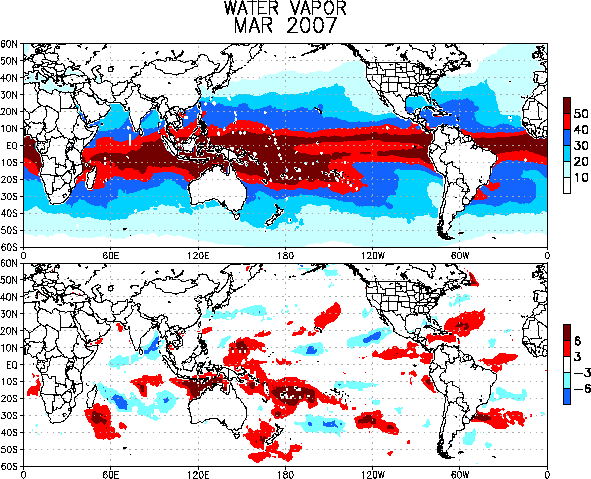
FIGURE T28. Vertically integrated water vapor or precipitable water (top) and anomaly (bottom), as determined by the SSMI (Ferraro et. al, 1996: Bull. Amer. Meteor. Soc., 77, 891-905). In bottom panel, regions with above- (below) normal water vapor are indicated by dark (light) shading. Units are kg (m)-2. Anomalies are calculated from the 1987–2006 base period means.


NOAA/ National Weather Service
National Centers for Environmental Prediction
Climate Prediction Center
5200 Auth Road
Camp Springs, Maryland 20746
Climate Prediction Center Web Team
Disclaimer Privacy Notice