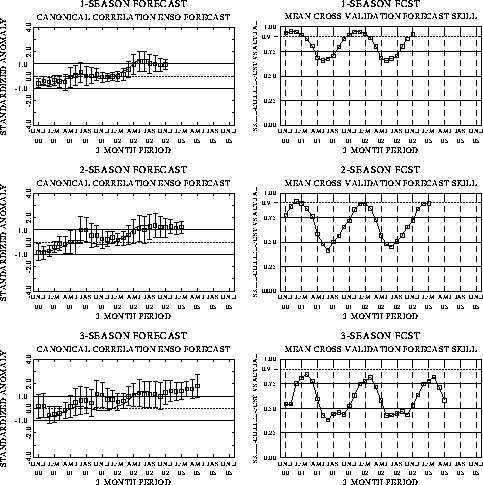
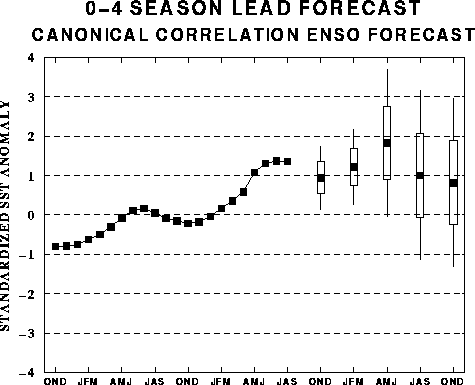
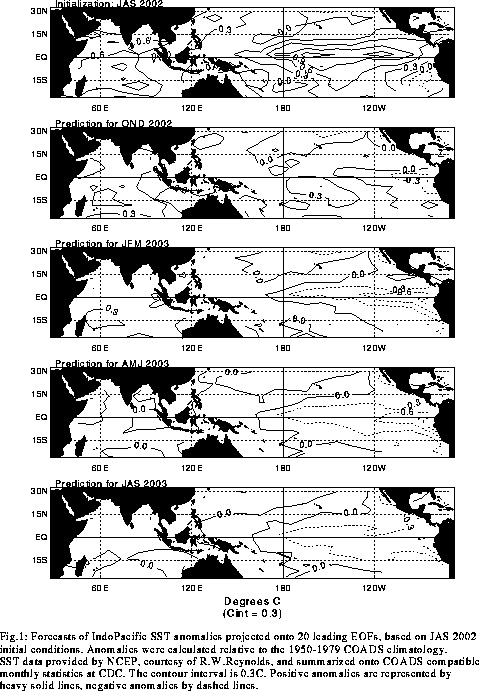
The canonical correlation analysis
(CCA) forecast of SST in the central Pacific (Barnett et al. 1988, Science, 241,
192-196; Barnston and Ropelewski 1992, J. Climate, 5, 1316-1345), is shown
in Figs. F1 and F2. This forecast
is produced routinely by the Prediction Branch of the Climate Prediction Center. The
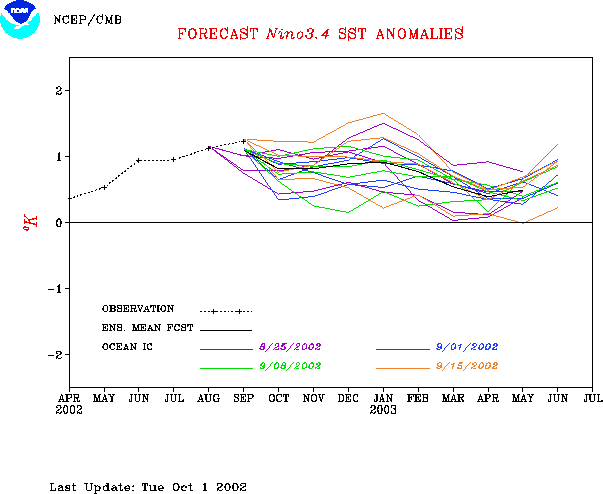
predictions from the National Centers for Environmental Prediction (NCEP) coupled
ocean/atmosphere model (Ji et al. 1998, Mon. Wea. Rev, 126, 1022-1034) are
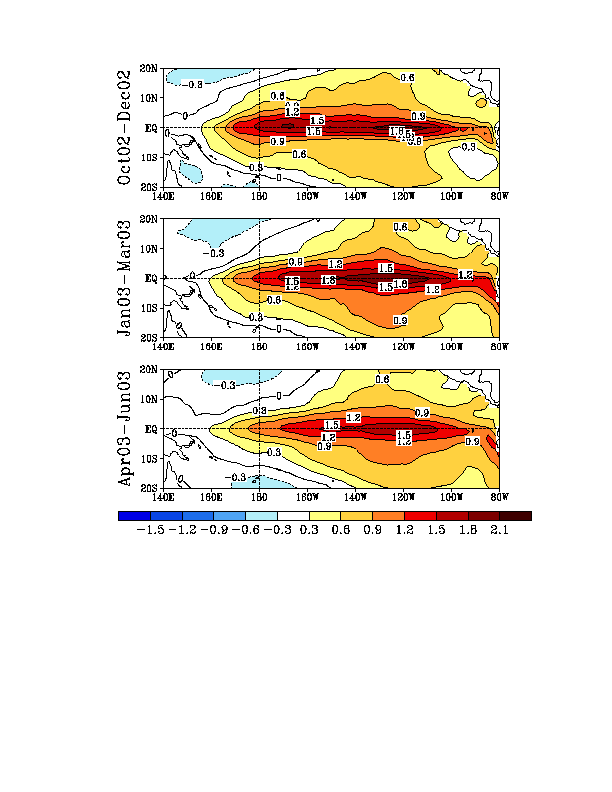
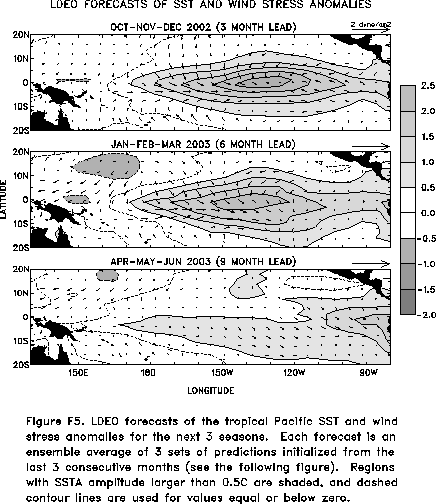
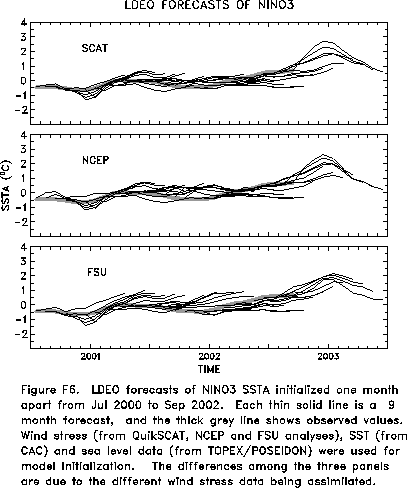
presented in Figs. F3 and F4a, F4b. Predictions from the Markov model (Xue, Y., A. Leetmaa,
and M. Ji, 2000: ENSO prediction with Markov model: The impact of sea level. J. Climate,
13, 849-871) are shown in Figs. F5 and F6.
Predictions from the latest version of the LDEO model (Chen, D., M. A. Cane, S.
E. Zebiak, Rafael Canizares and A. Kaplan, 2000, Geophys. Res. Let., 27,
2585-2587) are shown in Figs. F7 and F8.
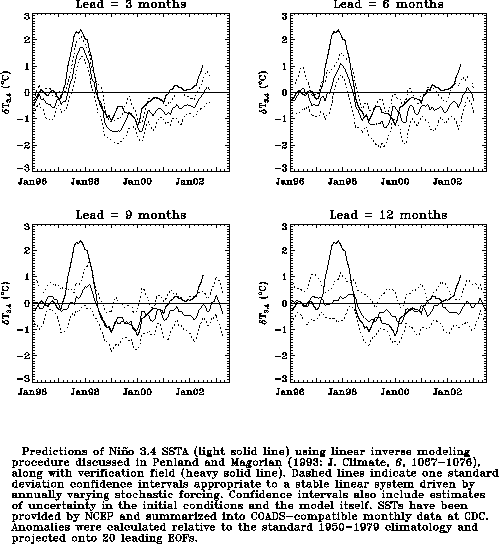
Predictions using linear inverse modeling (Penland and Magorian 1993, J. Climate, 6,
1067-1076) are shown in Figs. F9 and F10.
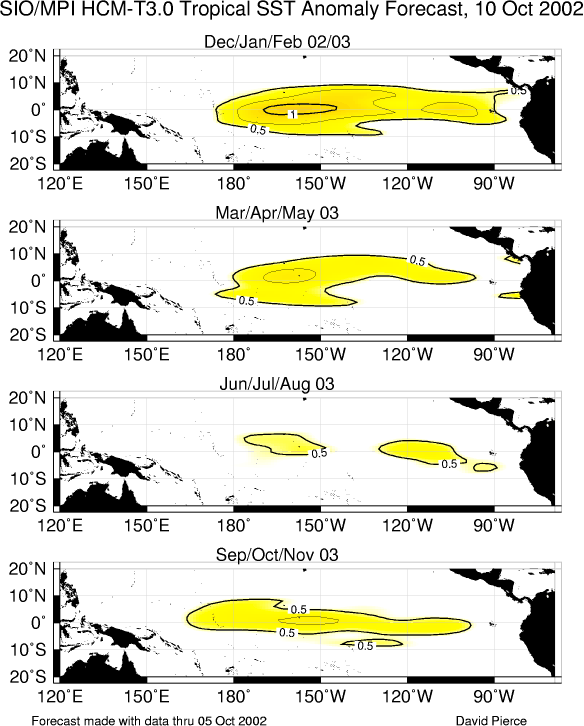
Predictions from the Scripps / Max Planck Institute (MPI) hybrid coupled model (Barnett et
al. 1993, J. Climate, 6, 1545-1566) are shown in Fig. F11. Predictions from the ENSO-CLIPER statistical model
(Knaff, J. A. and C. W. Landsea 1997, Wea. Forecasting, 12, 633-652) are
shown in Fig. F12.
The CPC and the contributors to the Forecast Forum caution potential users of
this predictive information that they can expect only modest skill..
Outlook
Based on the observed oceanic and atmospheric conditions and the
SST predictions, moderate warm episode (El Niño)
conditions are expected to continue into early 2003.
Discussion
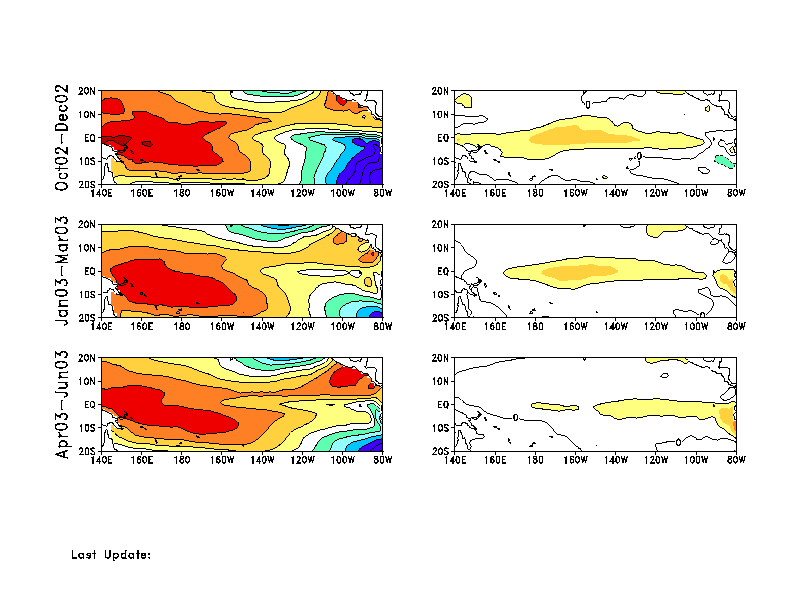
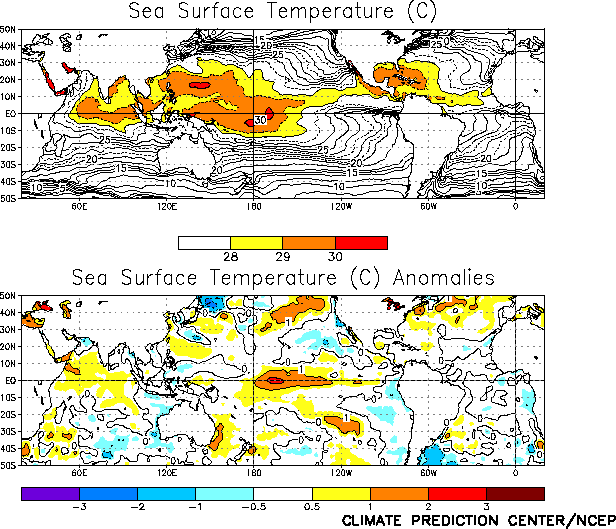
Moderate warm episode (El Niño) conditions dominated the tropical
Pacific during September 2002. SST anomalies (departures from average)
remained greater than +1°C throughout the central equatorial Pacific
between 180°W and 125°W during the month (Fig. T18), and
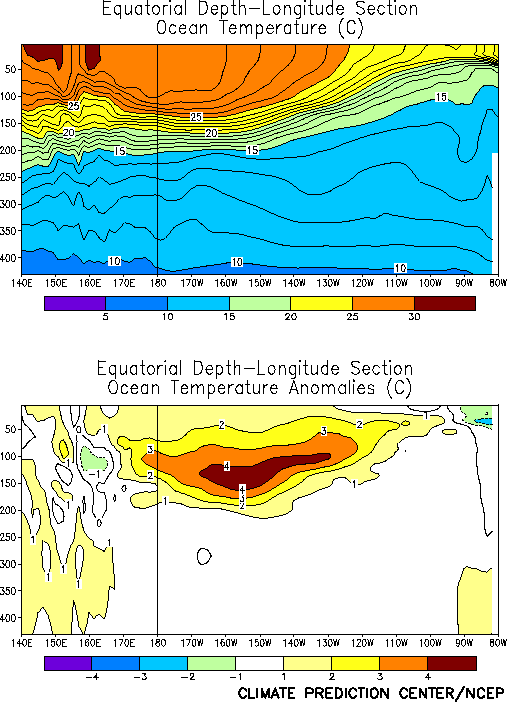
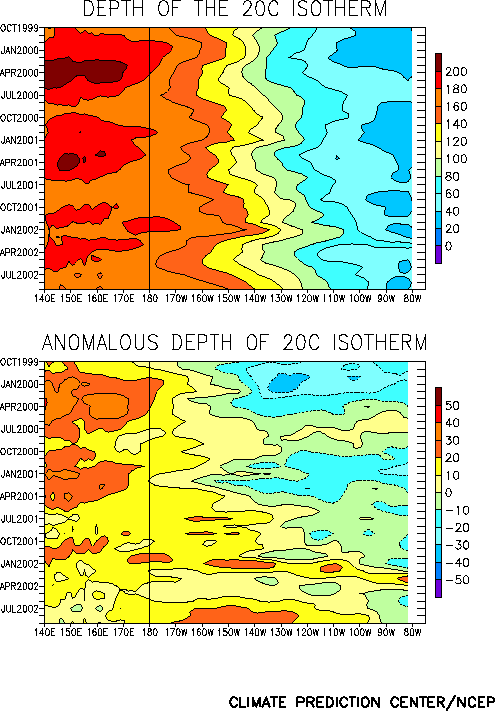
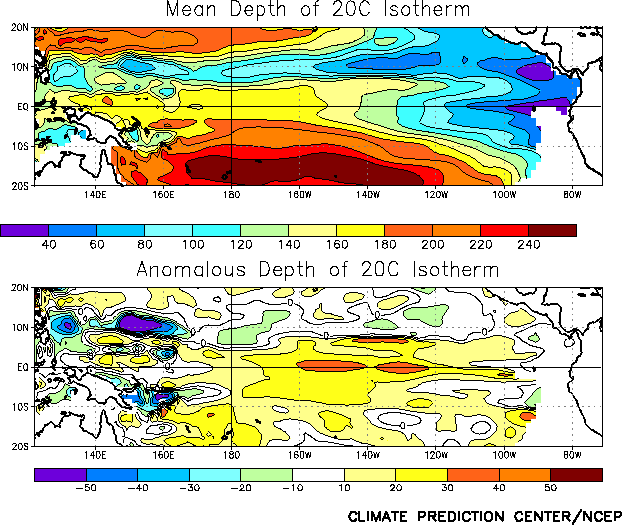
positive subsurface temperature anomalies (Fig. T17) and a
deeper-than-average oceanic thermocline (Figs. T15 and
T16) prevailed throughout most of the equatorial Pacific.
Atmospheric indicators of El Niño include consistently negative
values of the Southern Oscillation Index (SOI) since March 2002 (Table
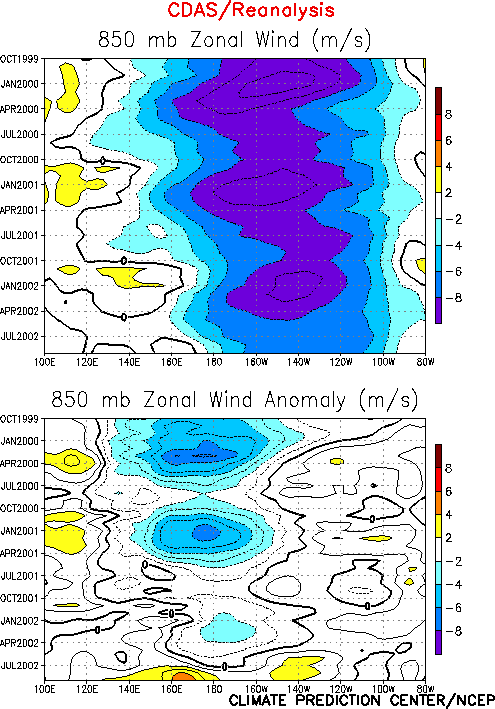
T1), and weaker-than-average low-level easterly winds since May
2002 throughout the equatorial Pacific (Fig. T7). In addition,
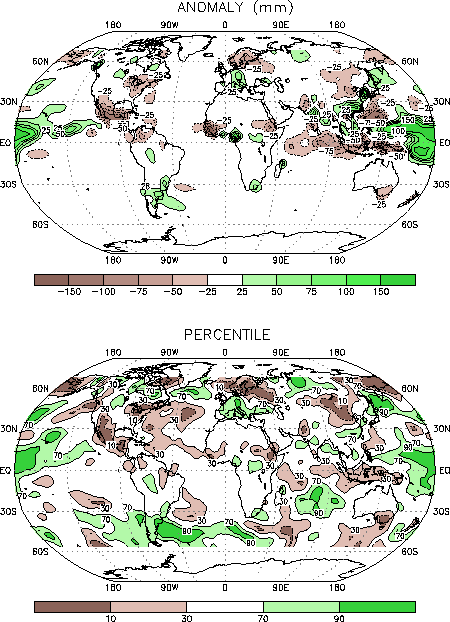
above-average precipitation has been observed over the tropical
Pacific, especially in the vicinity of the date line (180°W), while
drier-than-average conditions prevailed over many sections of
Indonesia, India, Mexico and Central America (Fig. E3). These
oceanic and atmospheric conditions indicate the presence of El Niño.
Most coupled model and statistical model forecasts indicate that El
Niño conditions will continue into early 2003 (Figs. F1,
F2, F3, F4,
F5, F6, F7,
F8, F9, F10,
F11, F12) .
Based on the recent evolution of conditions in the tropical Pacific,
we expect SST anomalies to increase further in the eastern equatorial
Pacific (Niño 3 and Niño 1+2 regions), with the establishment of
basin-wide mature El Niño conditions during December 2002-February
2003. Furthermore, based on the latest predictions and an assessment
of current oceanic and atmospheric conditions, we expect that this
event will be substantially weaker than the 1997-98 El Niño. Thus,
the global impacts should generally be weaker than those observed
during 1997-98. However, strong impacts are still possible in a few
locations.
Expected global impacts include: 1) drier-than-average conditions
over Indonesia and eastern Australia continuing during the next
several months, 2) wetter-than-average conditions over southeastern
South America (Uruguay, northeastern Argentina, and southern Brazil)
during the next three months, 3) drier-than-average conditions over
southeastern Africa during December 2002-February 2003, and 4)
wetter-than-average conditions over coastal sections of Ecuador and
northern Peru during December 2002-April 2003. Over the United States
and Canada we expect: 1) drier-than-average conditions in the Pacific
Northwest and mid-Atlantic states during fall 2002 and in the Ohio
Valley states and northern Rockies during winter 2002-2003, 2)
wetter-than-average conditions along much of the southern tier of the
U.S. during winter 2002-2003, and 3) warmer-than-average conditions in
the northern tier states, southern and southeastern Alaska, and
western and central Canada during late fall 2002 and winter 2002-2003.
Weekly updates of SST, 850-hPa wind, OLR, and the equatorial subsurface temperature
structure are available on the Climate Prediction Center homepage at:
http://www.cpc.ncep.noaa.gov (Weekly Update).


