|
Using JavaScript you can control animations of the last ~1 1/2 days of half hourly IR images
near East Pacific+Continental US+western Atlantic. You will need the browser automatically load images and JavaScript enabled.
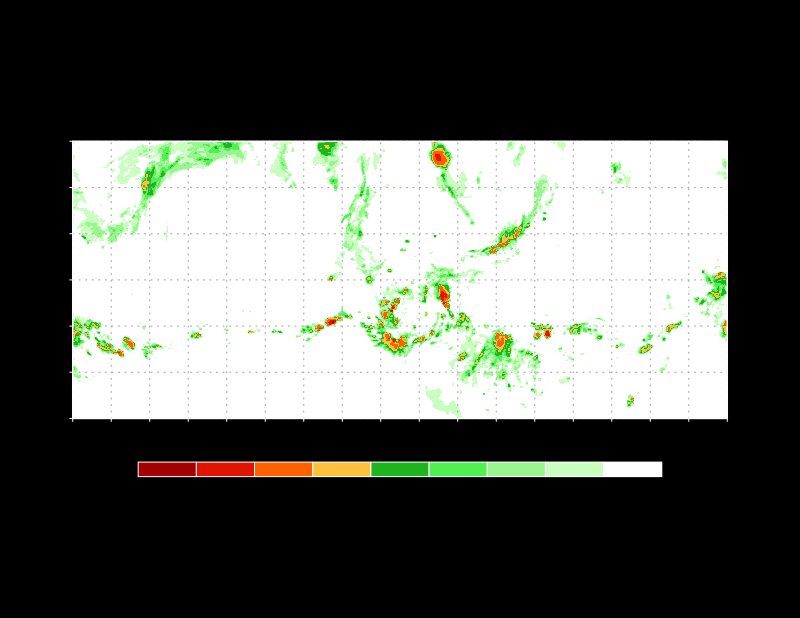
Satellite-derived half-hourly IR temperatures for the
~ 1 1/2 days. Green shading indicates warmer cloud-top temperatures and possible
stratiform precipitation and red shading indicates cold cloud-top temperatures and
possible convective activity. IR temperatures are obtained from a merge of GOES 8,
METEOSAT 7, and METEOSAT 5 satellites, and have latitudinally and seasonally dependent
zenith angle corrections.
|


