The Sahel region (8°-18oN, 17oW-20oE) receives about 90% of its mean annual precipitation during the June-September period. This rainfall is closely related to the north-south movement of the ITCZ, which begins its northward movement in March and reaches its northernmost position (15oN) in August. Precipitation varies widely throughout the region, with the northern regions typically recording 100-300 mm during the season and the southern areas receiving well in excess of 500 mm. For the region as a whole, the 1996 rainy season brought near-normal rainfall to all but the southwestern and extreme southeastern sections of the Sahel, as compared to the 1961-90 base period means.
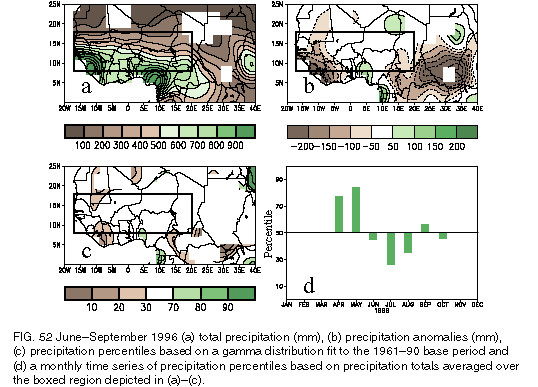
Total rainfall during the 1996 wet season averaged between 200 and 1000 mm across the region (Fig. 52a), with the largest amounts in the southwestern Sahel and western Guinea and the smallest amounts in the North. There were only isolated areas of substantially above-normal (50-150 mm) rainfall during 1996 (Fig. 52b), which included parts of central Mali, Burkina Faso, and Ghana. Elsewhere, much of the northern and central Sahel received near-normal rainfall during the season (Figs. 52b,c), while large portions of the southwestern and southeastern Sahel received below-normal rainfall (Fig. 52b).
In the southwestern Sahel region, the most substantial dryness (50%-80% of normal rainfall) covered western Mali, all of Guinea, Sierra Leona, and Liberia, with totals averaging more than 150-200 mm below normal (Fig. 52b) and precipitation percentiles averaging between the 10th and 20th percentiles (Fig. 52c). In the southeastern Sahel, eastern Chad, southeastern Nigeria, and northwestern Cameroon also experienced significant rainfall deficits during 1996, with negative anomalies exceeding 200 mm in the latter two regions.
The time series of percentiles of area-averaged monthly mean precipitation for the boxed region (17oW-20oE, 8°-18oN) shown in Figs. 52a-c reveals a near-normal onset and finish to the 1995/96 rainy season (Fig. 52d), with the most significant dryness occurring during July and August, when area-averaged precipitation totals dropped below the 30th and 40th percentiles, respectively. In contrast, the wettest month as a whole was September, when area-averaged precipitation totals slightly exceeded the 50th percentile.