Total column ozone data were obtained from the NASA Nimbus-7 SBUV instrument from 1979 through 1988, from the NOAA-11 SBUV/2 instrument from January 1989 through August 1994, and from the NOAA-9 SBUV/2 instrument beginning in September 1994. Data from the SBUV instruments are only available during daylight viewing conditions; therefore no data are available over polar latitudes during winter.
Northern Hemisphere
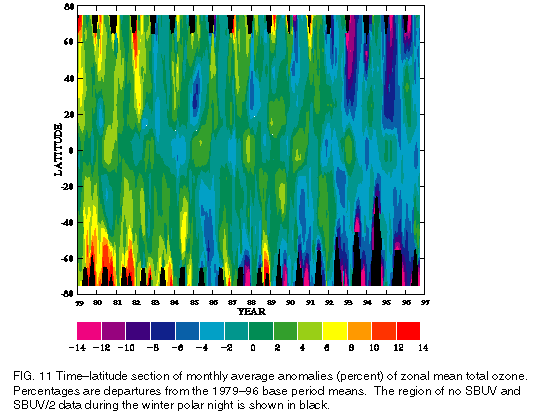
Total column ozone in the Northern Hemisphere is generally lowest during December-March (DJFM). Overall, total ozone in the middle latitudes has decreased at a rate of 2%-4% per decade since 1979 (Stolarski et al. 1992). However, during DJFM 1995/96 total ozone at these latitudes was slightly above normal, in contrast to the large negative anomalies observed last year (Fig. 11 ). In the Arctic, total ozone values during DJFM 1995/96 were more than 12% below the 1979-96 base period means, and more than 24% below values observed in the early 1980s. In the Tropics, a weak negative anomaly seen during late 1996 is part of the well-known quasi-biennial oscillation in ozone. No long-term ozone trend is evident in the Tropics.
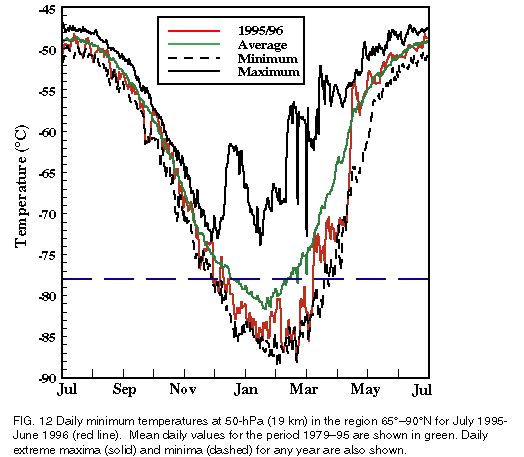
Temperatures in the lower stratosphere are closely coupled to ozone through dynamics and photochemistry, with extremely low temperatures (less than 78°C) believed to lead to ozone depletion. These low temperatures contribute to the formation of polar stratospheric clouds (PSCs), which enhance the production and lifetime of reactive chlorine, leading to ozone depletion (WMO/UNEP 1994). During DJFM 1995/96 daily minimum temperatures at 50 hPa over the Northern Hemisphere polar region (65°-90°N) were below the long-term mean for the entire period (Fig. 12), with record low temperatures observed in February and March. These values were sufficiently low to favor PSC formation and enhanced ozone depletion during the period.
Southern Hemisphere
Total column ozone also exhibits a well-defined
annual cycle in the Southern Hemisphere, with
lowest values typically observed over Antarctica during SON.
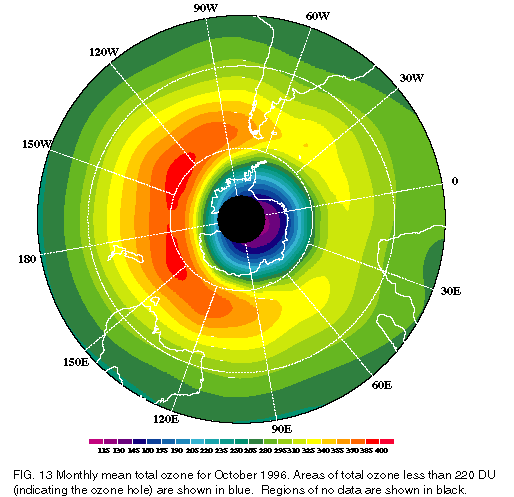
During 1996 total ozone values approached 100 Dobson units (DUs) over the polar region during late
September-early October (Fig. 13
). This value is only
slightly higher than the record low values
observed in 1993 and is more than 12% below the 1979-96
base period mean (Fig. 11).
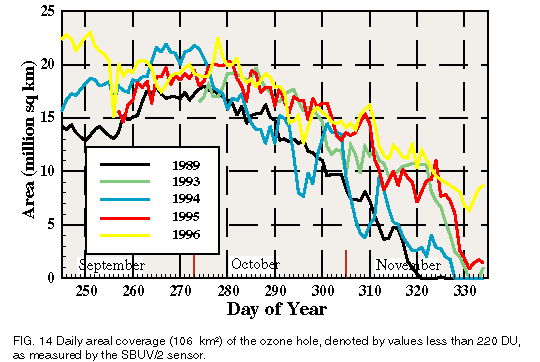
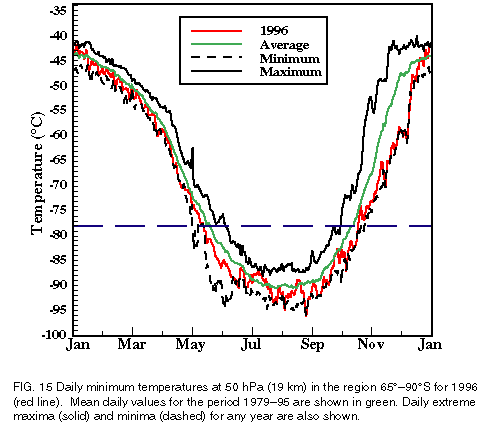
The "ozone hole," denoted by total ozone concentrations less than 220 DU, is most pronounced over the polar region and typically reaches maximum areal extent during late September-early October. Additionally, the ozone hole typically disappears by the beginning of December. During September and October 1996, the area of the ozone hole was similar to the recent record-setting year of 1995 (Fig. 14). However, during November, the areal extent exceeded any previous November on record. The large areal coverage (exceeding 5 x10⁶km2) persisted into early December, in association with a continuation of anomalously cold stratospheric temperatures (Fig. 15). In fact, these daily minimum temperatures in the lower stratosphere averaged lower than average across the polar region during most of September-November 1996 and often approached record low values.
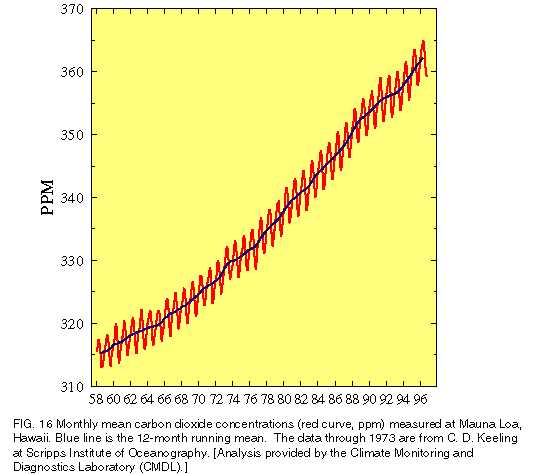
The atmospheric carbon dioxide (CO2) measurements made at Mauna Loa Observatory, Hawaii, since 1958 provide strong evidence for human alteration of the environment (Fig. 16 ). The data through 1973 are from Keeling et al. (1982), while data since 1973 are from the National Oceanic and Atmospheric Administration (NOAA) program (Thoning et al. 1989).
Mauna Loa Observatory, located at an elevation of 3350 m on the flank of Mauna Loa volcano, is an ideal site for carbon dioxide measurements. There is no nearby vegetation, and the prevailing nighttime downslope winds give a representative sampling of midtropospheric air from the central North Pacific Ocean. Thus, this record is taken as a reliable index of long-term carbon dioxide growth.
The average CO2 concentration increase at Mauna Loa during the 1980s and 1990s has been about 1.4 ppm yr-1 but with significant year-to-year variability in this growth rate. The growth rate decreased to near 0.5 ppm yr-1 during 199293, increased to more than 2 ppm yr-1 during 1995, but then dropped in 1996 to near the average of the last decade in 1996. Contributing factors to these variations in growth rate include ENSO and the natural exchange of carbon dioxide between the oceans, the terrestrial biosphere, and the atmosphere.
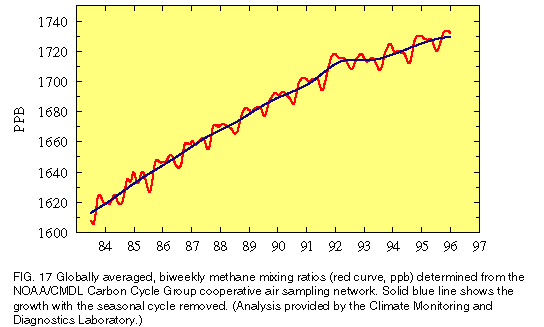
Globally averaged methane mixing ratios are collected approximately weekly from various sites in the NOAA/CMDL cooperative air sampling network (Dlugokencky et al. 1994). Air sampling sites are distributed between 90°S and 82°N and provide air samples representative of the well-mixed boundary layer. The average growth rate during the measurement period is 9.6 parts per billion (ppb) yr-1; the growth rate is largest near the beginning of the record and has been decreasing at 0.8 (ppb yr-1) per year (Dlugokencky et al. 1994). Significant interannual variations in the methane growth rate are also evident (Fig. 17). For example, a significant increase in methane growth was observed in the Tropics and the high latitudes of the Southern Hemisphere during 1991-92 following the eruption of Mt. Pinatubo. The SO2 emitted into the stratosphere during the eruption resulted in a decrease in the UV flux in the wavelength region 290-330 nm (Dlugokencky et al. 1994). It has been suggested (Dlugokencky et al. 1994) that this decrease in the UV flux decreased the steady-state [OH], thus leading to the observed increase in the methane growth rate.
Increased methane affects the earth's radiation balance and the chemistry of the atmosphere. While the major sources of methane have been identified, their absolute contributions to the global methane budget remain poorly quantified. The exact causes of the observed increase will remain uncertain until a better understanding of the methane budget is realized.