1) Ozone
Total column ozone data were obtained from the NASA Nimbus-7 SBUV instrument from 1979 through 1988, from the NOAA-11 SBUV/2 instrument from January 1989 through August 1994, the NOAA-9 SBUV/2 instrument from September 1994 through June 1997, and from the NOAA-14 SBUV/2 beginning July 1997. Data from the SBUV instruments are only available during daylight viewing conditions; therefore no data are available over polar latitudes during winter. Other sources of ozone data include Dobson spectrophotometer readings and measurements from balloon-borne ozonesondes, both obtained from the NOAA Climate Monitoring and Diagnostics Laboratory (CMDL).
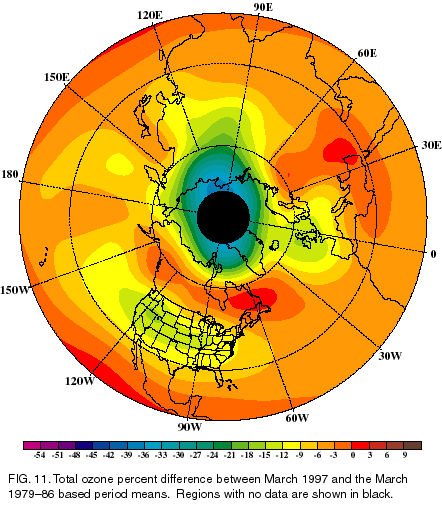
Total column ozone in the Northern Hemisphere is generally lowest during DecemberMarch (DJFM). During the Northern Hemisphere winter of 1996/97, total column ozone over most of the hemisphere was substantially lower than the 197986 means. The drop in ozone was particularly prominent during March 1997 at high latitudes, when total ozone was 30%- 40% below mean 197986 levels (Fig. 11). Over the United States and northwest Europe ozone values during March 1997 averaged 10%20% lower than the 1979-86 means.
At high latitudes, the large departures in total ozone during DJFM 1996/97 were partly related to extremely low temperatures during FebruaryMarch, in association with a highly amplified polar vortex and polar night jet [see section 2b(2) ]. Temperatures in the lower stratosphere are closely coupled to ozone through dynamics and photochemistry, with temperatures less than 78°C believed to lead to ozone depletion. These low temperatures contribute to the formation of polar stratospheric clouds (PSCs), which enhance the production and lifetime of reactive chlorine, leading to ozone depletion (WMO/UNEP 1994).
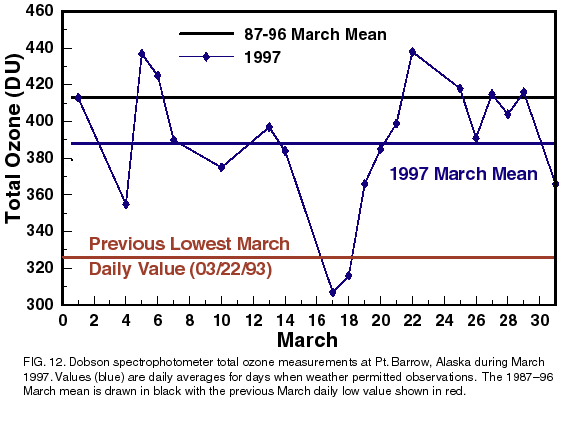
During March, ozone values at Point Barrow, Alaska (71.3°N), the closest U. S. territory to the polar low-ozone region, averaged 388 Dobson Units (DU) (Fig. 12). This value is approximately 6% below the previous ten year average of 413 DU. During the month record low daily total ozone totals were observed on 1718 March, with values dropping below 320 DU each day. These values surpass the previously record low value of 326 DU observed on 22 March 1993, and contrast with a normal year in which Alaska is spared the very low springtime ozone totals typically found throughout northern Europe and Siberia.
(ii) Southern Hemisphere
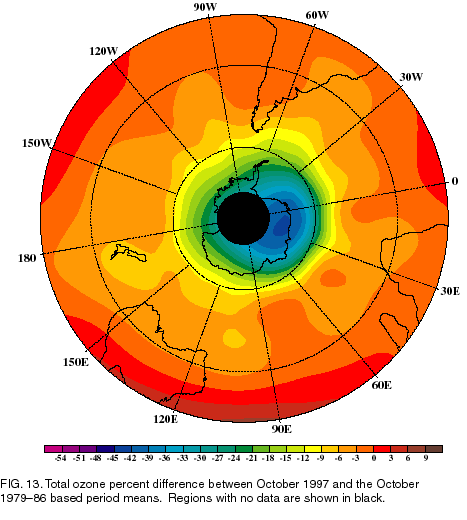
Total column ozone exhibits a well-defined annual cycle in the Southern Hemisphere, with the lowest values typically observed over Antarctica during SeptemberNovember. During October 1997, almost all areas of the hemisphere showed total ozone decreases compared to levels observed during the 197986 period (Fig. 13). The largest decreases occurred over Antarctica and the South Atlantic polar region, where totals averaged 2540% lower than the 1979-86 means.
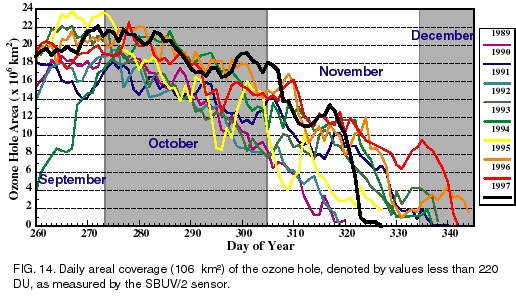
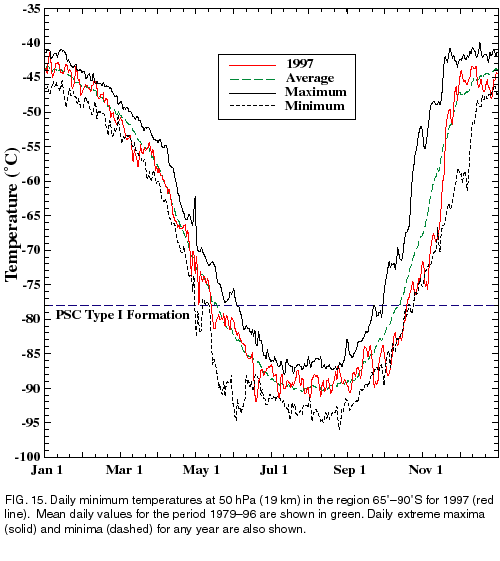
The "ozone hole," denoted by total ozone concentrations less than 220 DU, is most pronounced over the polar region and typically reaches maximum areal extent during late Septemberearly October. During 1997, the ozone hole developed in late August, with total ozone values dropping to near 100 DU by early October. The areal coverage of the ozone hole exceeded 16 x 106 km² during all of September and October, and reached a maximum of nearly 22 x 106 km² in late September and early October (Fig. 14). This extent of the ozone hole was comparable to that observed throughout the mid-1990s, and was substantially larger than that observed in earlier years such as 1989 and 1990. During 1997, the areal extent of the ozone hole began to diminish in early November and disappeared rapidly during mid-November. This evolution coincided with an increase in daily minimum polar temperatures at 50-hPa (approximately 19 km) from the record and near-record low values observed in late September and October (Fig. 15). This rapid return to higher ozone concentrations during November 1997 contrasted with most other recent years, in which the ozone hole persisted into late November and early December.
A further inspection of ozone concentrations during 1997 obtained from a sounding at the South Pole on
8 October 1997 (Fig. 16) reveals total column ozone concentrations of 112 DU. The sounding also shows a
nearly complete destruction of ozone between 14 and 20 km, the largest vertical extent of total depletion observed
in the historical record. These conditions contrast with the "pre-ozone hole" period of 1967-71 when no
ozone depletion was detected between 1520 km, and with conditions 15 years later (October 1986) when only
partial
ozone depletion was observed at these levels.
The record vertical extent of ozone depletion during 1997 likely resulted from the continued increase in stratospheric total reactive halogen, termed "effective equivalent chlorine" (EECl) (Montzka et al. 1996). That study indicates that although EECl has already peaked at the surface, it is not expected to peak in the stratosphere until 199899. Thereafter, the decrease in stratospheric EECl levels is expected to contribute to larger total ozone values over Antarctica, and thus to an overall reduction in the areal extent of the ozone hole during the first decades of the 21st century (Hofmann et al. 1997).