The climate over large parts of South America is strongly influenced by the El Niño/Southern Oscillation. During warm episodes, drier-than-normal conditions are generally observed across northeastern South America during July-March, while enhanced precipitation tends to be observed throughout southeastern South America during November-February (Ropelewski and Halpert 1987), and throughout central Chile during the austral winter (Aceituno 1988). Also, above-average temperatures are typically observed along the west coast of South America from May-April (Halpert and Ropelewski 1992) . During the very strong 1997 warm episode, all of these conditions were prominent aspects of the South American climate.
1) Brazil Winter and Spring Highlights
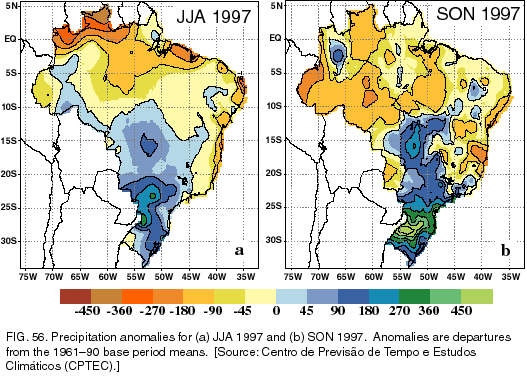
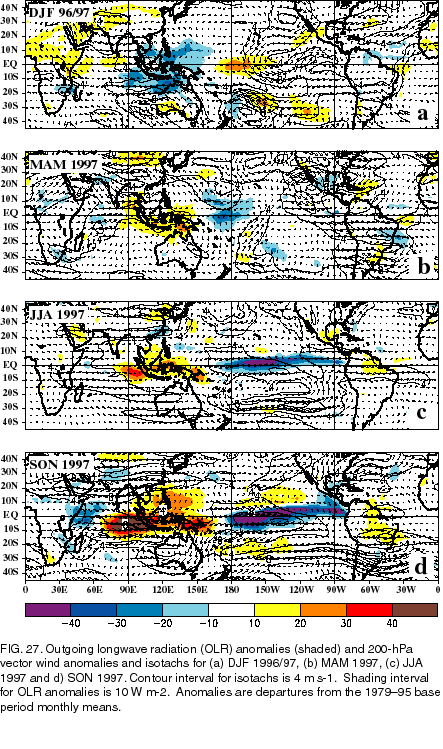
Precipitation was below normal across northern Brazil and parts of the Amazon Basin during June- November (Fig. 56), with accumulated seasonal deficits of 90-180 mm recorded throughout the Amazon during both seasons. Over northern Brazil, deficits of 180-360 mm were recorded during JJA (Fig. 56a), with smaller deficits observed during SON (Fig. 56b ). These conditions caused a reduction in the level of many rivers throughout the region, which impacted the generation of hydroelectric power in the northern states of Brazil. The dryness was linked to anomalous large-scale subsidence, in association with a weakened upper-level anticyclonic circulation (Figs. 27c, d ) and with a reduced low-level inflow of warm, moist air into the region.
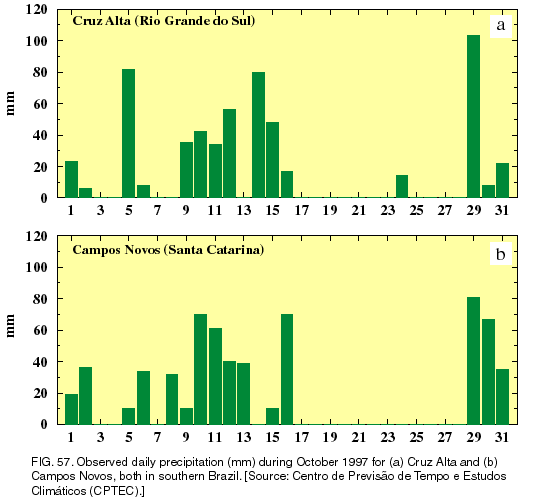
In contrast, southern Brazil experienced well above normal precipitation during both JJA (Fig. 56a) and SON (Fig. 56b). Seasonal surpluses of 90-270 mm covered southern Brazil during JJA with larger anomalies up to 540 mm recorded during SON. During October, much of the heavy rainfall was associated with intense mesoscale convective systems triggered by extratropical frontal systems moving through the region. Time series of daily October precipitation are shown for two cities (Cruz Alta and Campos Novos) in the southern part of Brazil (Fig. 57). For the month as a whole, both cities recorded extremely large totals of over 500 mm, with much of the rain falling during two distinct periods: 916 and 2931 October. In the first period, totals approached 300 mm in both cities, while in the second period totals reached 130 mm at Cruz Alta and 180 mm at Campos Novos. These downpours were linked to larger-scale convective systems that resulted in numerous rivers overflowing their banks and flooding in many cities.
2) Winter Precipitation in central Chile
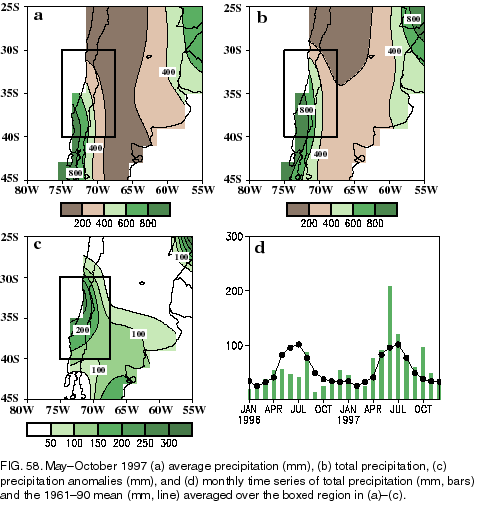
In central Chile (30°-40°S), the rainy season typically lasts from May-October, and reaches maximum strength during June-July. Most of the region normally receives more than 75% of its annual rainfall during this rainy season, with totals in the North typically reaching 200-300 mm and totals in the South exceeding 800 mm (Fig. 58a). During May-October 1997, precipitation totals ranged from 300-400 mm in the North to 900-1000 mm in the South (Fig. 58b), averaging 100-300 mm above normal throughout the region (Fig. 58c). The area-mean precipitation was above-average during every month except August, with 200% of normal recorded across the region during June.
This above-normal precipitation contrasts with the 1996 season, when totals were substantially below average (Fig. 58d). This strong interannual variability of precipitation was linked to the extratropical atmospheric response to opposite extremes of the ENSO. During the 1997 season, the El Niño-related precipitation surpluses were linked to increased storminess from extratropical weather systems, in response to an abnormally strong South Pacific jet stream that was extended well east of normal [see section 3a(4)].
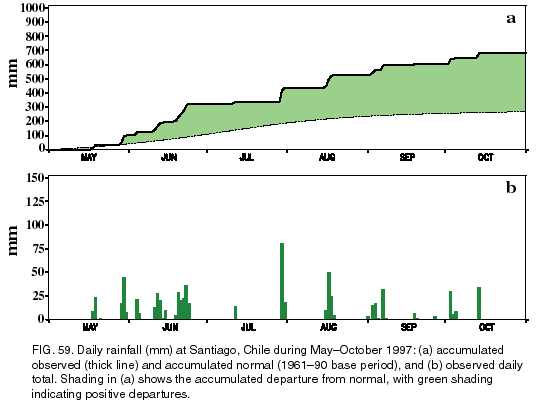
This link during 1997 between the increased precipitation and increased storminess is evident in the time series showing accumulated rainfall and daily rainfall at Santiago, Chile (Fig. 59). Santiago received nearly 700 mm of precipitation during May-October 1997, compared to a climatological mean of 290 mm (Fig. 59a). Nearly half of this total rainfall was observed during late-May and June (Fig. 59b), when five major winter storms affected the region. This excessive precipitation resulted in flooding and led to large agricultural losses. Thereafter precipitation was substantial but more episodic, and again linked directly to major storm systems moving across the region. In fact, precipitation totals during August-October reached 240 mm, which was 300% of normal for the period.
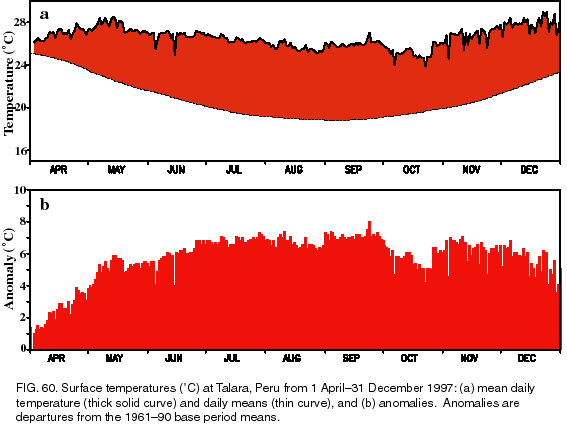
Surface air temperatures in northwestern coastal Peru and western coastal Ecuador exhibit a
well-defined
annual cycle that is controlled by the SSTs over the extreme eastern Pacific. This annual cycle exhibits an
August-October minimum and a March-April maximum. Interannual variations in surface temperature
throughout the region are strongly controlled by the ENSO, with warmer (colder) than normal conditions observed
during Pacific warm (cold) episodes.
During 1997, record or near-record warmth prevailed from May through December over most of the region, with temperatures averaging 3°-6°C above average during the period. At Talara, Peru (Fig. 60a) daily mean temperatures averaged 26°-28°C from April through December 1997, with almost no annual cycle evident. In effect, the region did not experience a cool season during 1997. These conditions are consistent with the greatly-reduced annual cycle in SSTs over the eastern equatorial Pacific (see Fig. 24a) in response to very strong El Niño conditions. During this period, temperatures averaged 6°-7°C above normal on most days (Fig. 60b), which set new monthly-mean temperature records in every month from May through December.