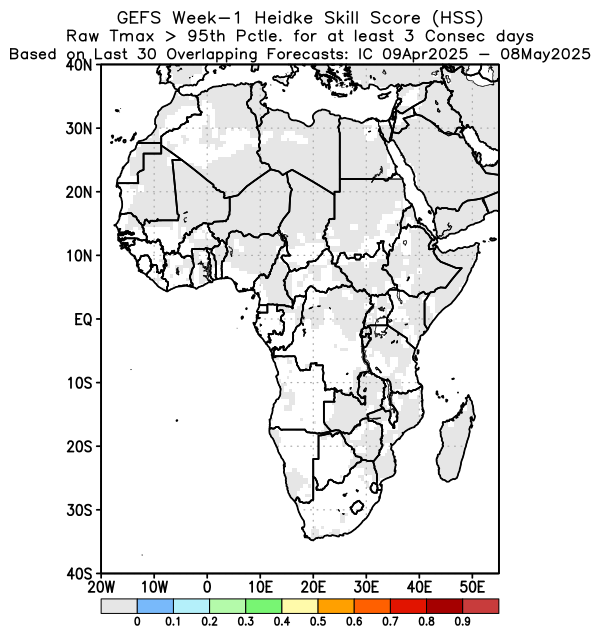
Raw Fcst

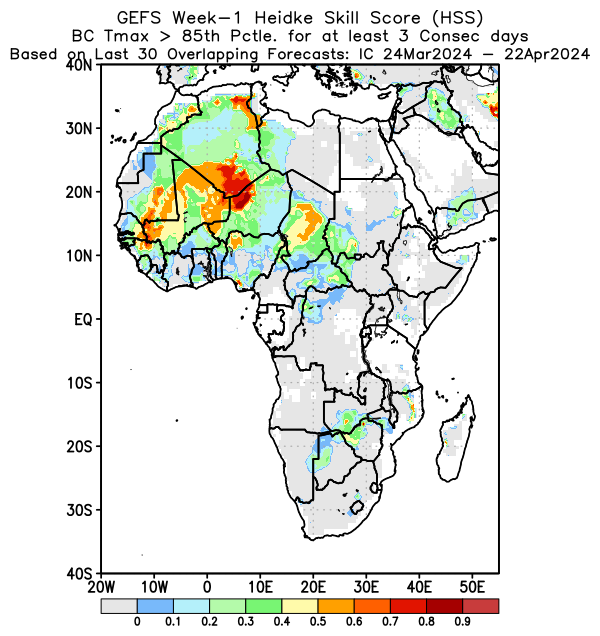
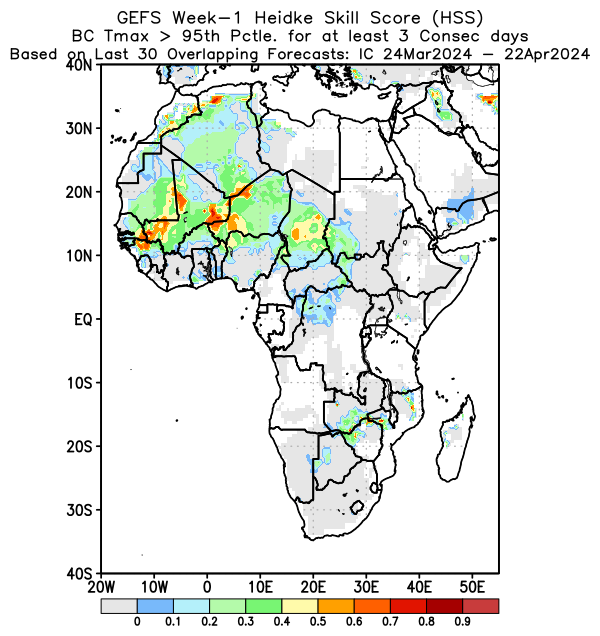
BiasCorr Fcst


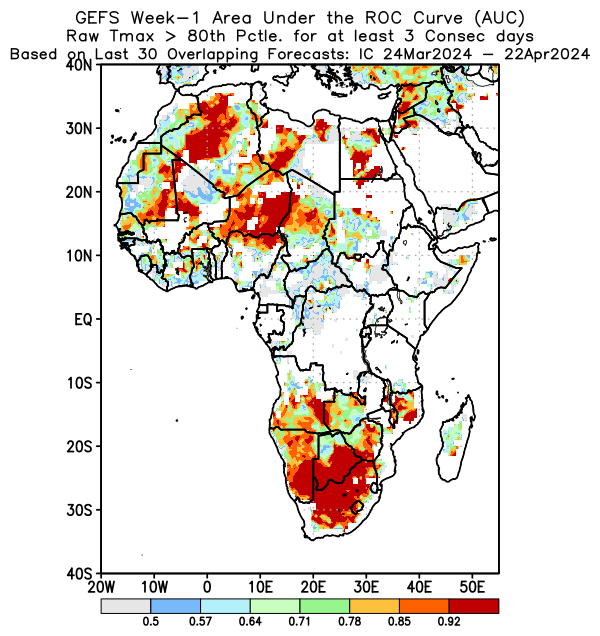
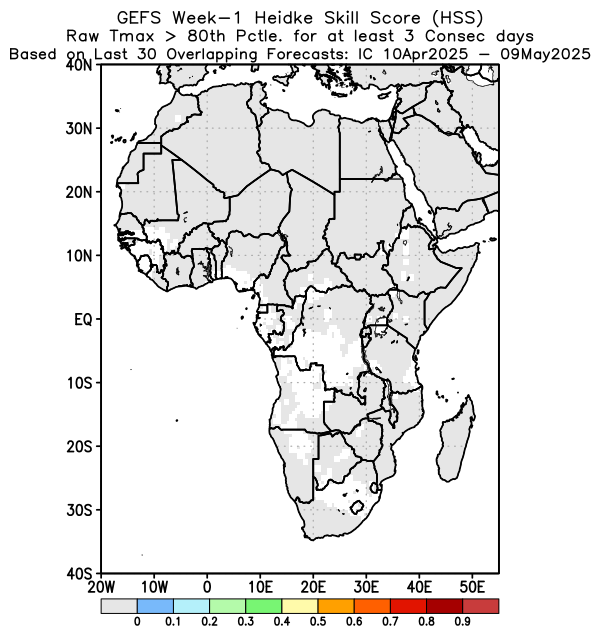
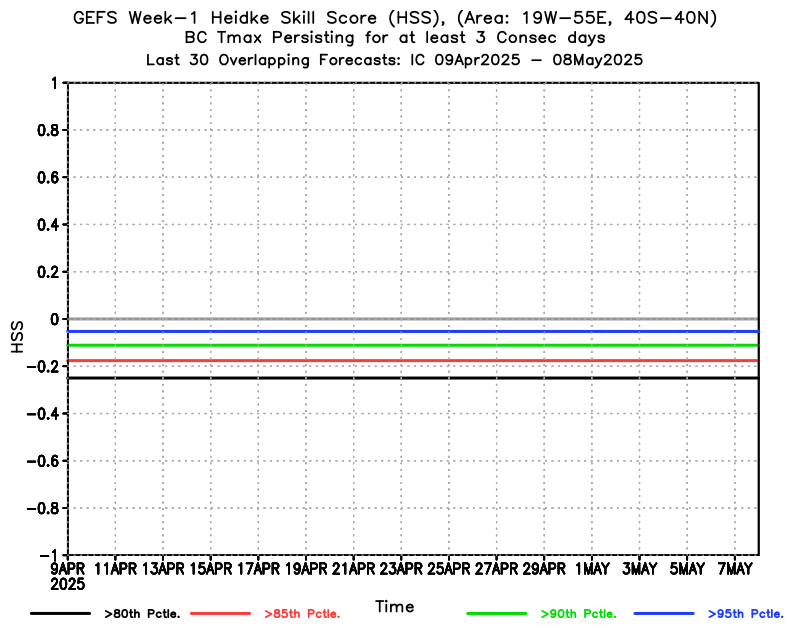
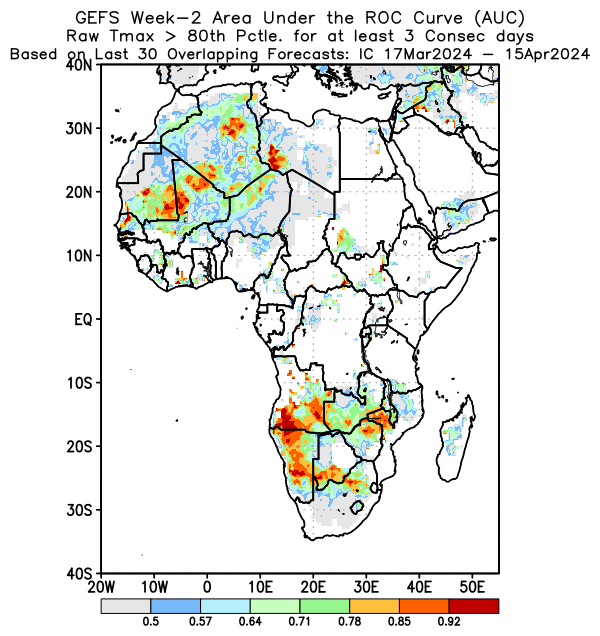
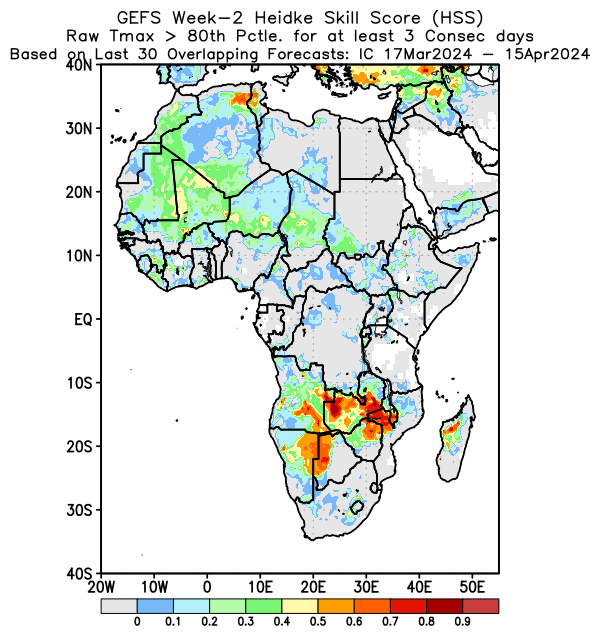
| Tmax > 80th Percentile |
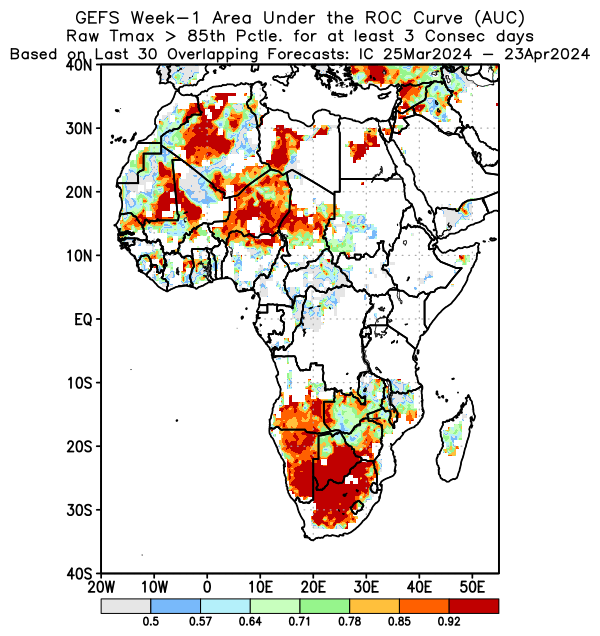
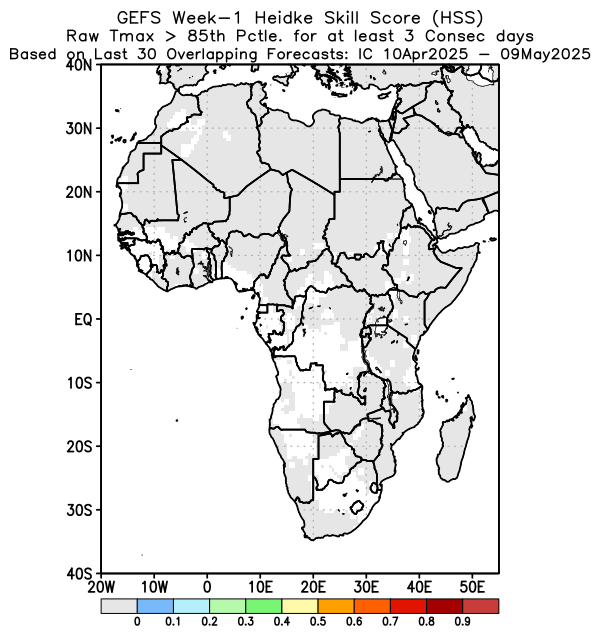
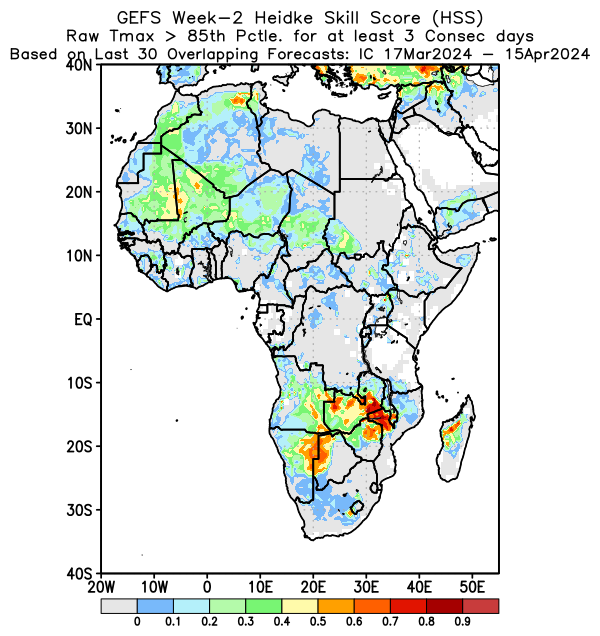
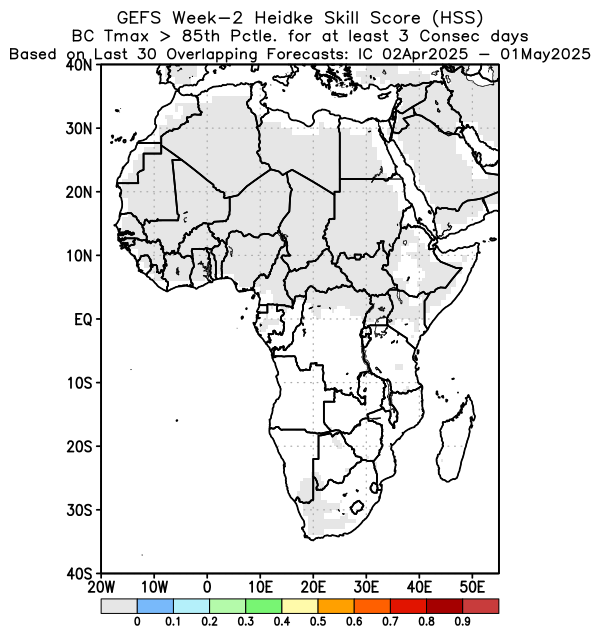
Tmax > 85th Percentile |
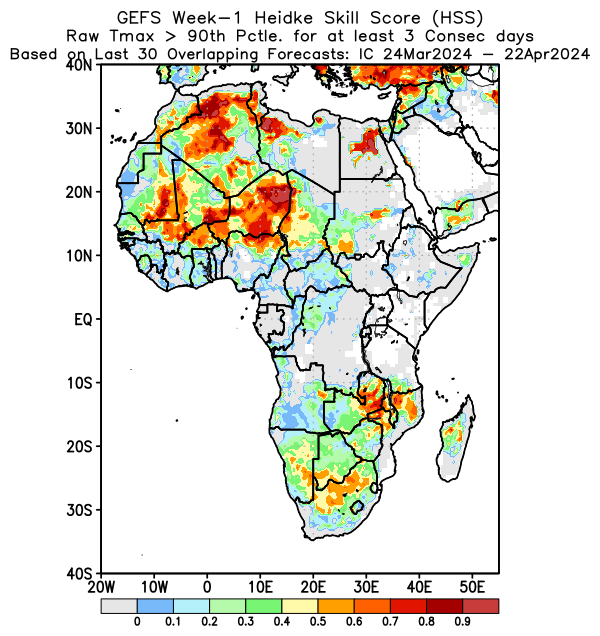
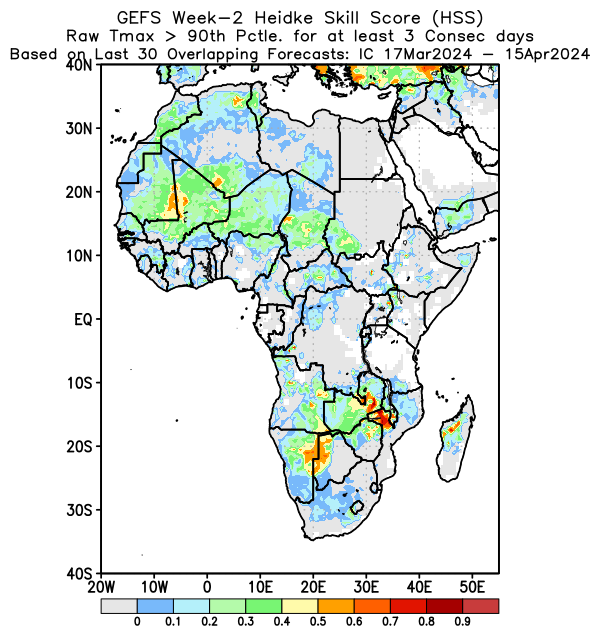
Tmax > 90th Percentile |
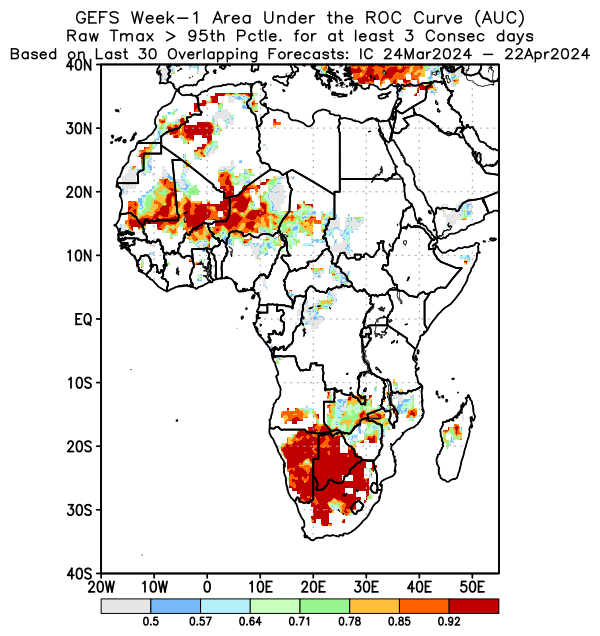
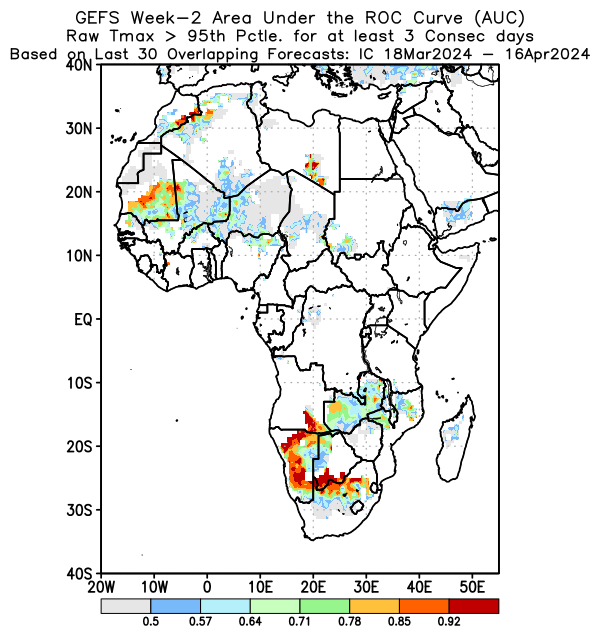
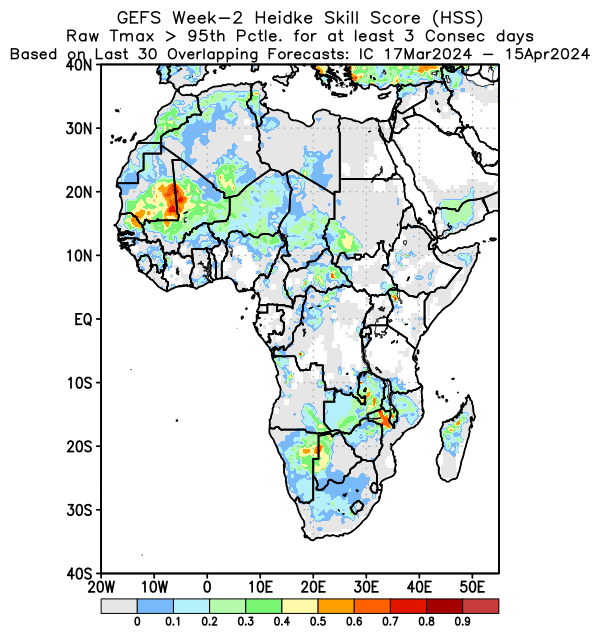
Tmax > 95th Percentile |
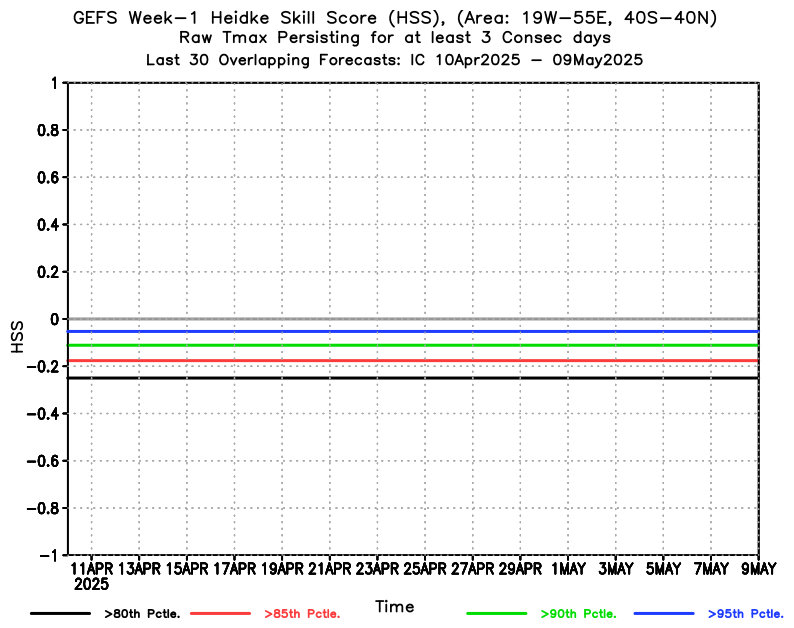
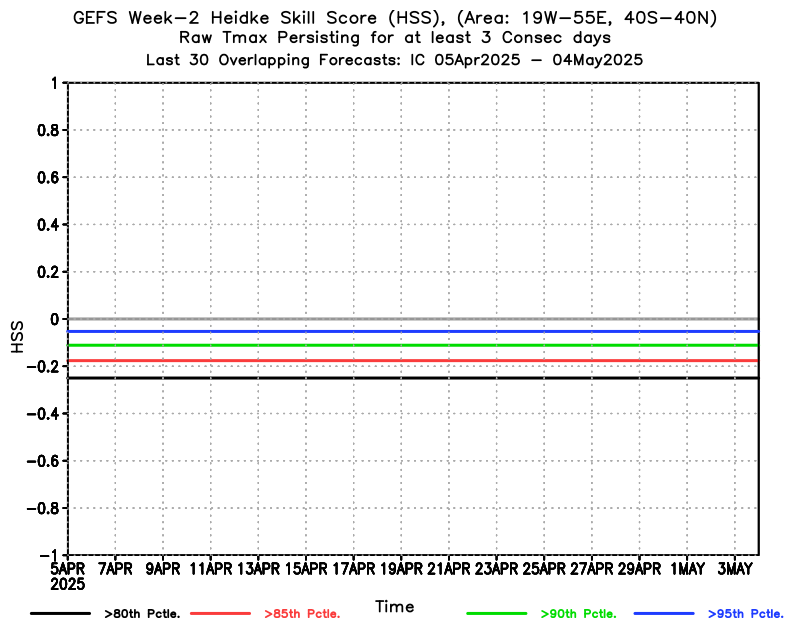
30-day Time Series |
|
Raw Fcst |
|
|
|
|
|
|---|---|---|---|---|---|
BiasCorr Fcst |
|
|
|
|
|
| Tmax > 80th Percentile |
Tmax > 85th Percentile |
Tmax > 90th Percentile |
Tmax > 95th Percentile |
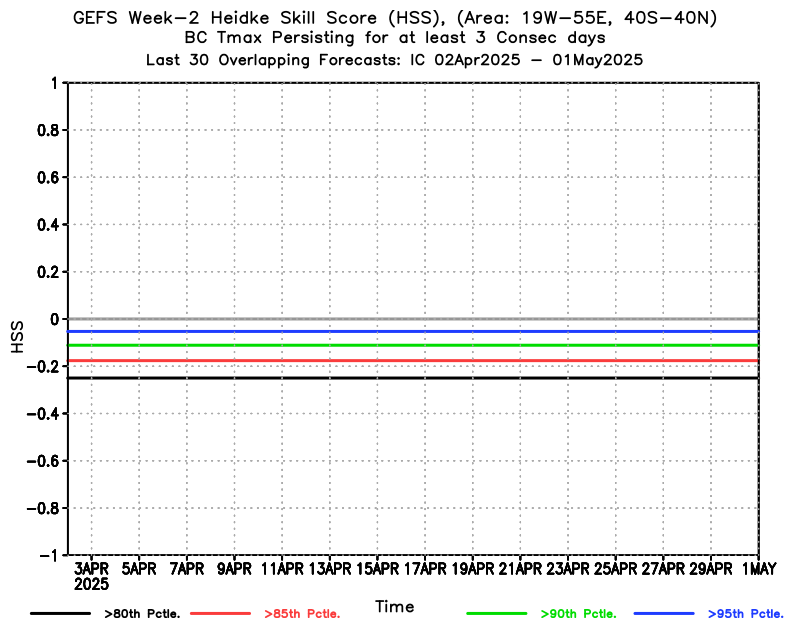
30-day Time Series |
|
Raw Fcst |
 |
 |
 |
 |
 |
|---|---|---|---|---|---|
BiasCorr Fcst |
 |
 |
 |
 |
 |
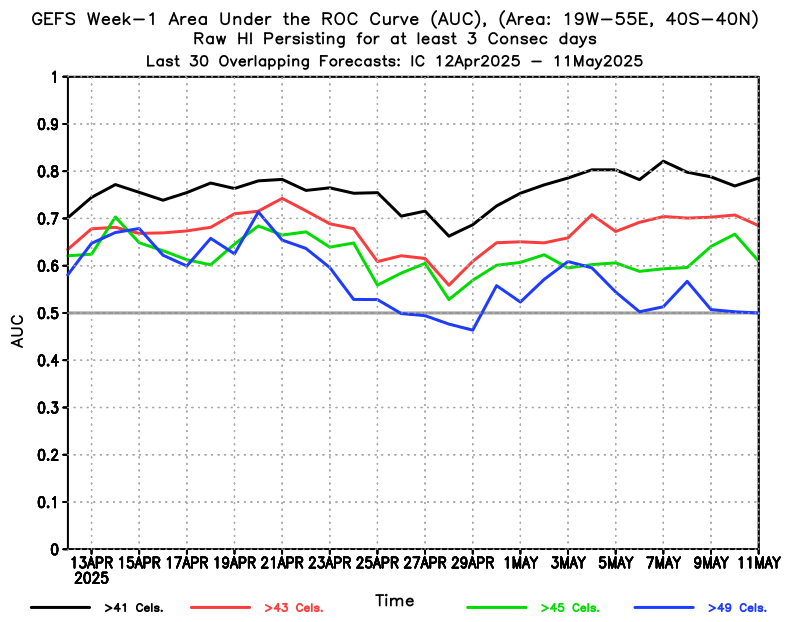
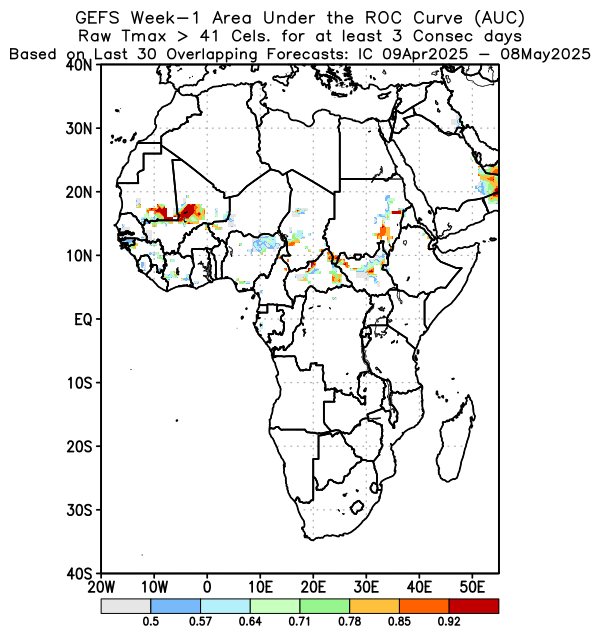
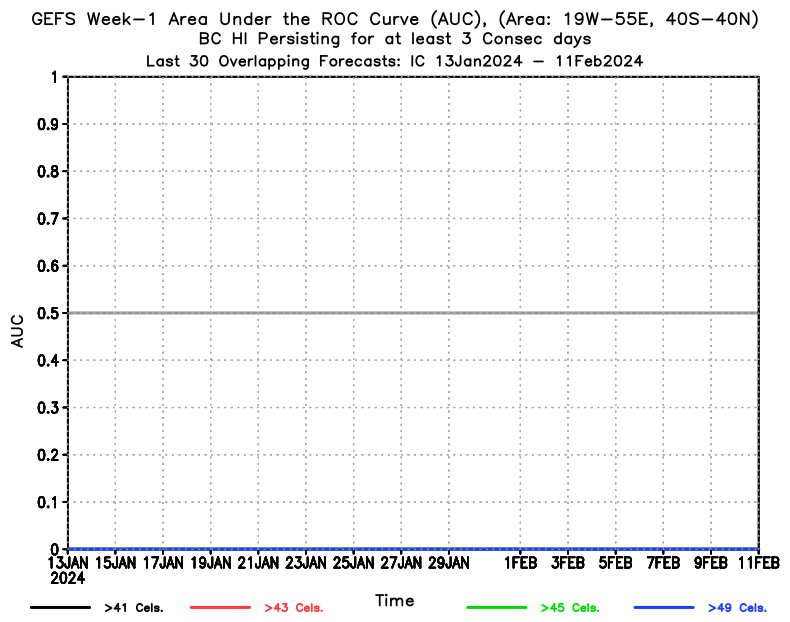
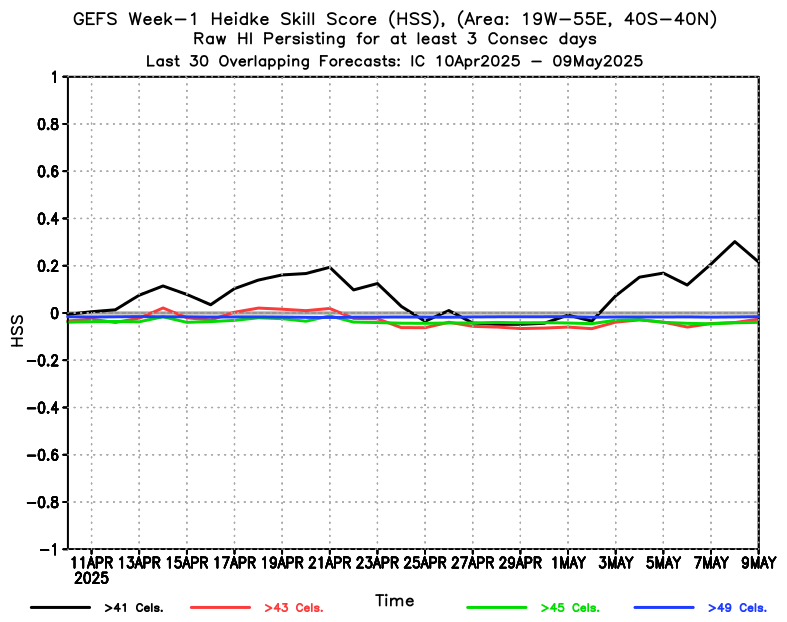
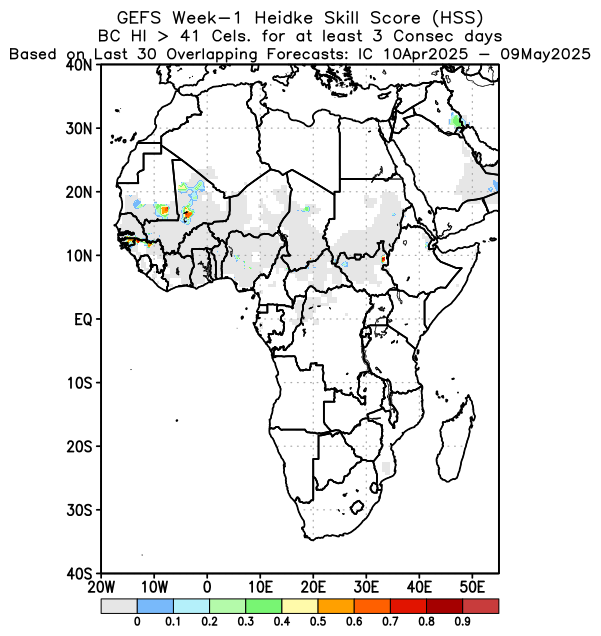
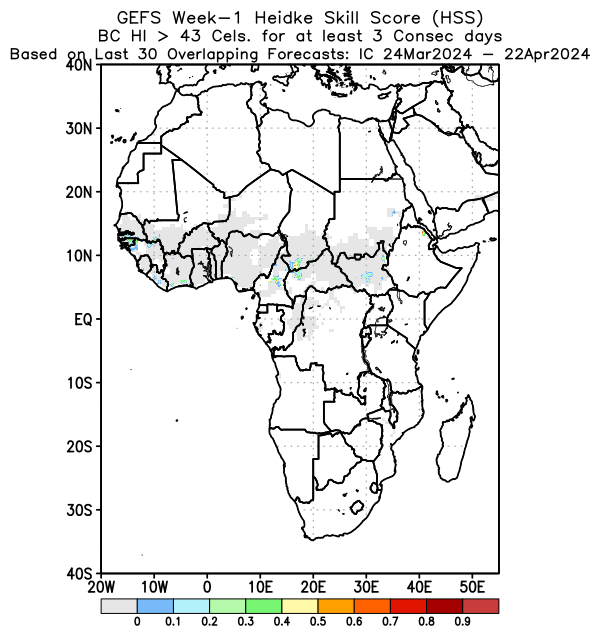
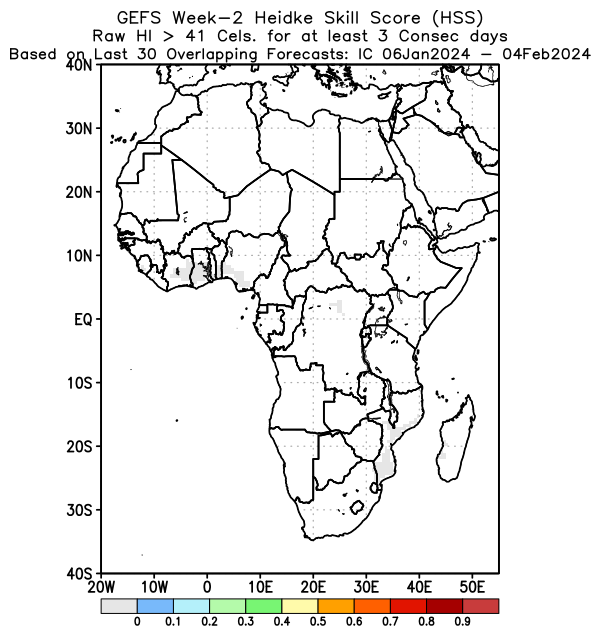
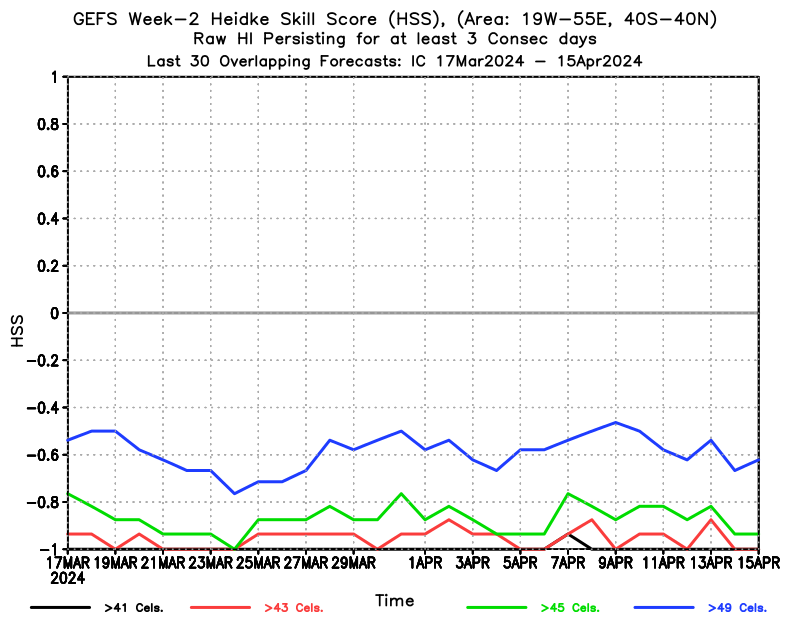
| HI > 41Cels |
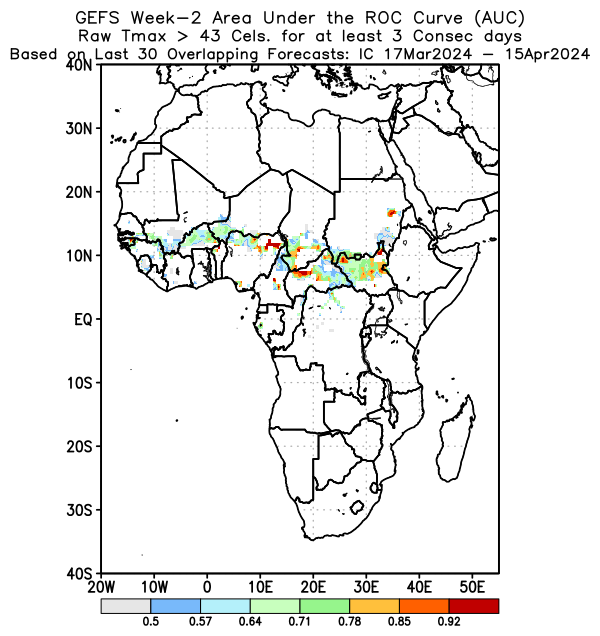
>HI > 43Cels |
>HI > 45Cels |
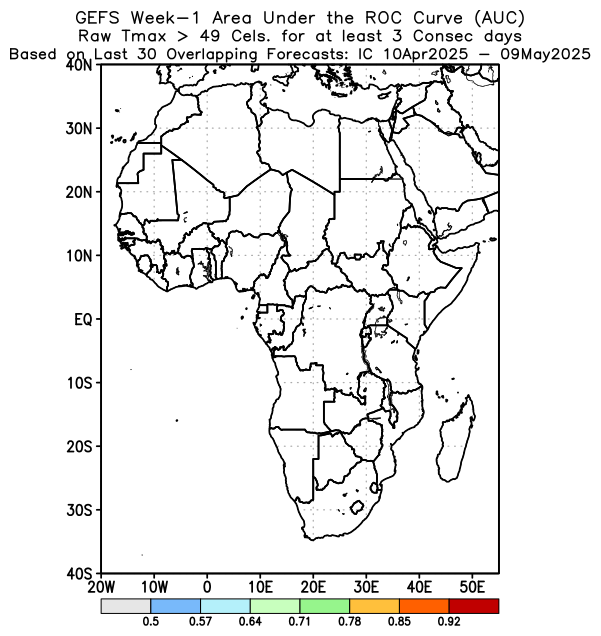
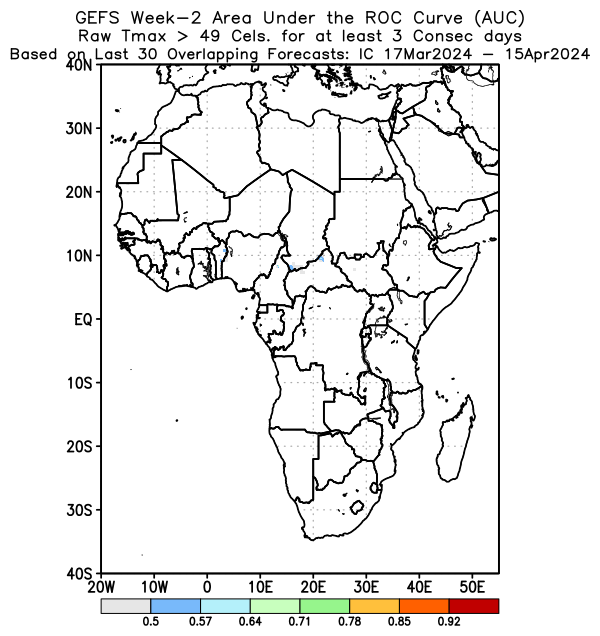
>HI > 49Cels |
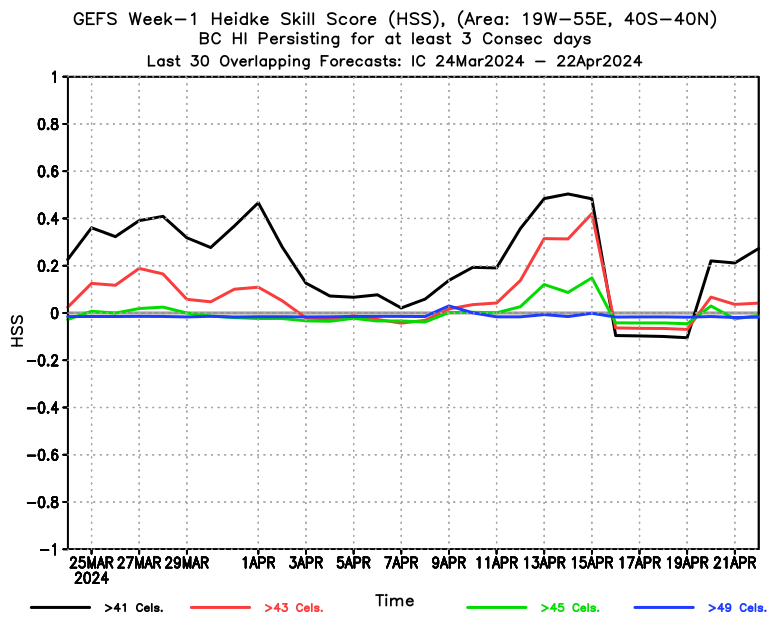
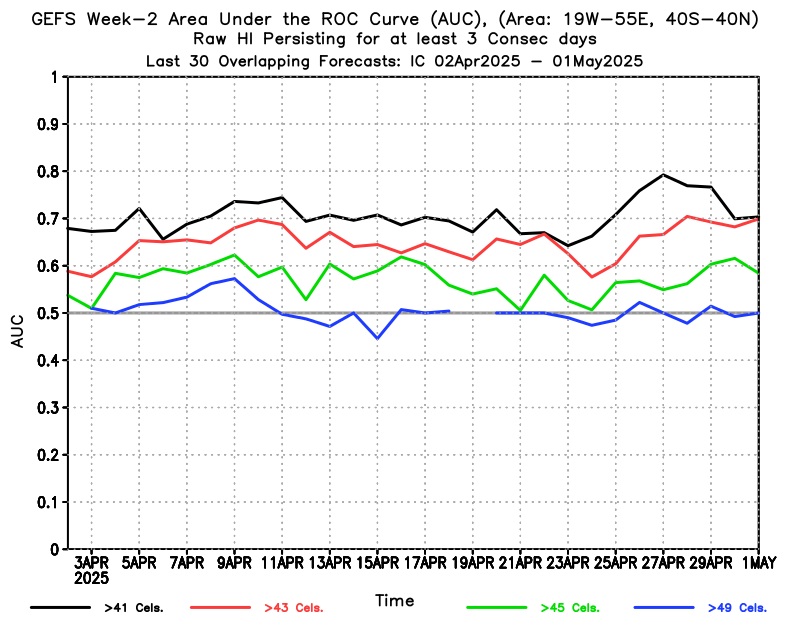
30-day Time Series |
|
Raw Fcst |
 |
 |
 |
 |
 |
|---|---|---|---|---|---|
BiasCorr Fcst |
 |
 |
 |
 |
 |
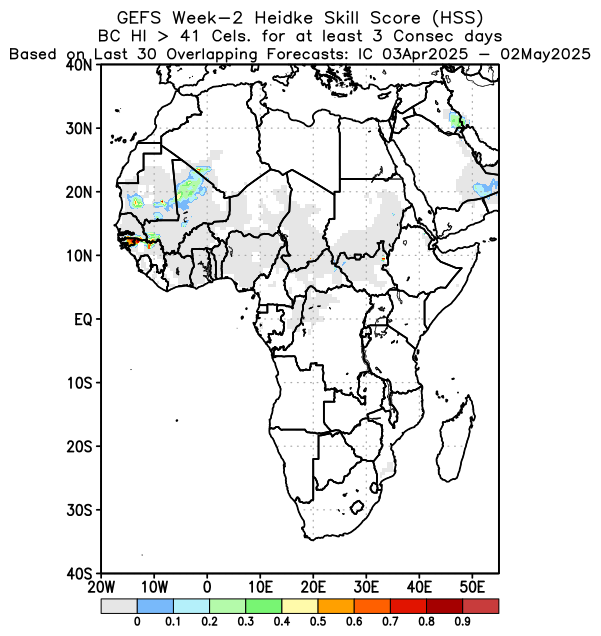
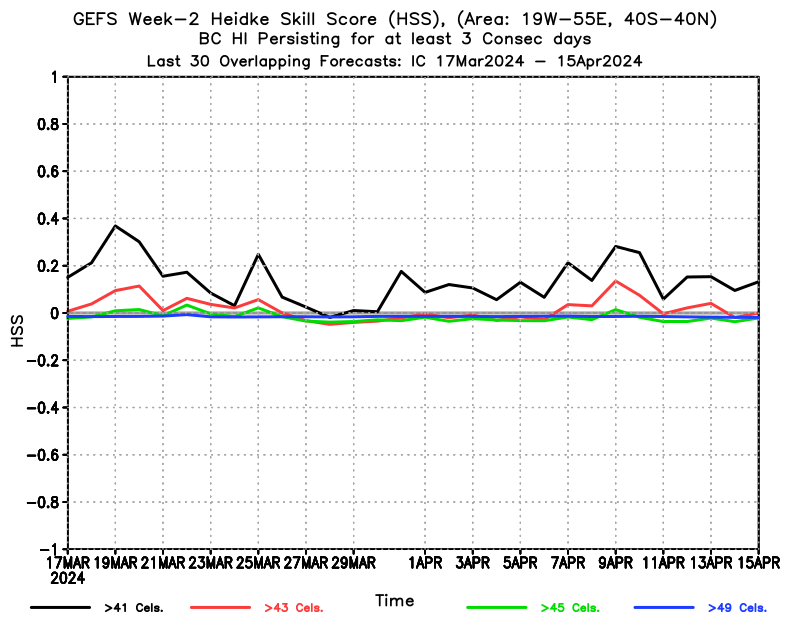
| >HI > 41Cels |
>HI > 44Cels |
>HI > 45Cels |
>HI > 49Cels |
30-day Time Series |
|
Raw Fcst |
 |
 |
 |
 |
 |
|---|---|---|---|---|---|
BiasCorr Fcst |
 |
 |
 |
 |
 |
| Tmax > 80th Percentile |
Tmax > 85th Percentile |
Tmax > 90th Percentile |
Tmax > 95th Percentile |
30-day Time Series |
|
Raw Fcst |
 |
 |
 |
 |
 |
|---|---|---|---|---|---|
BiasCorr Fcst |
 |
 |
 |
 |
 |
| Tmax > 80th Percentile |
Tmax > 85th Percentile |
Tmax > 90th Percentile |
Tmax > 95th Percentile |
30-day Time Series |
|
Raw Fcst |
 |
 |
 |
 |
 |
|---|---|---|---|---|---|
BiasCorr Fcst |
 |
 |
 |
 |
 |
| HI > 41Cels |
>HI > 43Cels |
>HI > 45Cels |
>HI > 49Cels |
30-day Time Series |
|
Raw Fcst |
 |
 |
 |
 |
 |
|---|---|---|---|---|---|
BiasCorr Fcst |
 |
 |
 |
 |
 |
| >HI > 41Cels |
>HI > 44Cels |
>HI > 45Cels |
>HI > 49Cels |
30-day Time Series |
|
Raw Fcst |
 |
 |
 |
 |
 |
|---|---|---|---|---|---|
BiasCorr Fcst |
 |
 |
 |
 |
 |