|
| |
|
HOME > Monitoring and Data > Oceanic & Atmospheric Data > Monitoring Intraseasonal Oscillations > 200-hPa Velocity Potential Anomalies & Hurricanes/Typhoons
|
| |
 |
| |
200-hPa Velocity Potential Anomalies &
Hurricanes/Typhoons
|
|
|
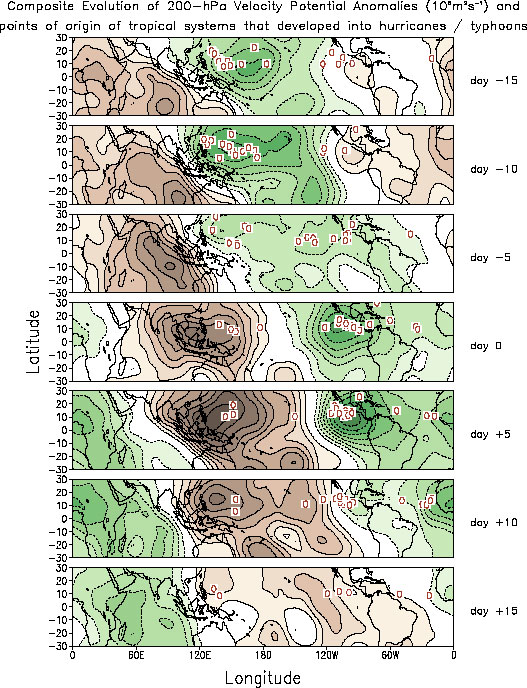
Figure 2. Composite evolution of MJO
events during the summer months together with points of origin of tropical cyclones that
developed into hurricanes / typhoons (open circles). The green (brown) shading roughly
corresponds to regions where convection is favored (suppressed) as represented by 200-hPa
velocity potential anomalies. Composites are based on 21 events over a 35 day period.
Hurricane track data is for the period JAS 1979-1997. Points of origin in each panel are
for different storms. Contour interval is 0.5x10⁶ m2 s-1,
negative contours are dashed, and the zero contour is omitted for clarity.
|
|
|
|


