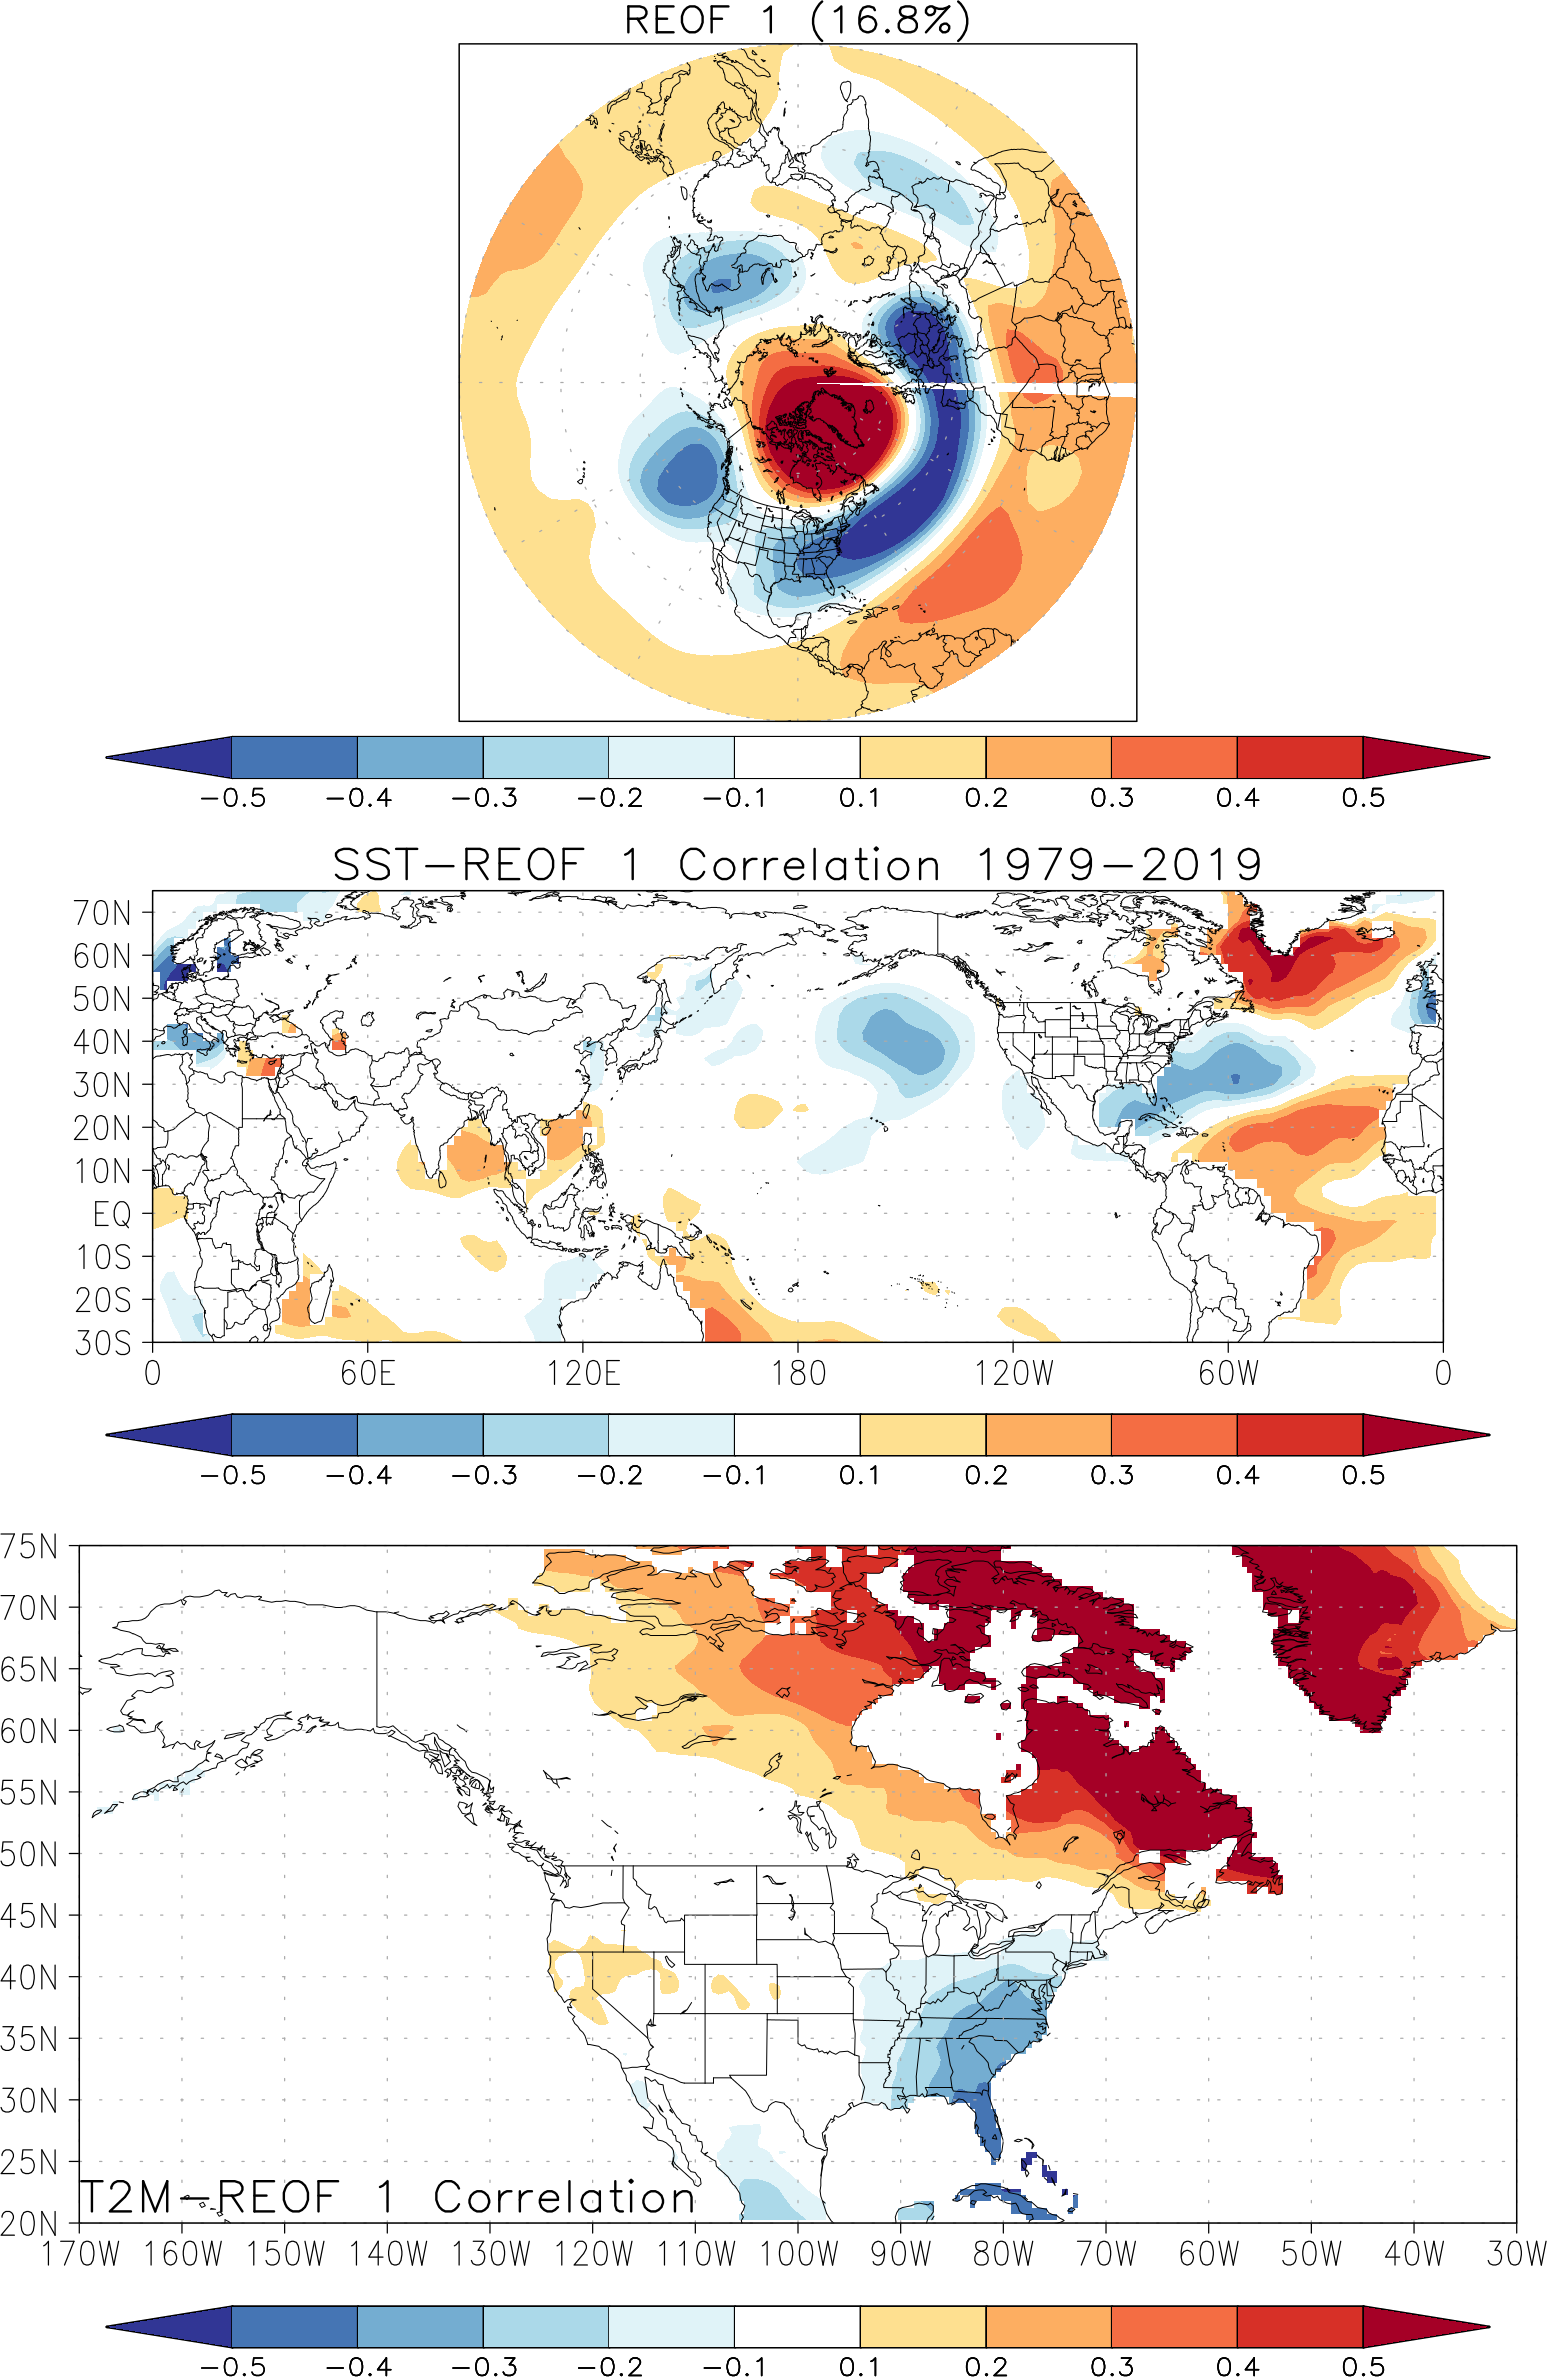
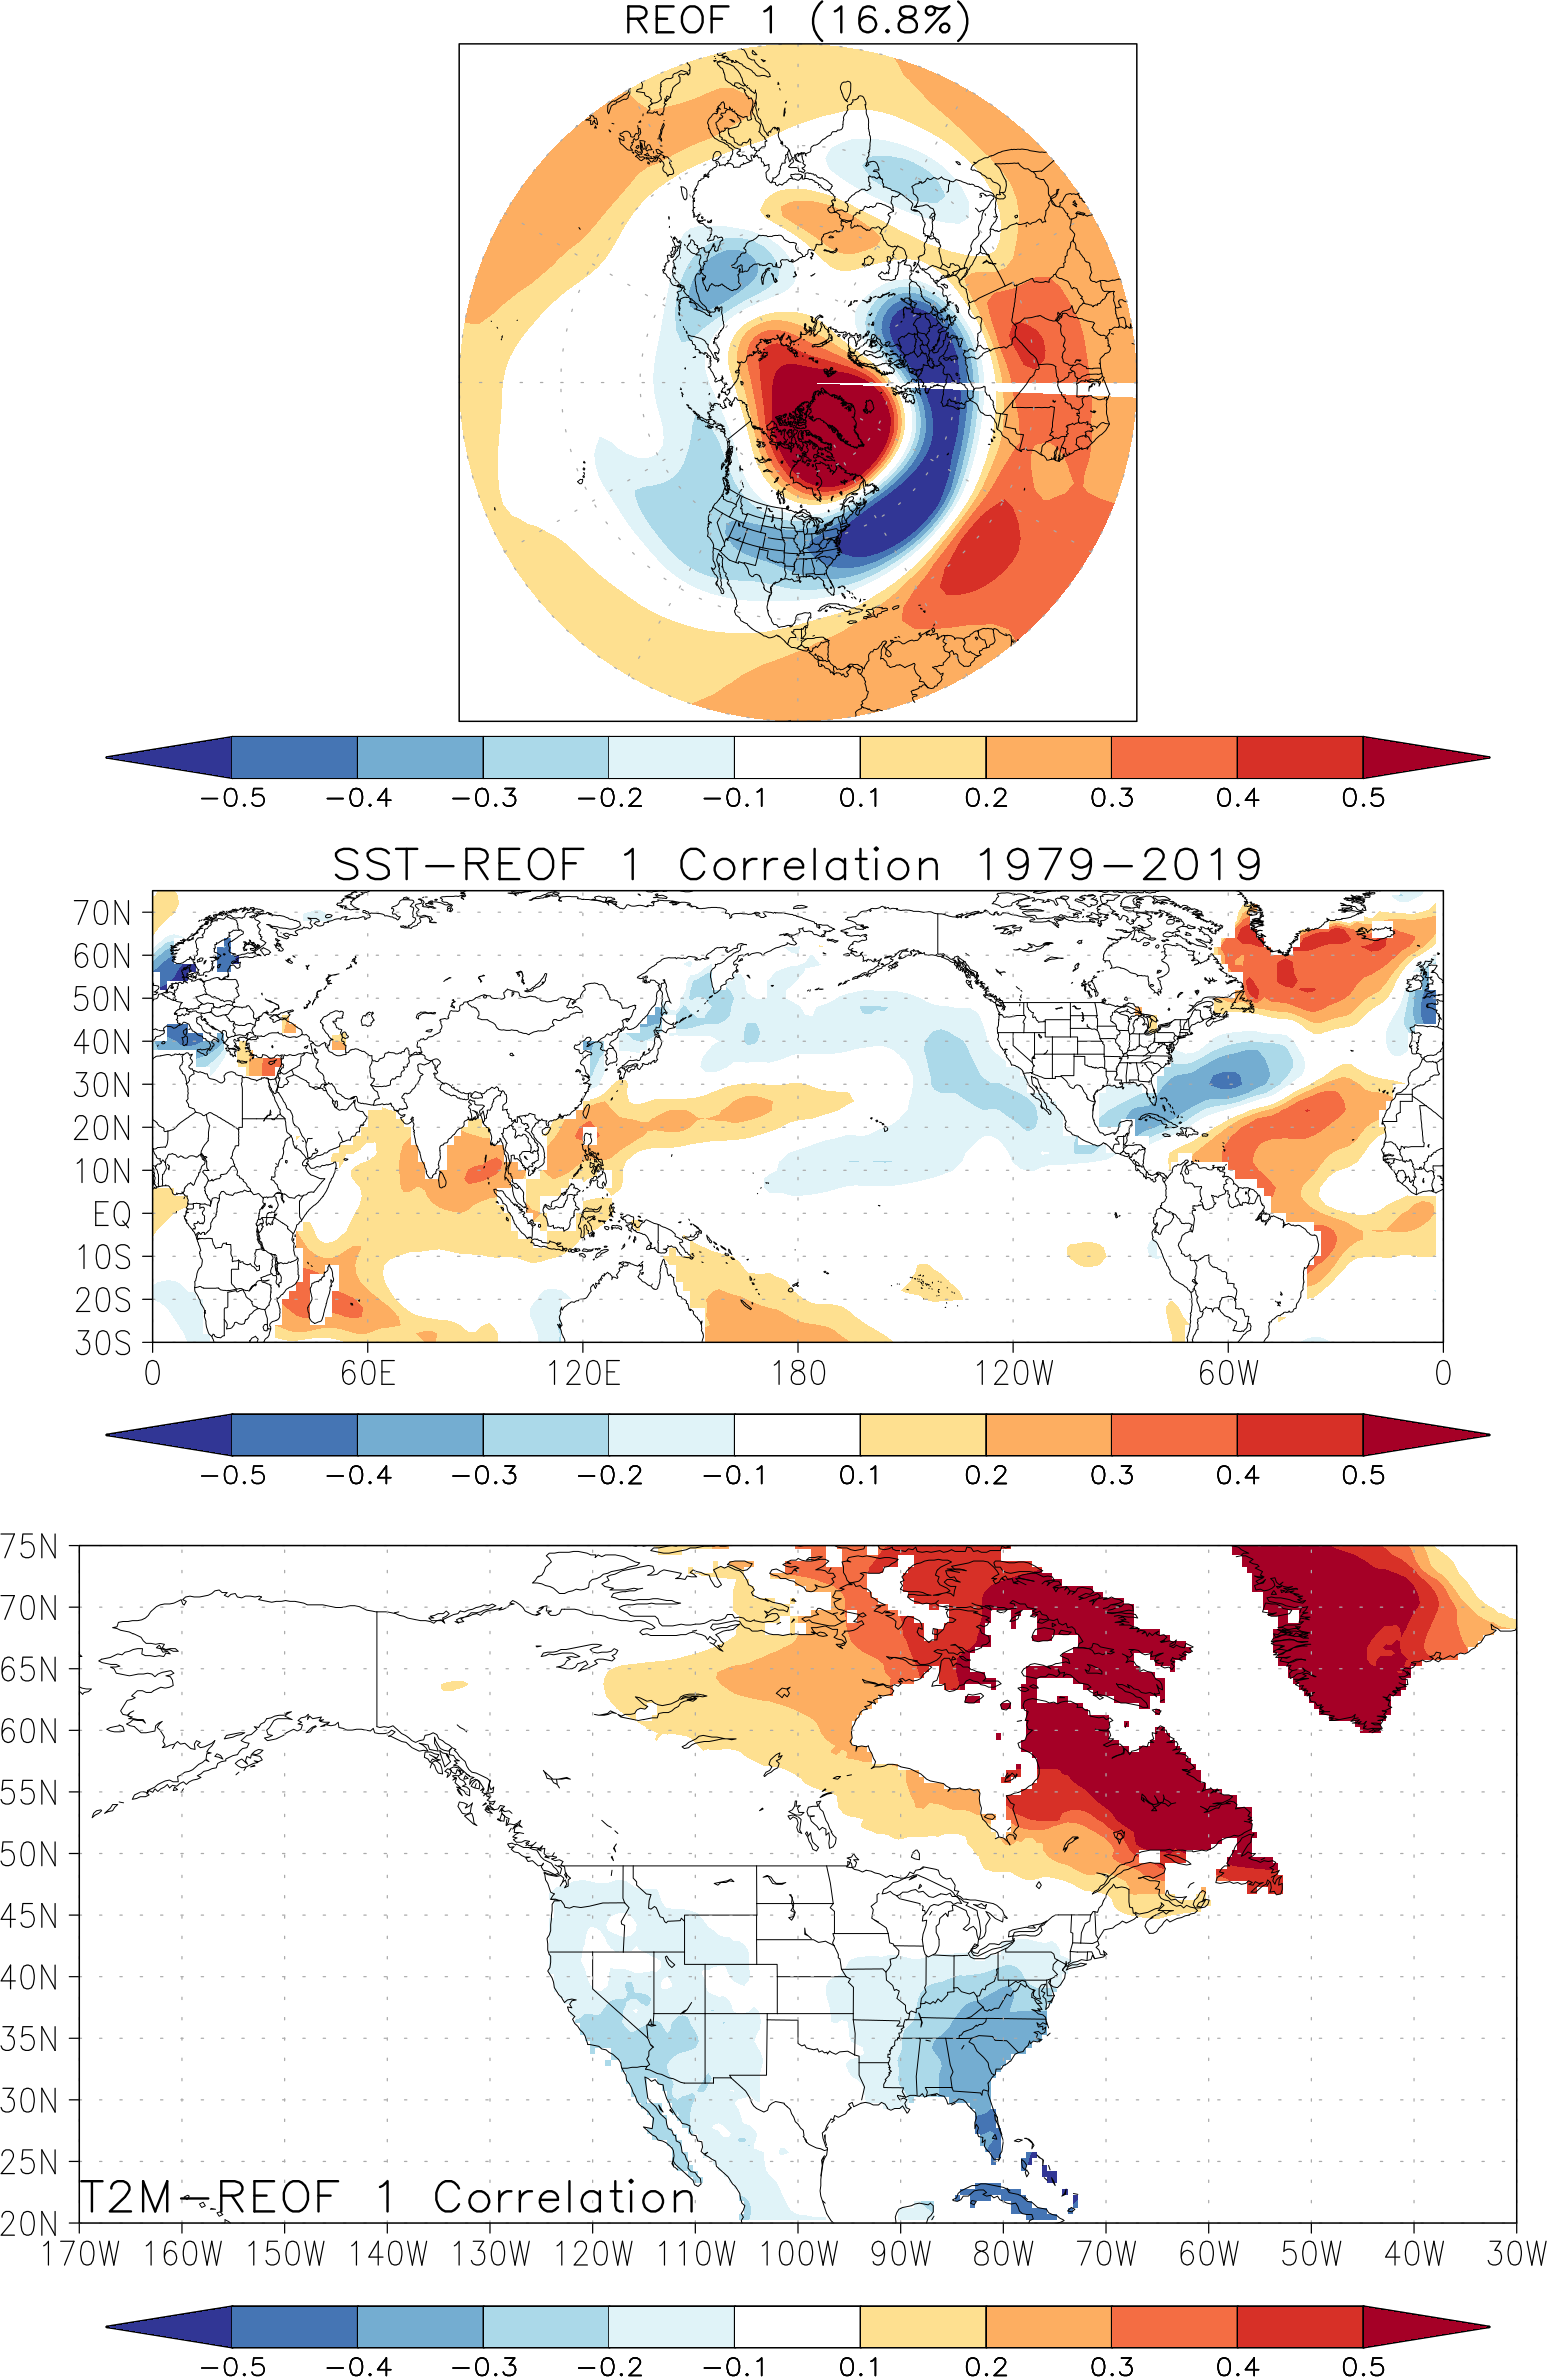
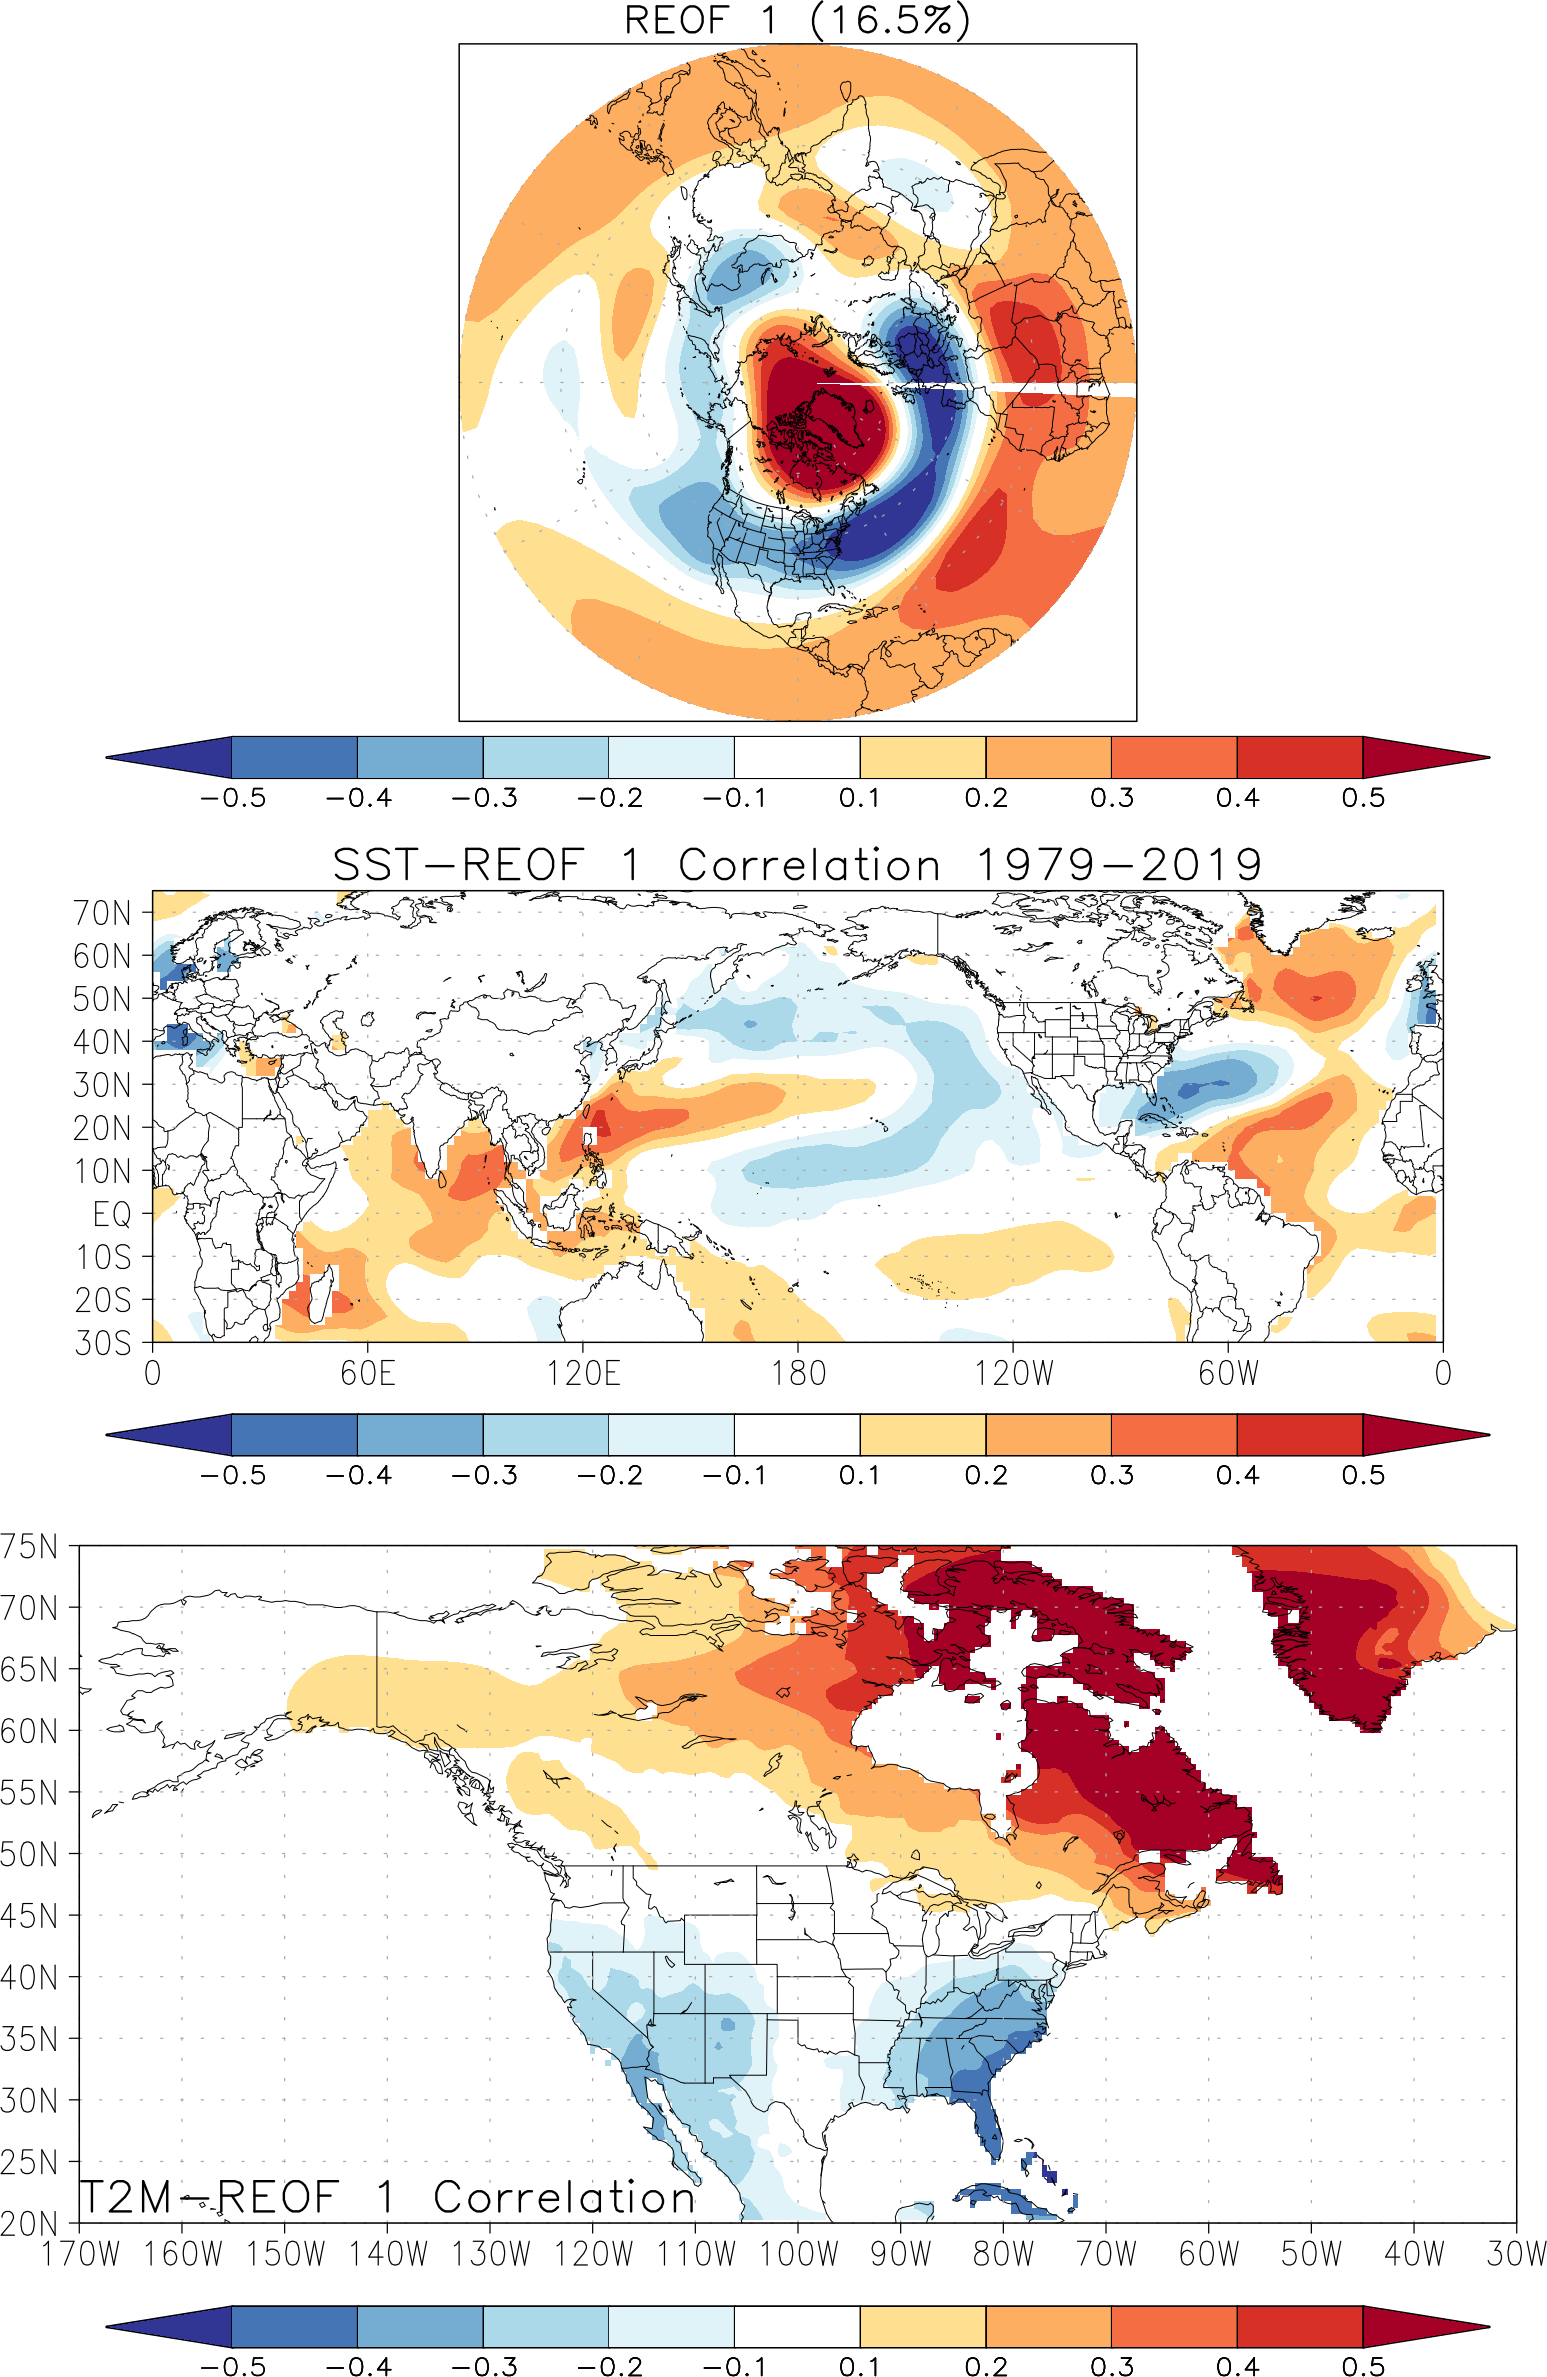
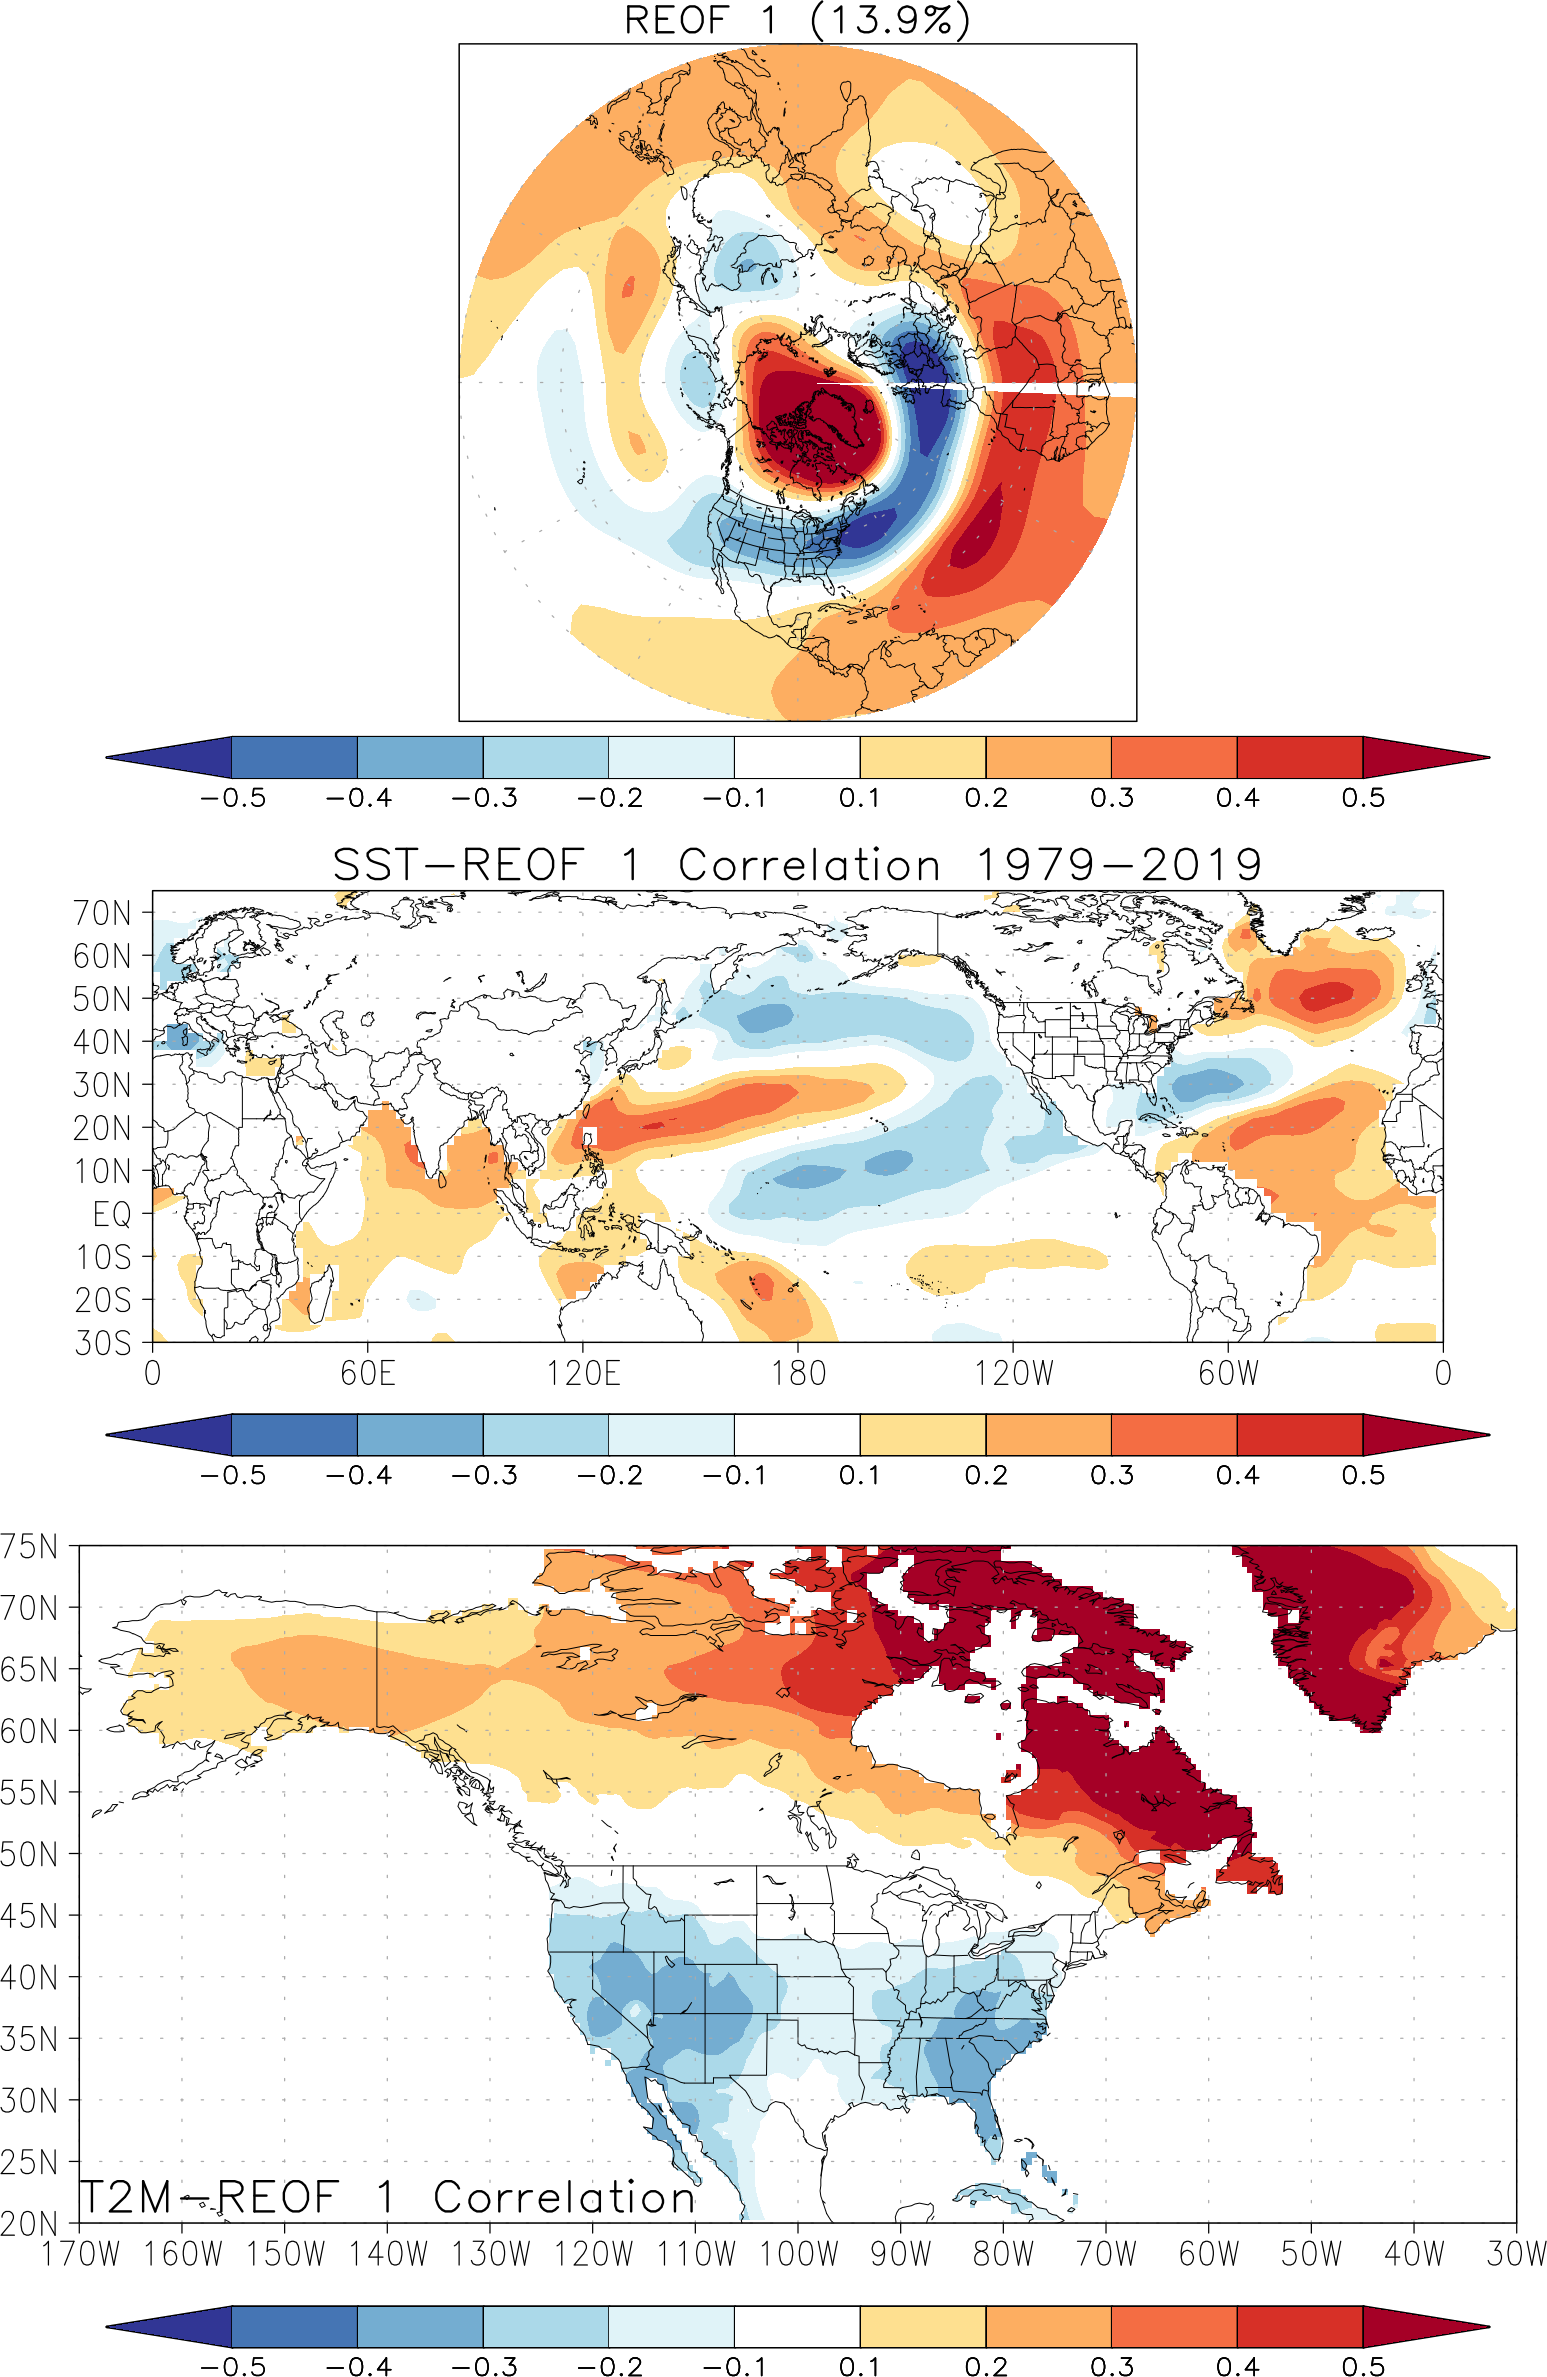
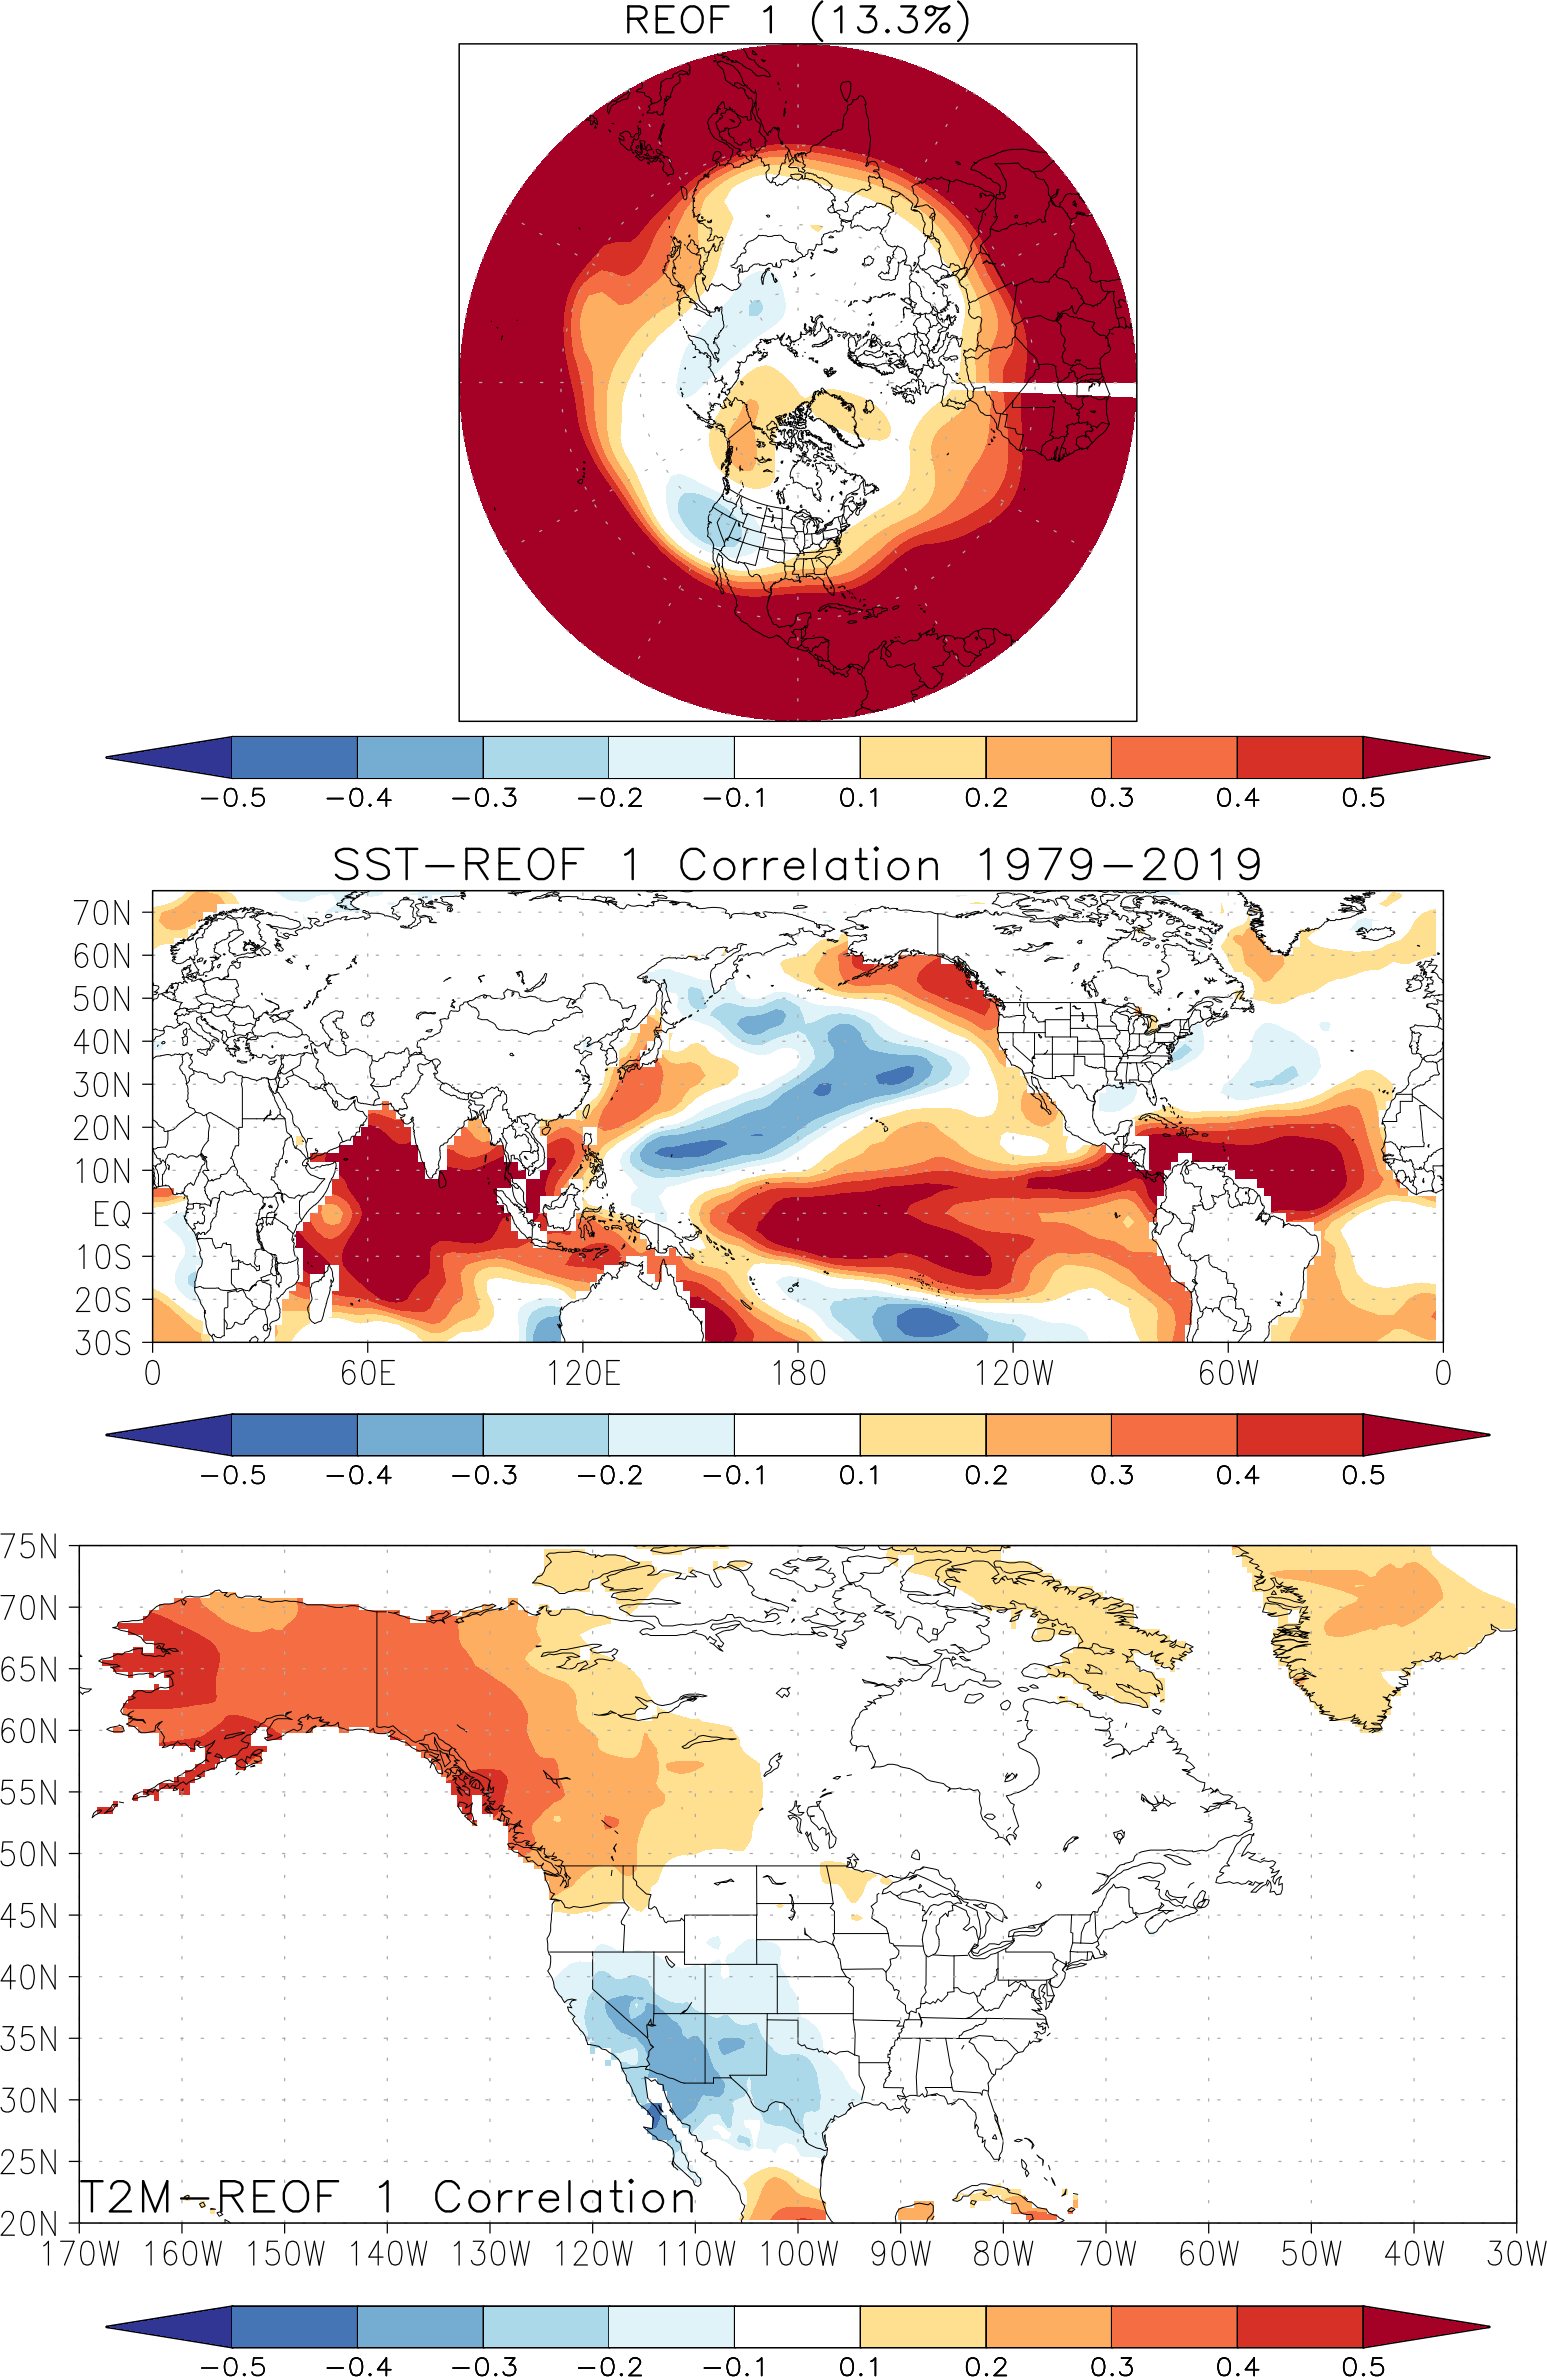
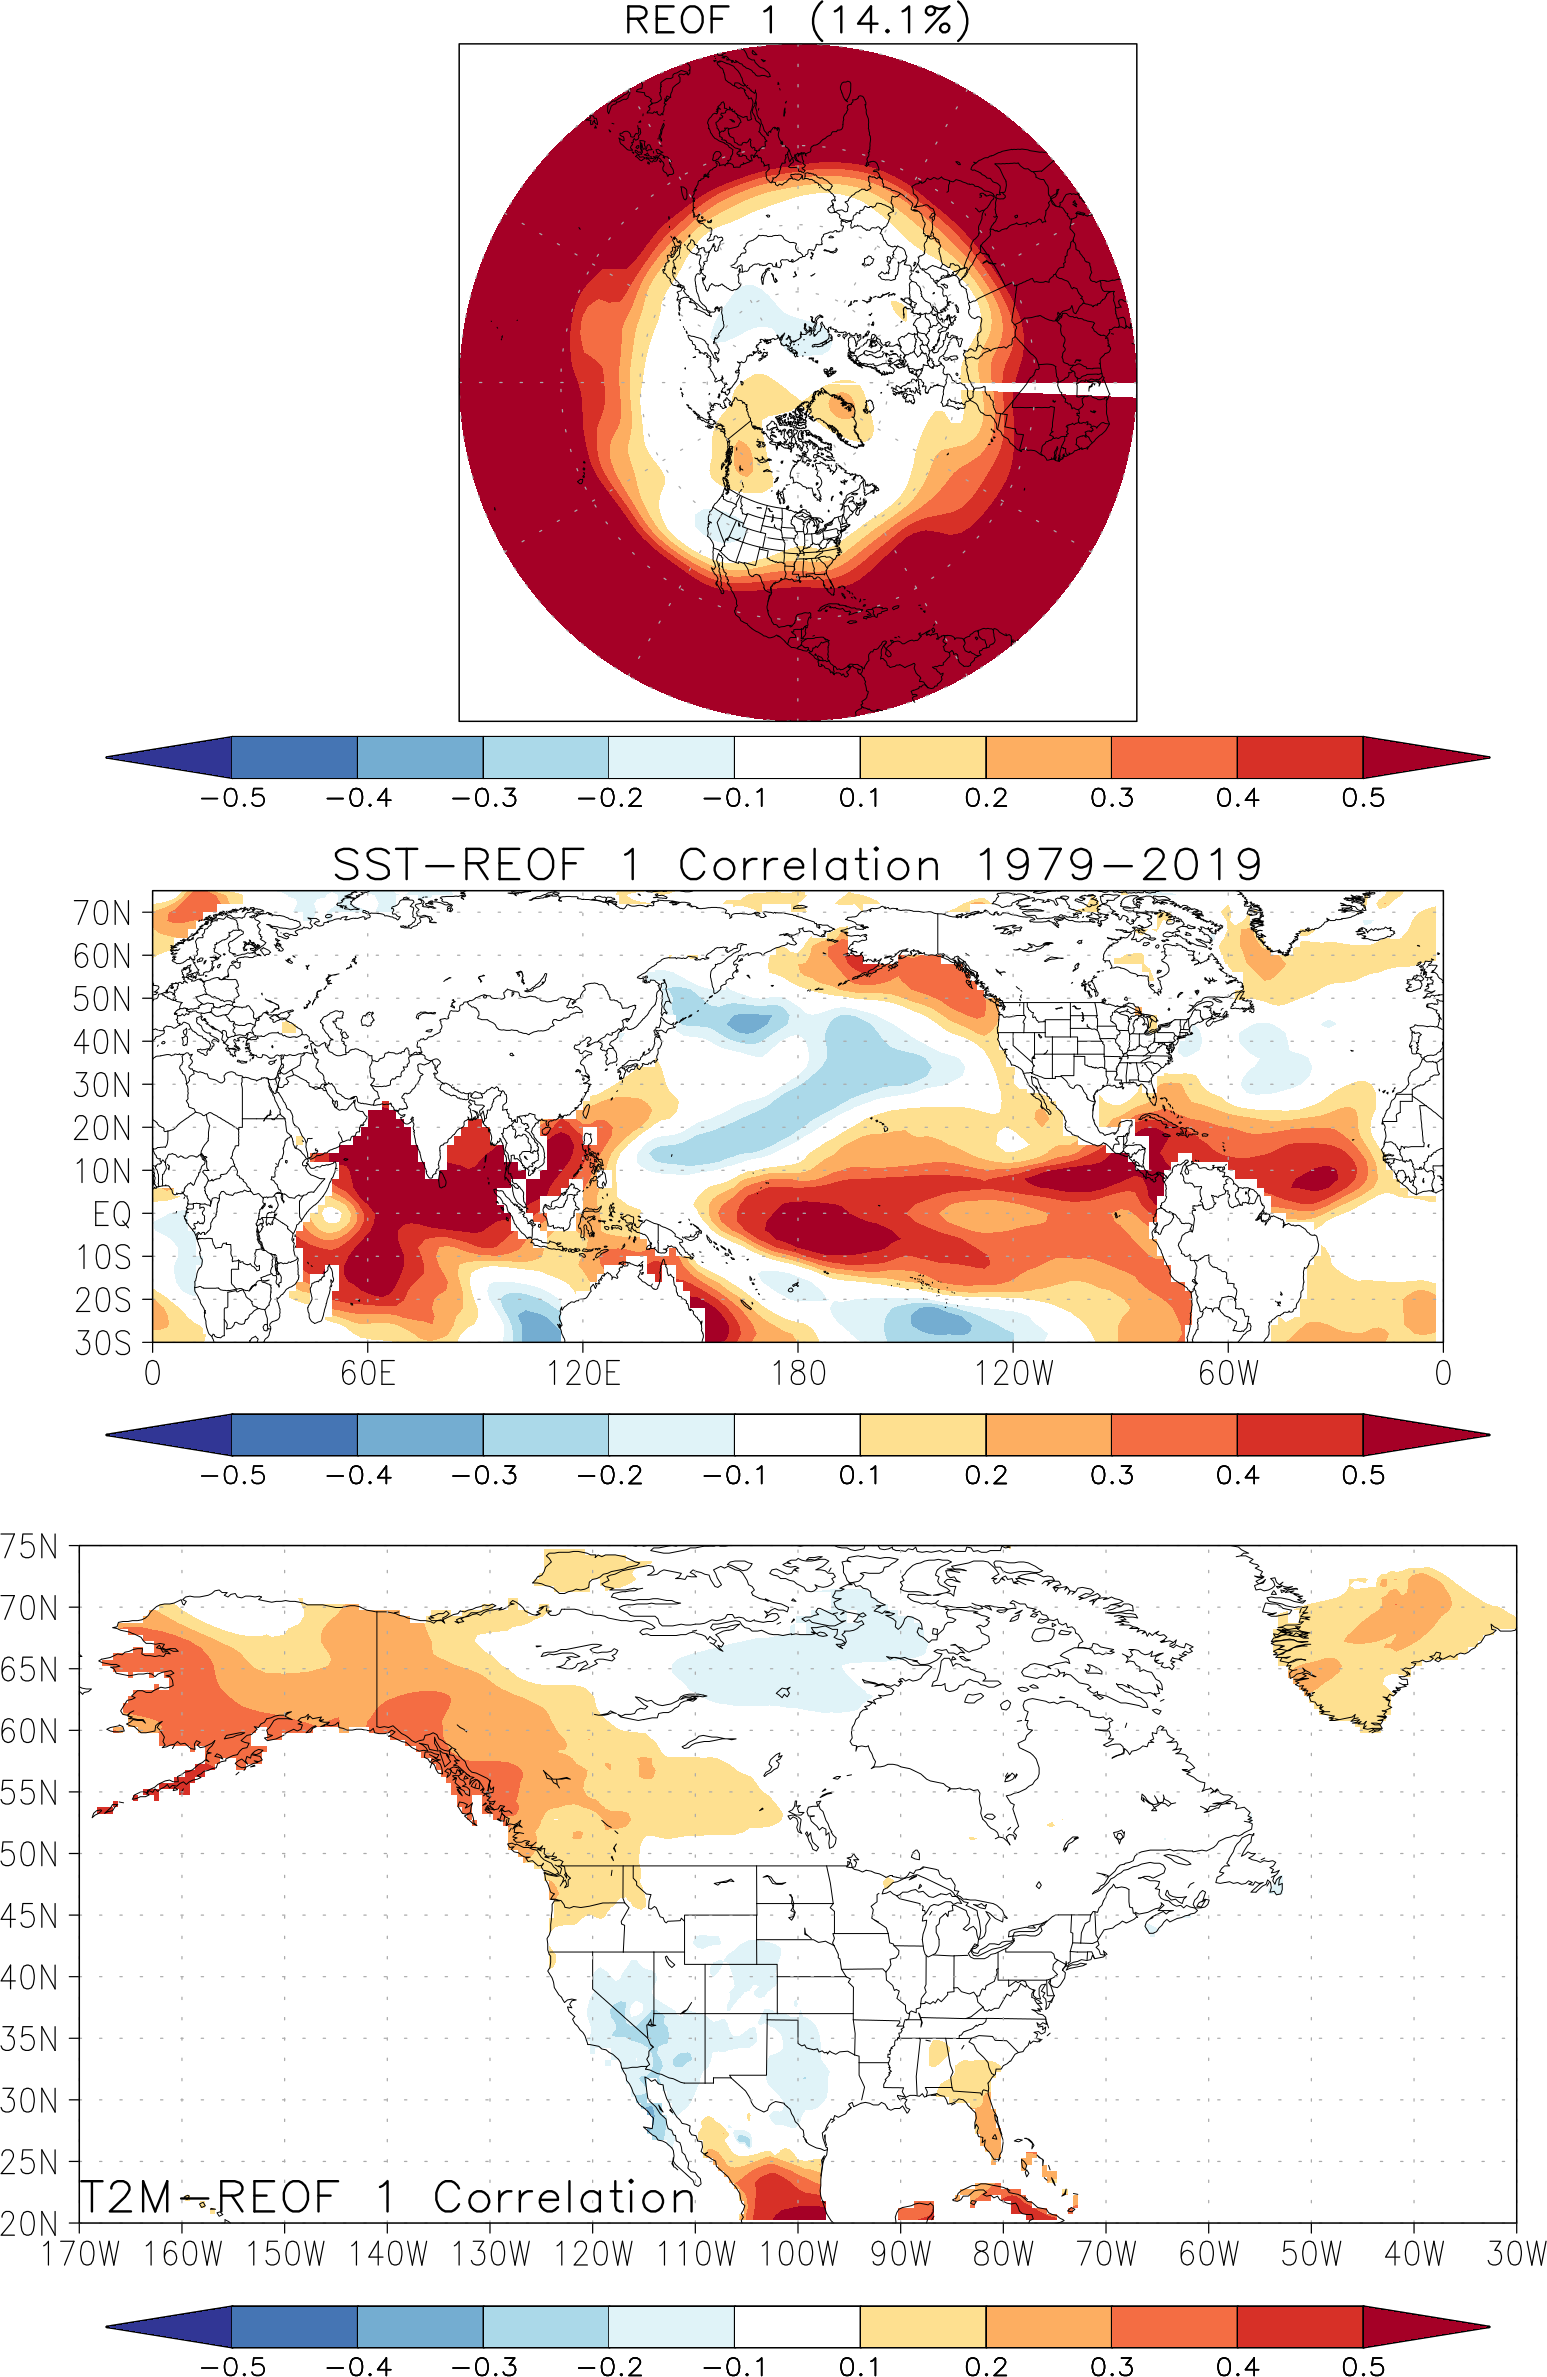
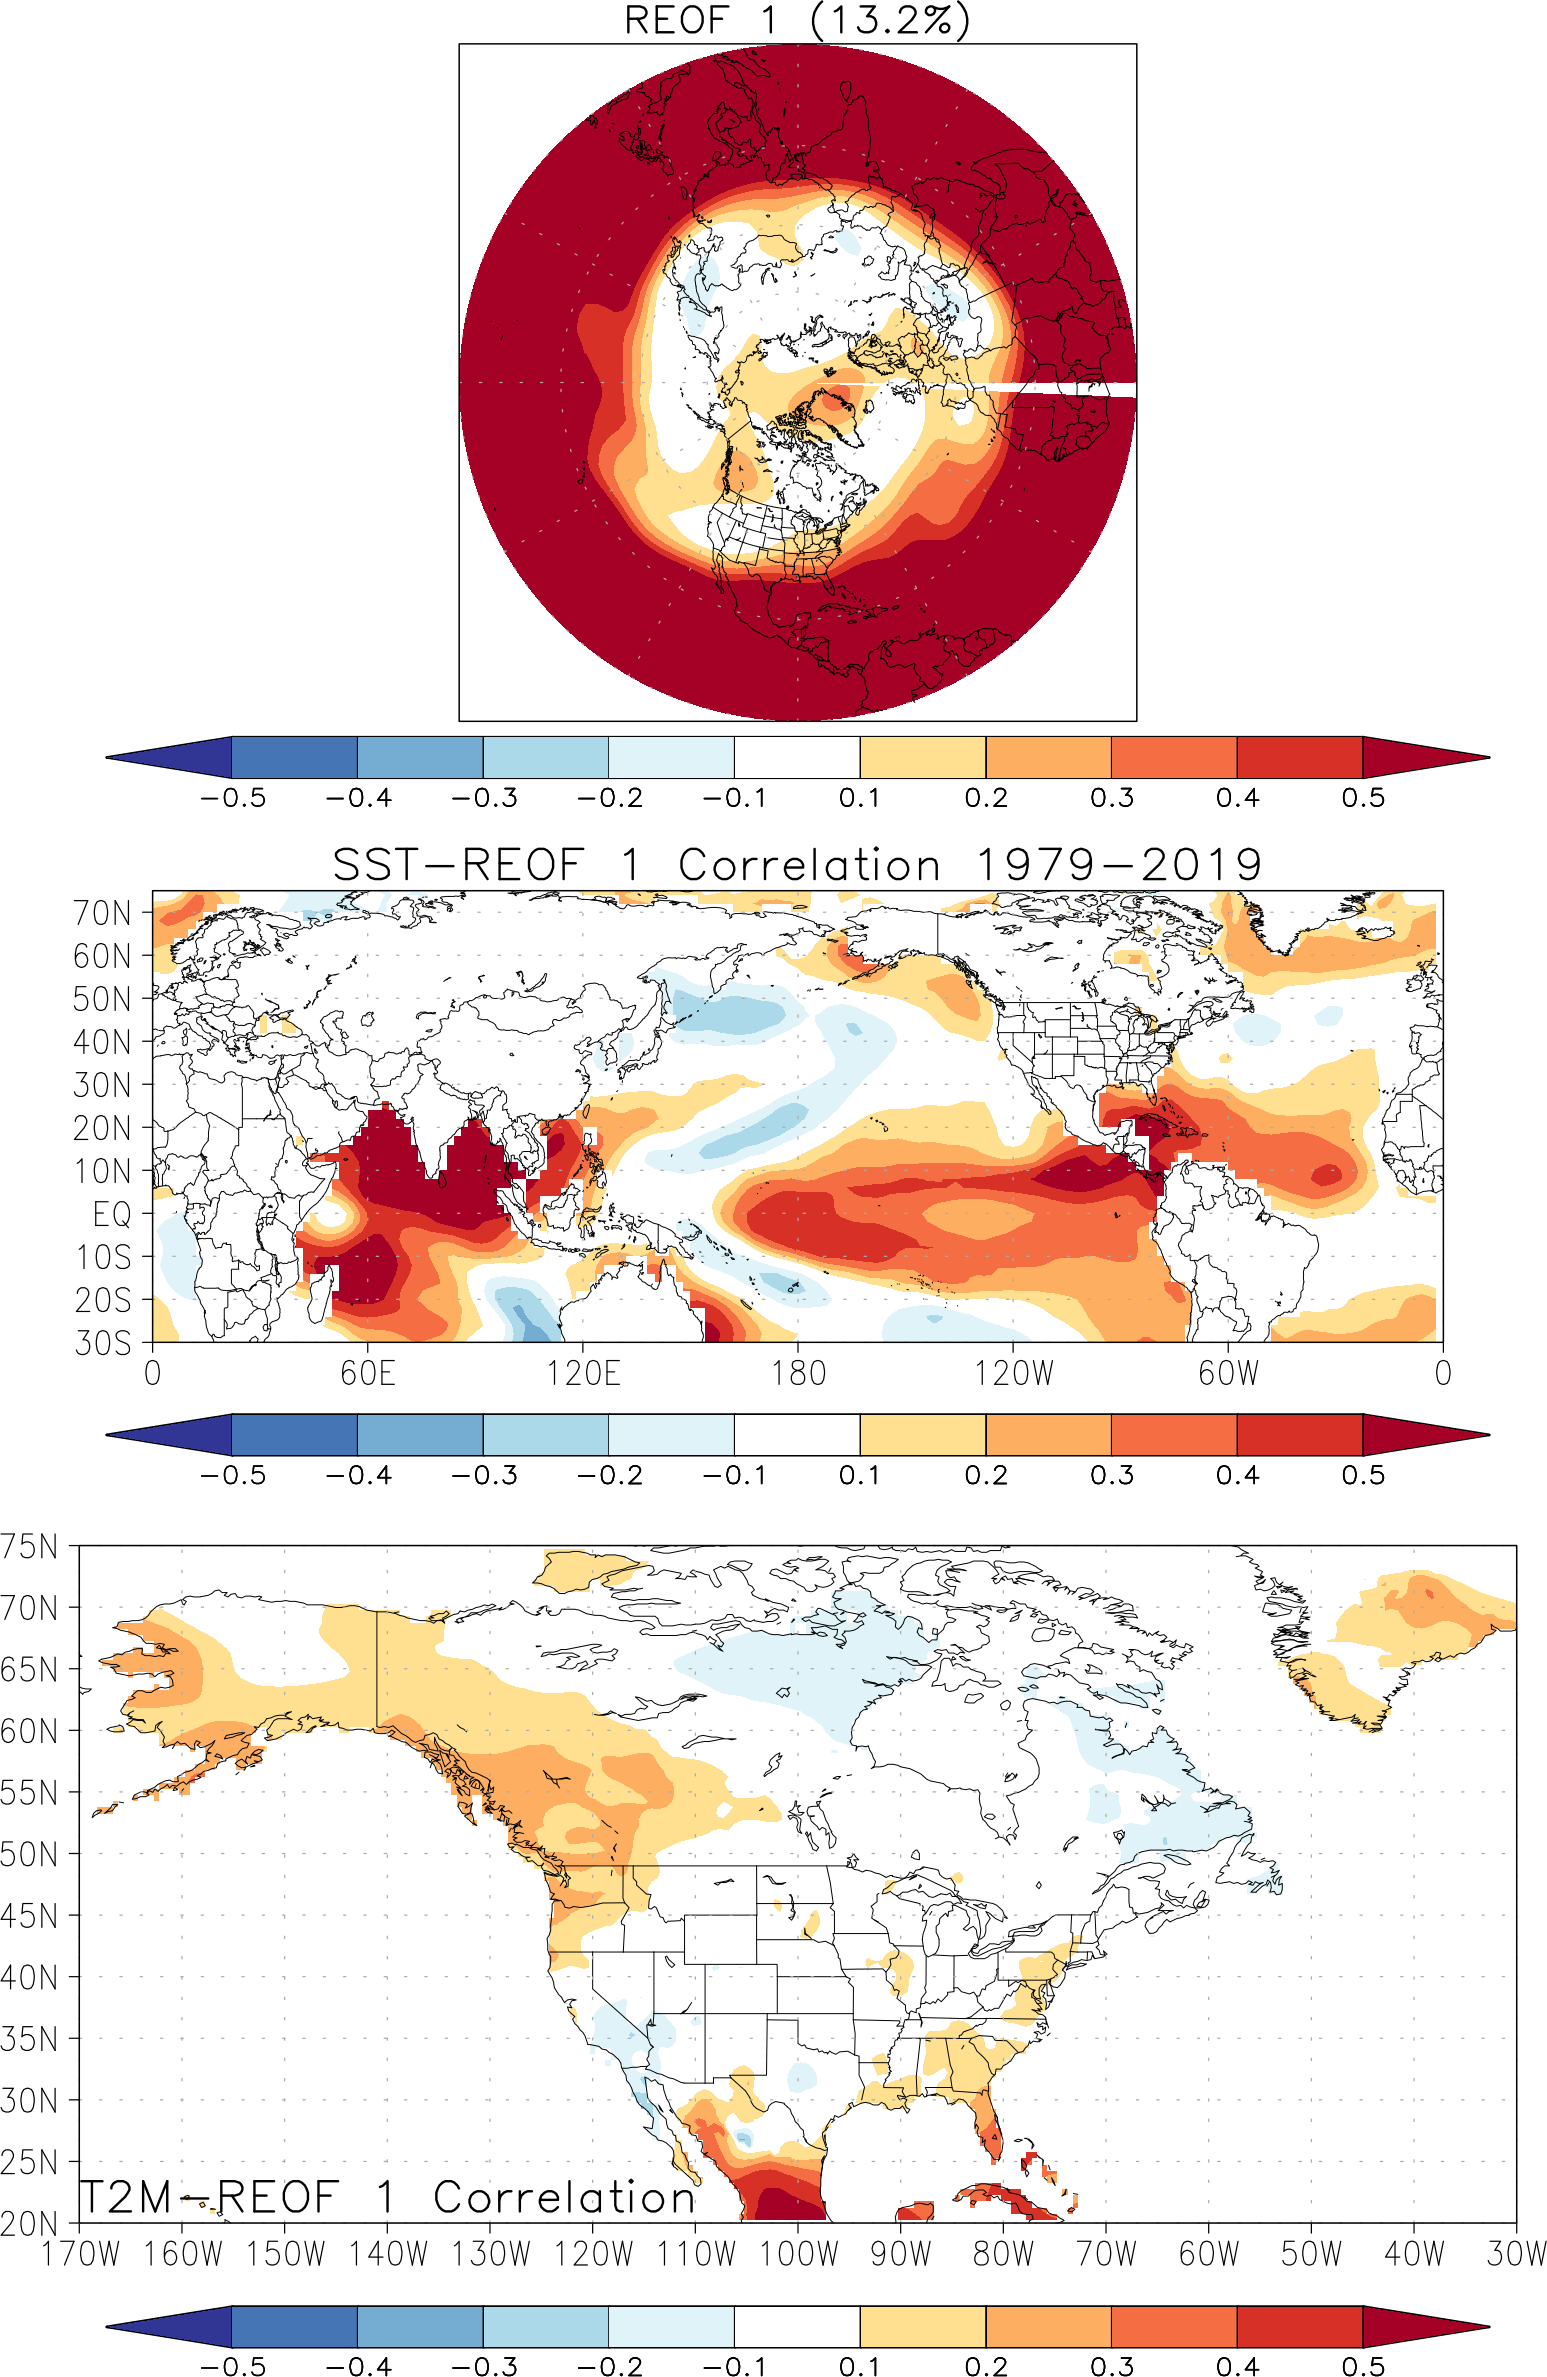
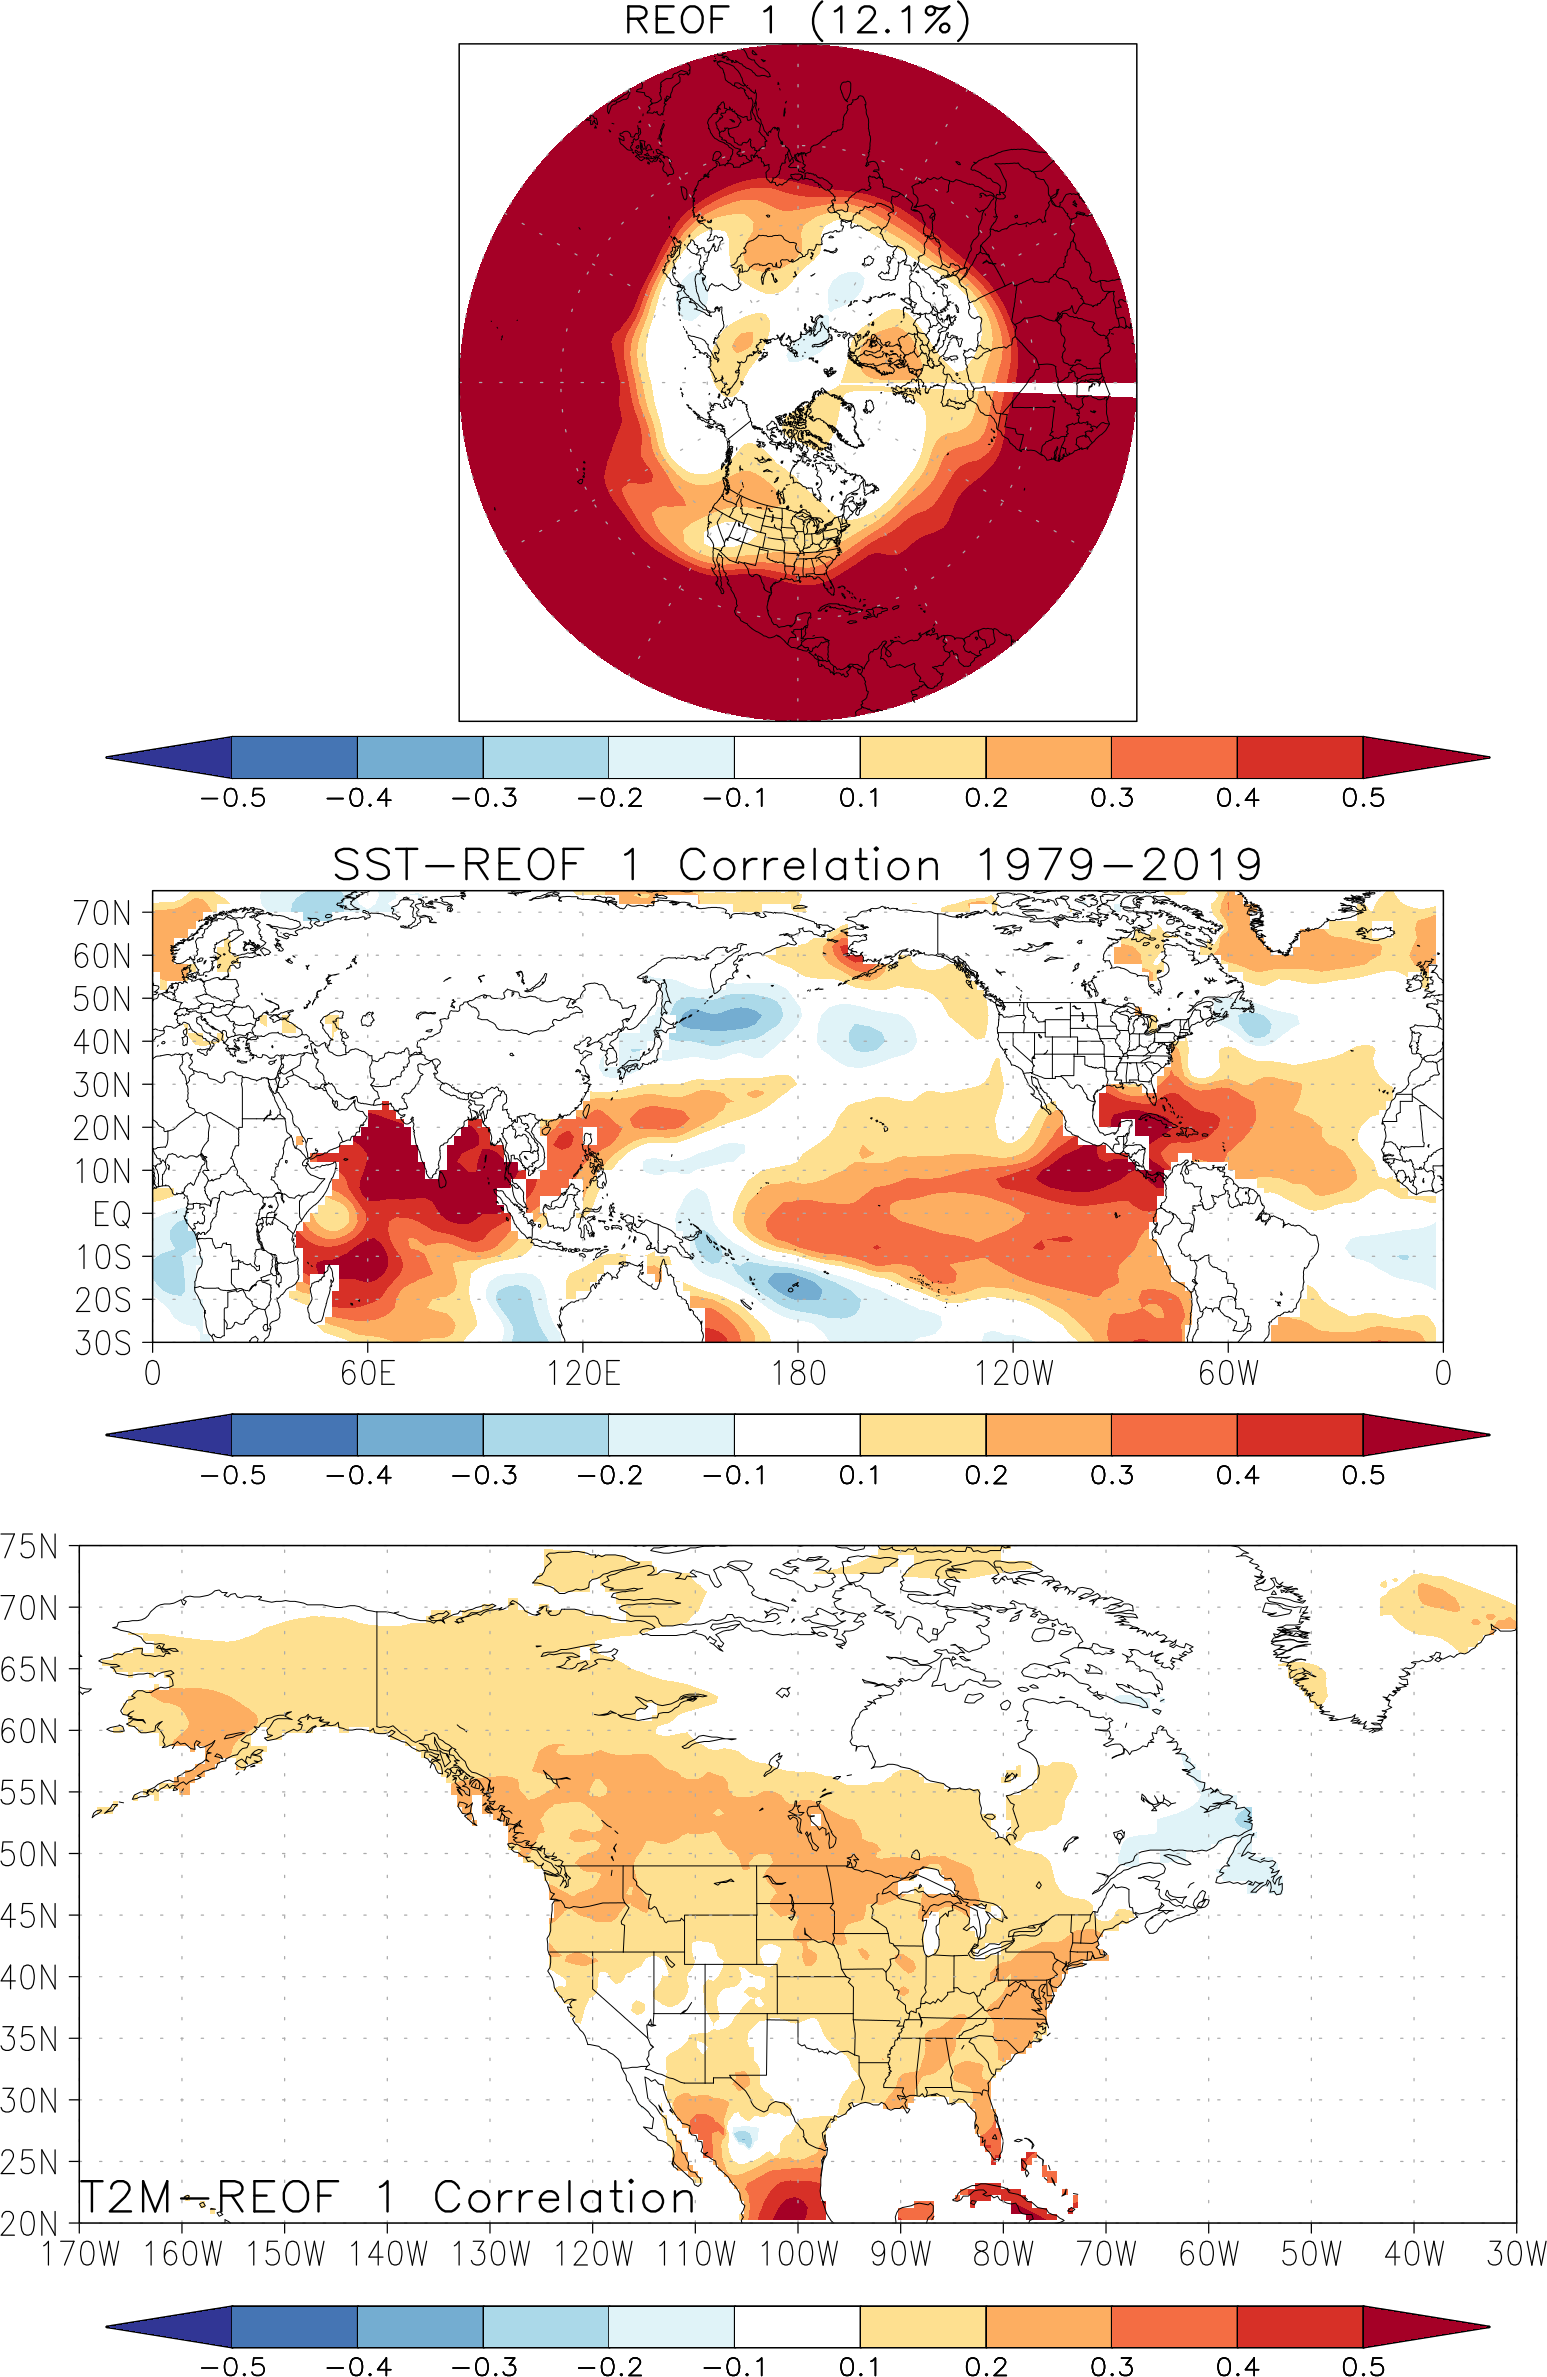
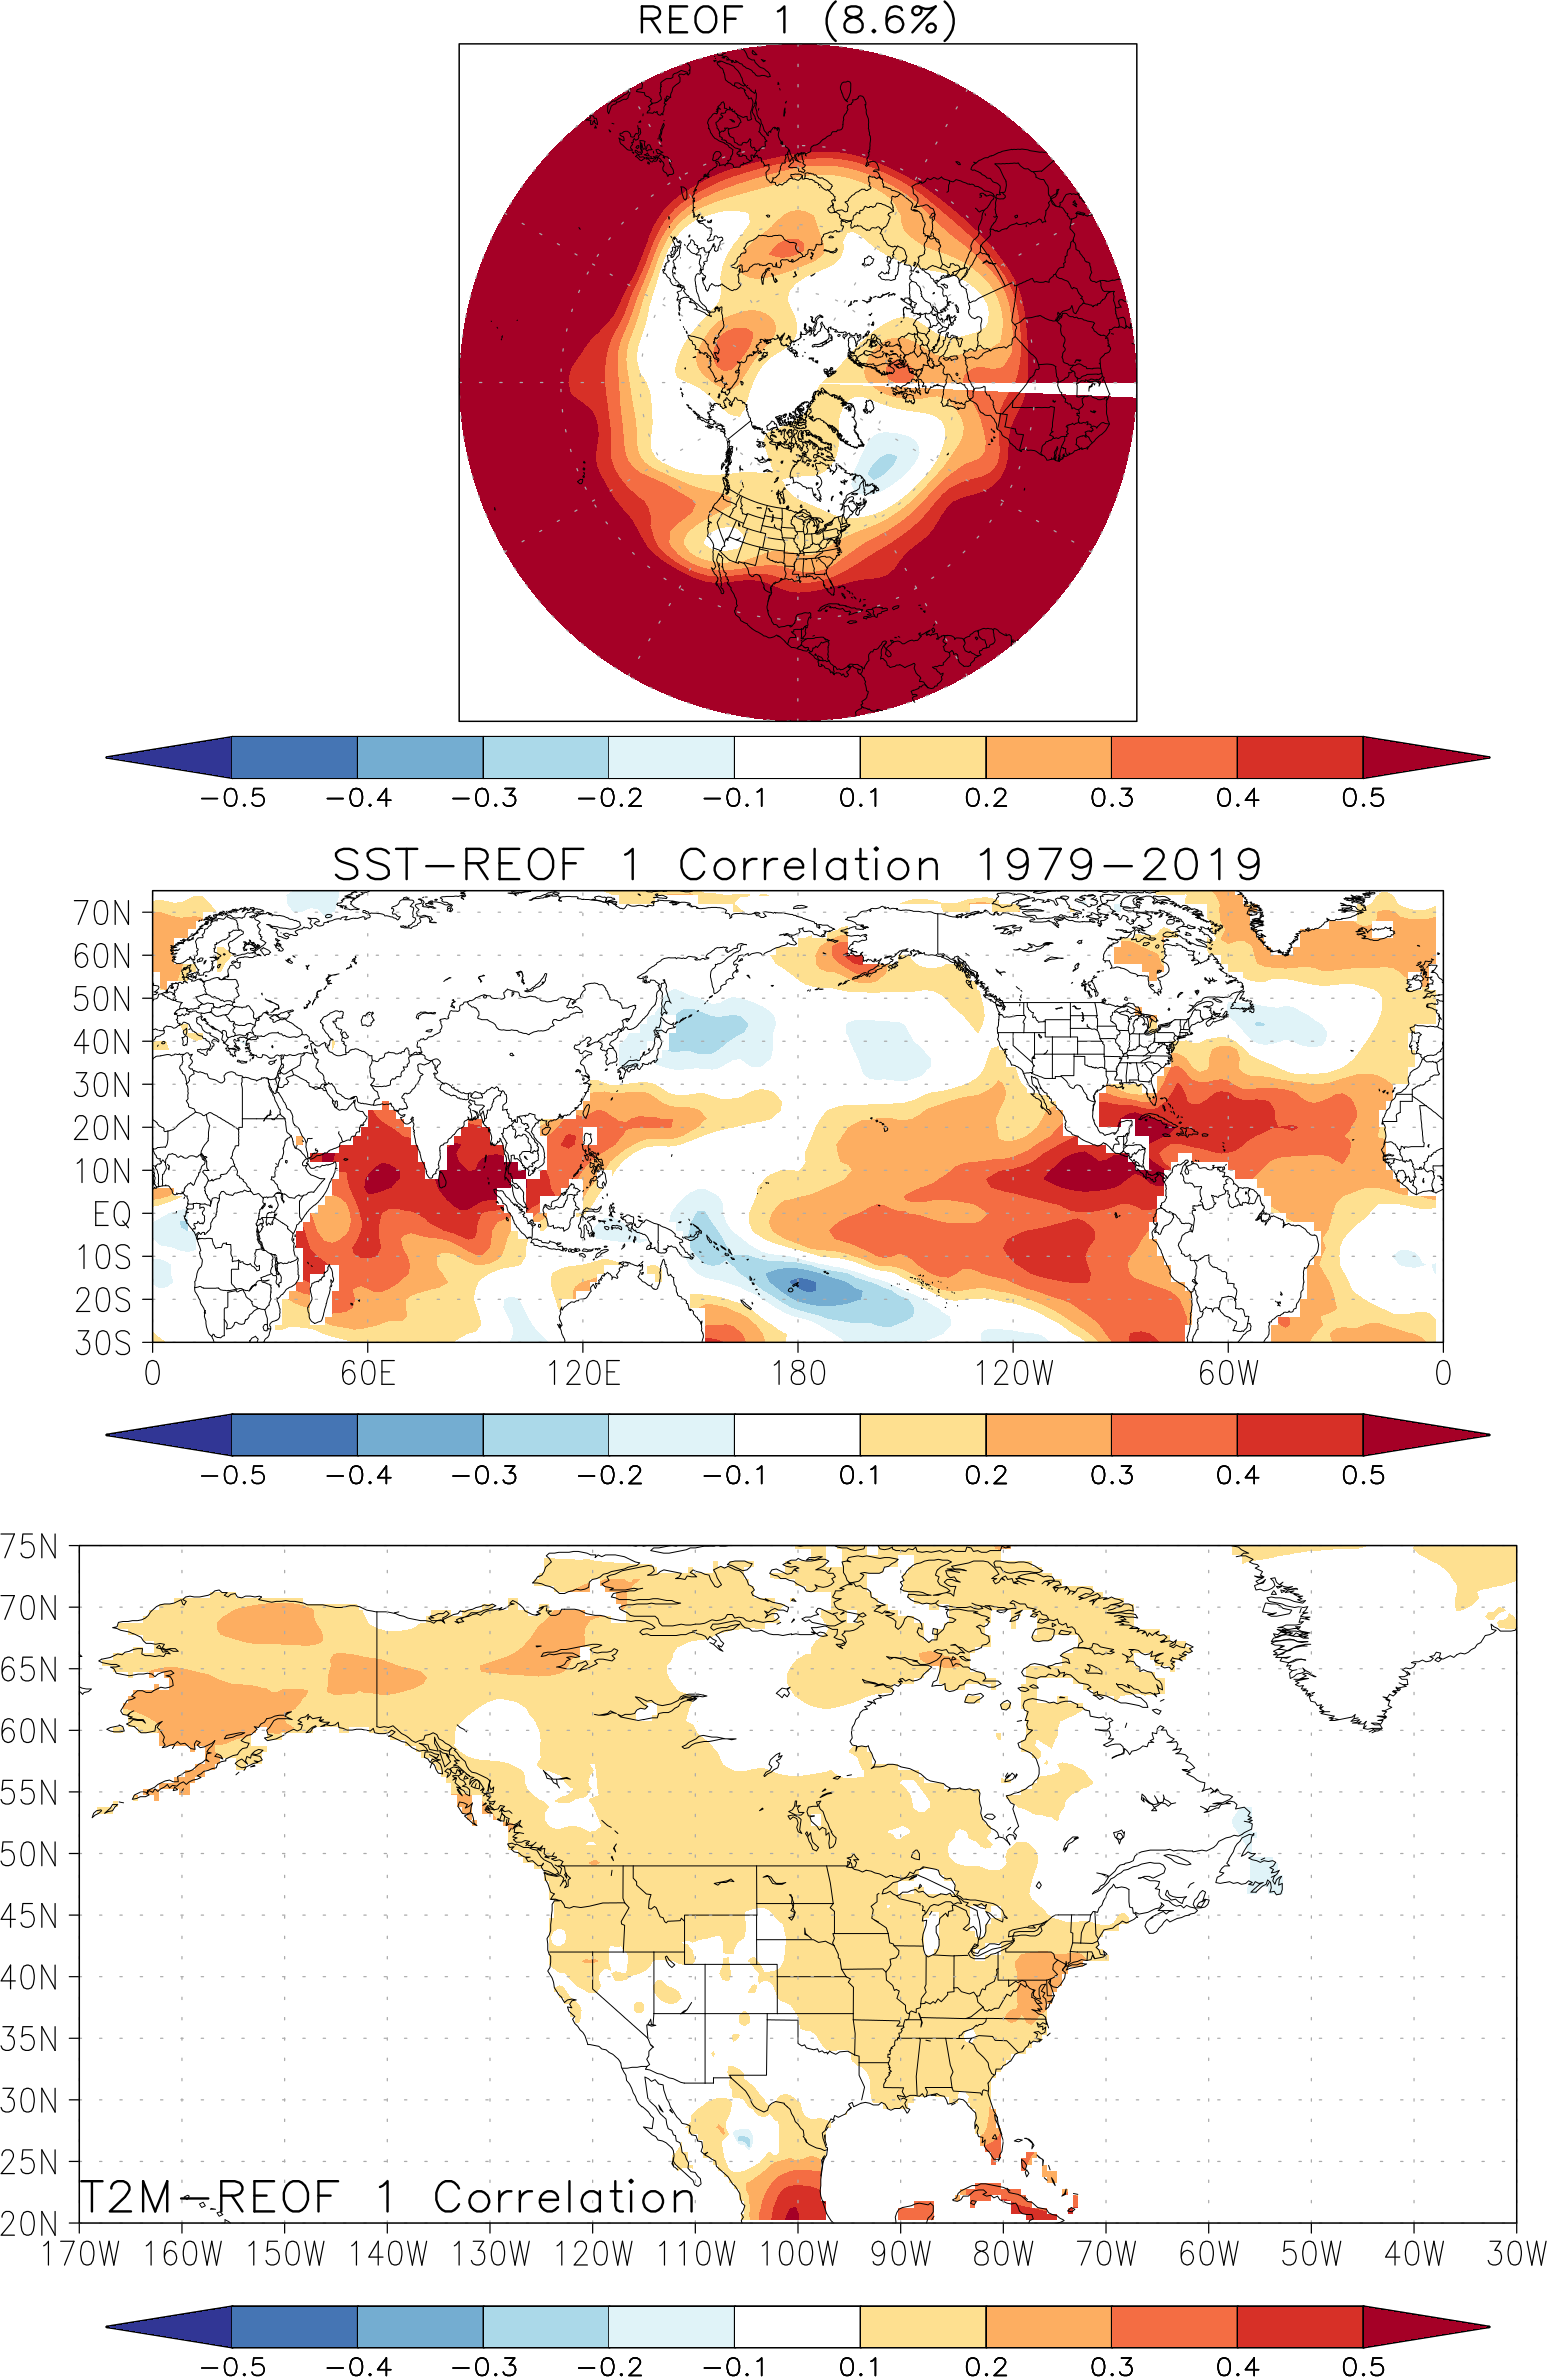
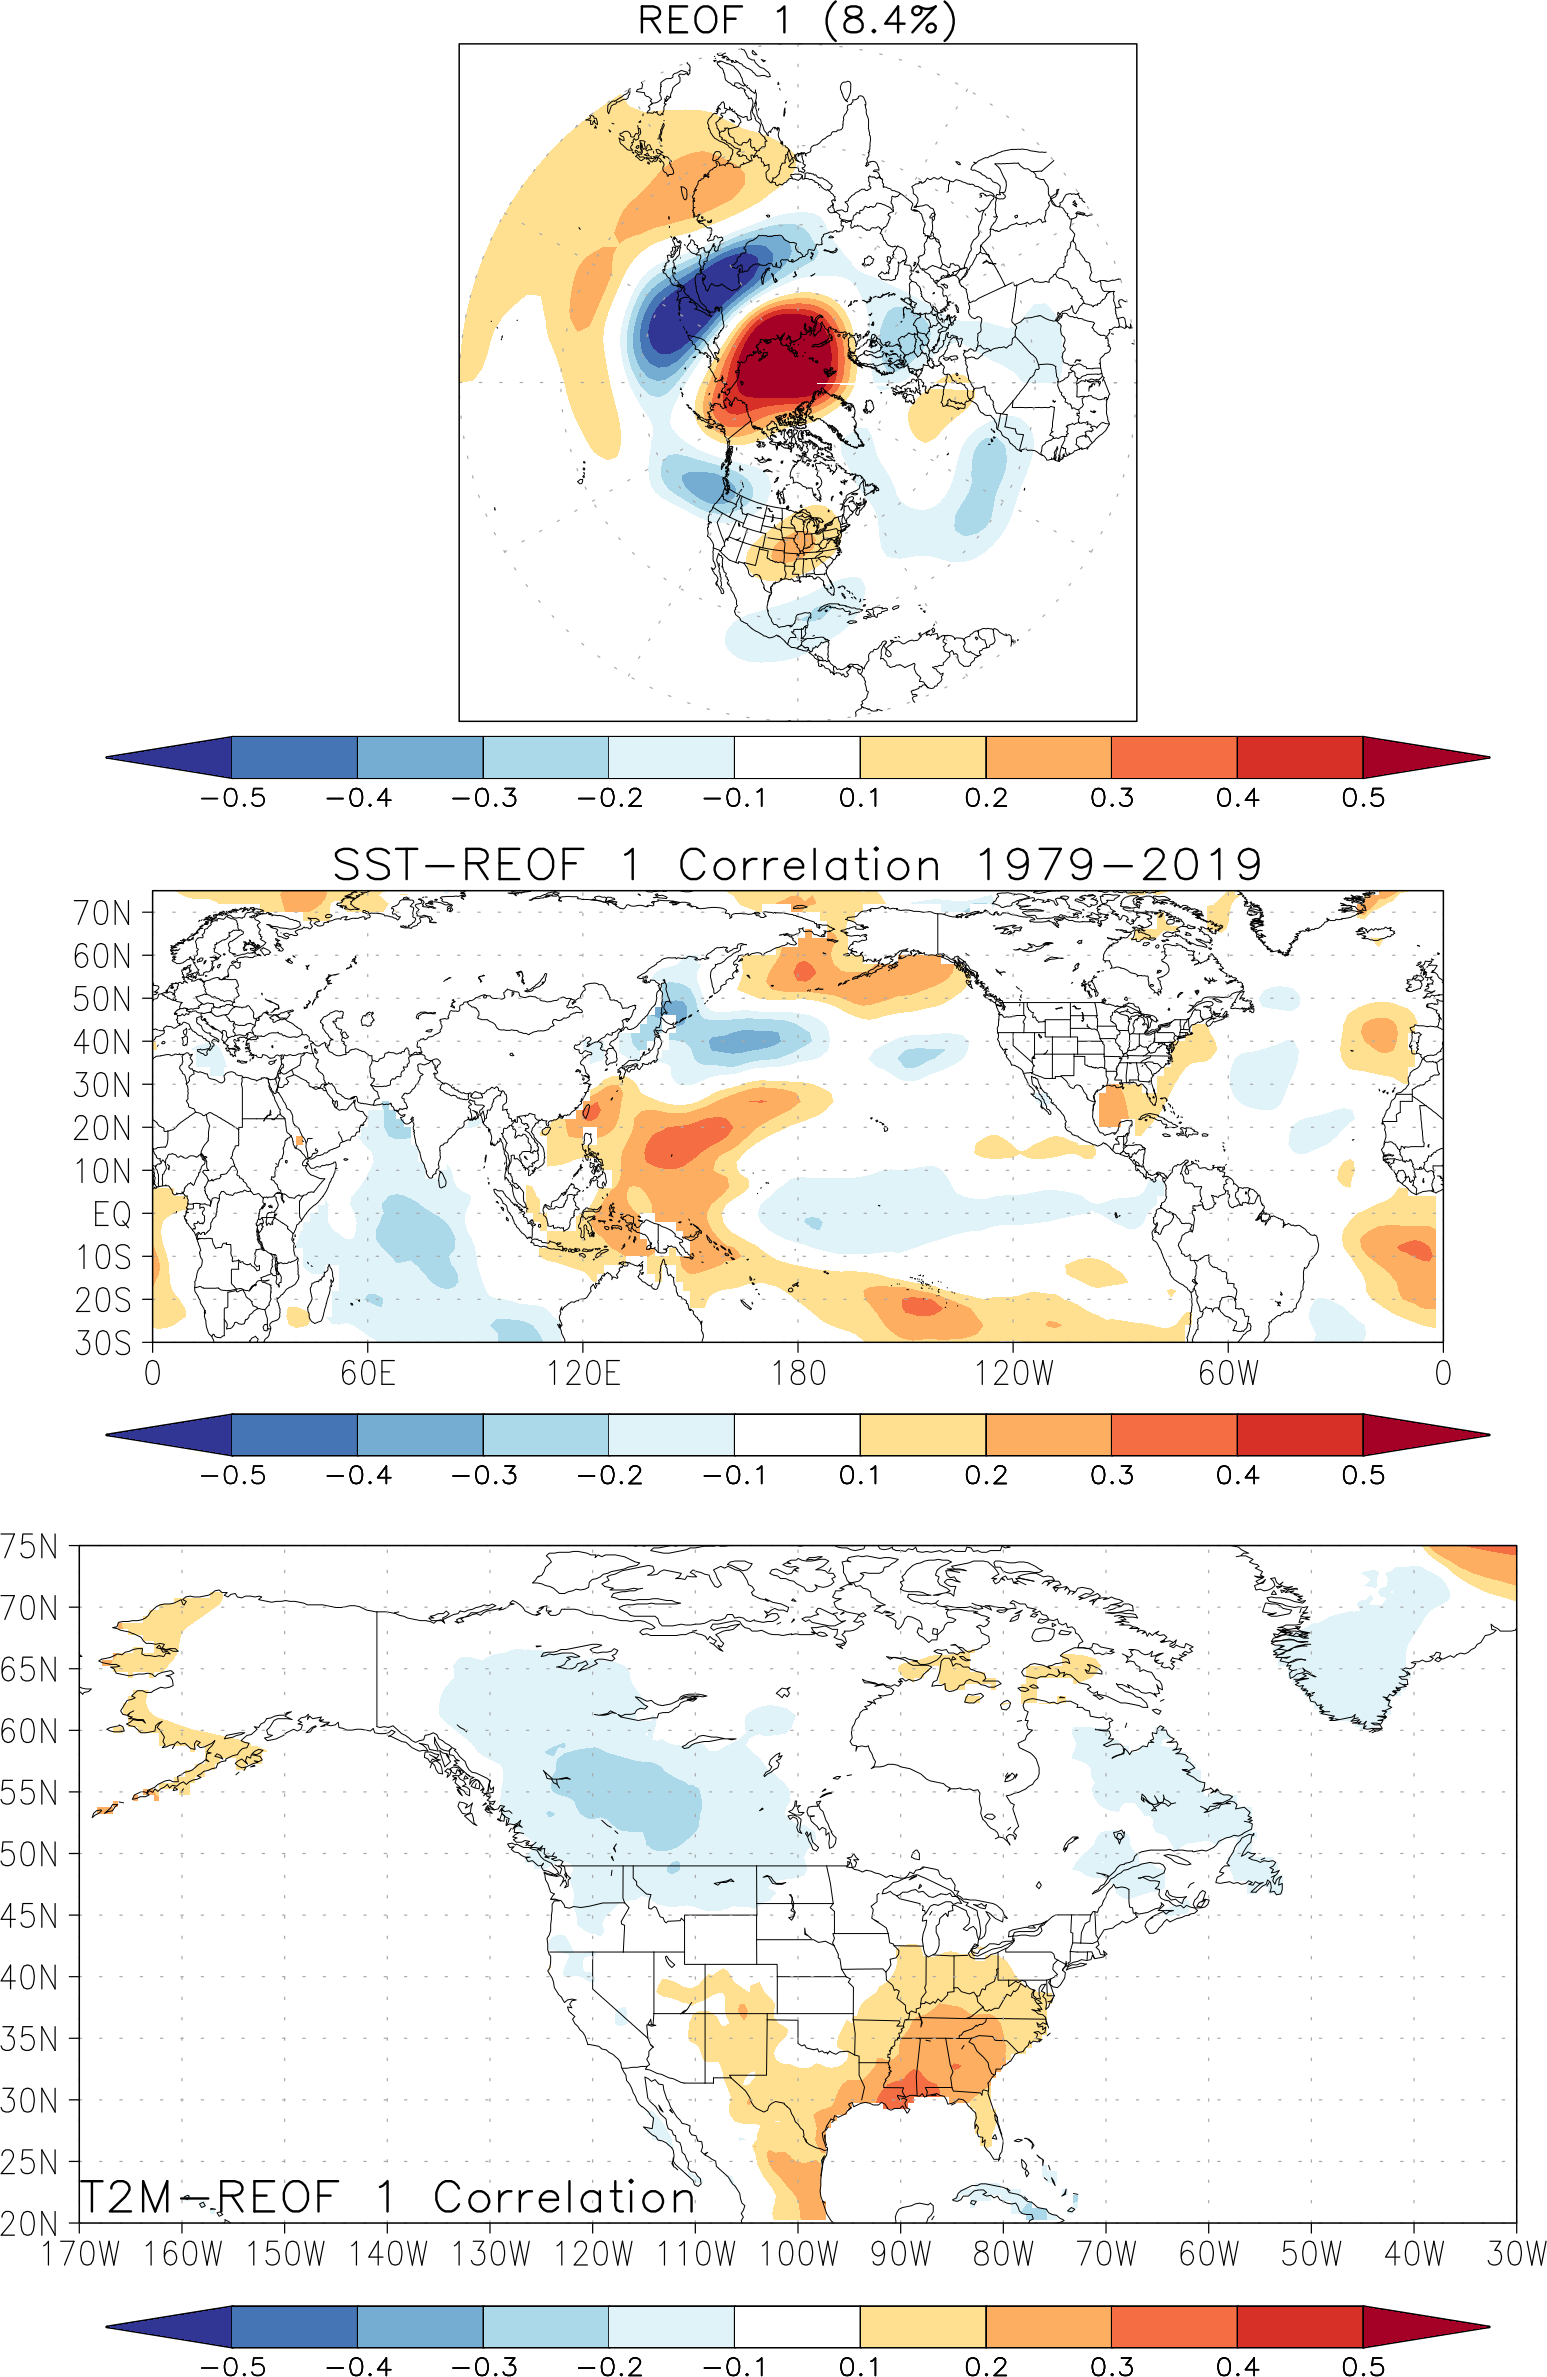
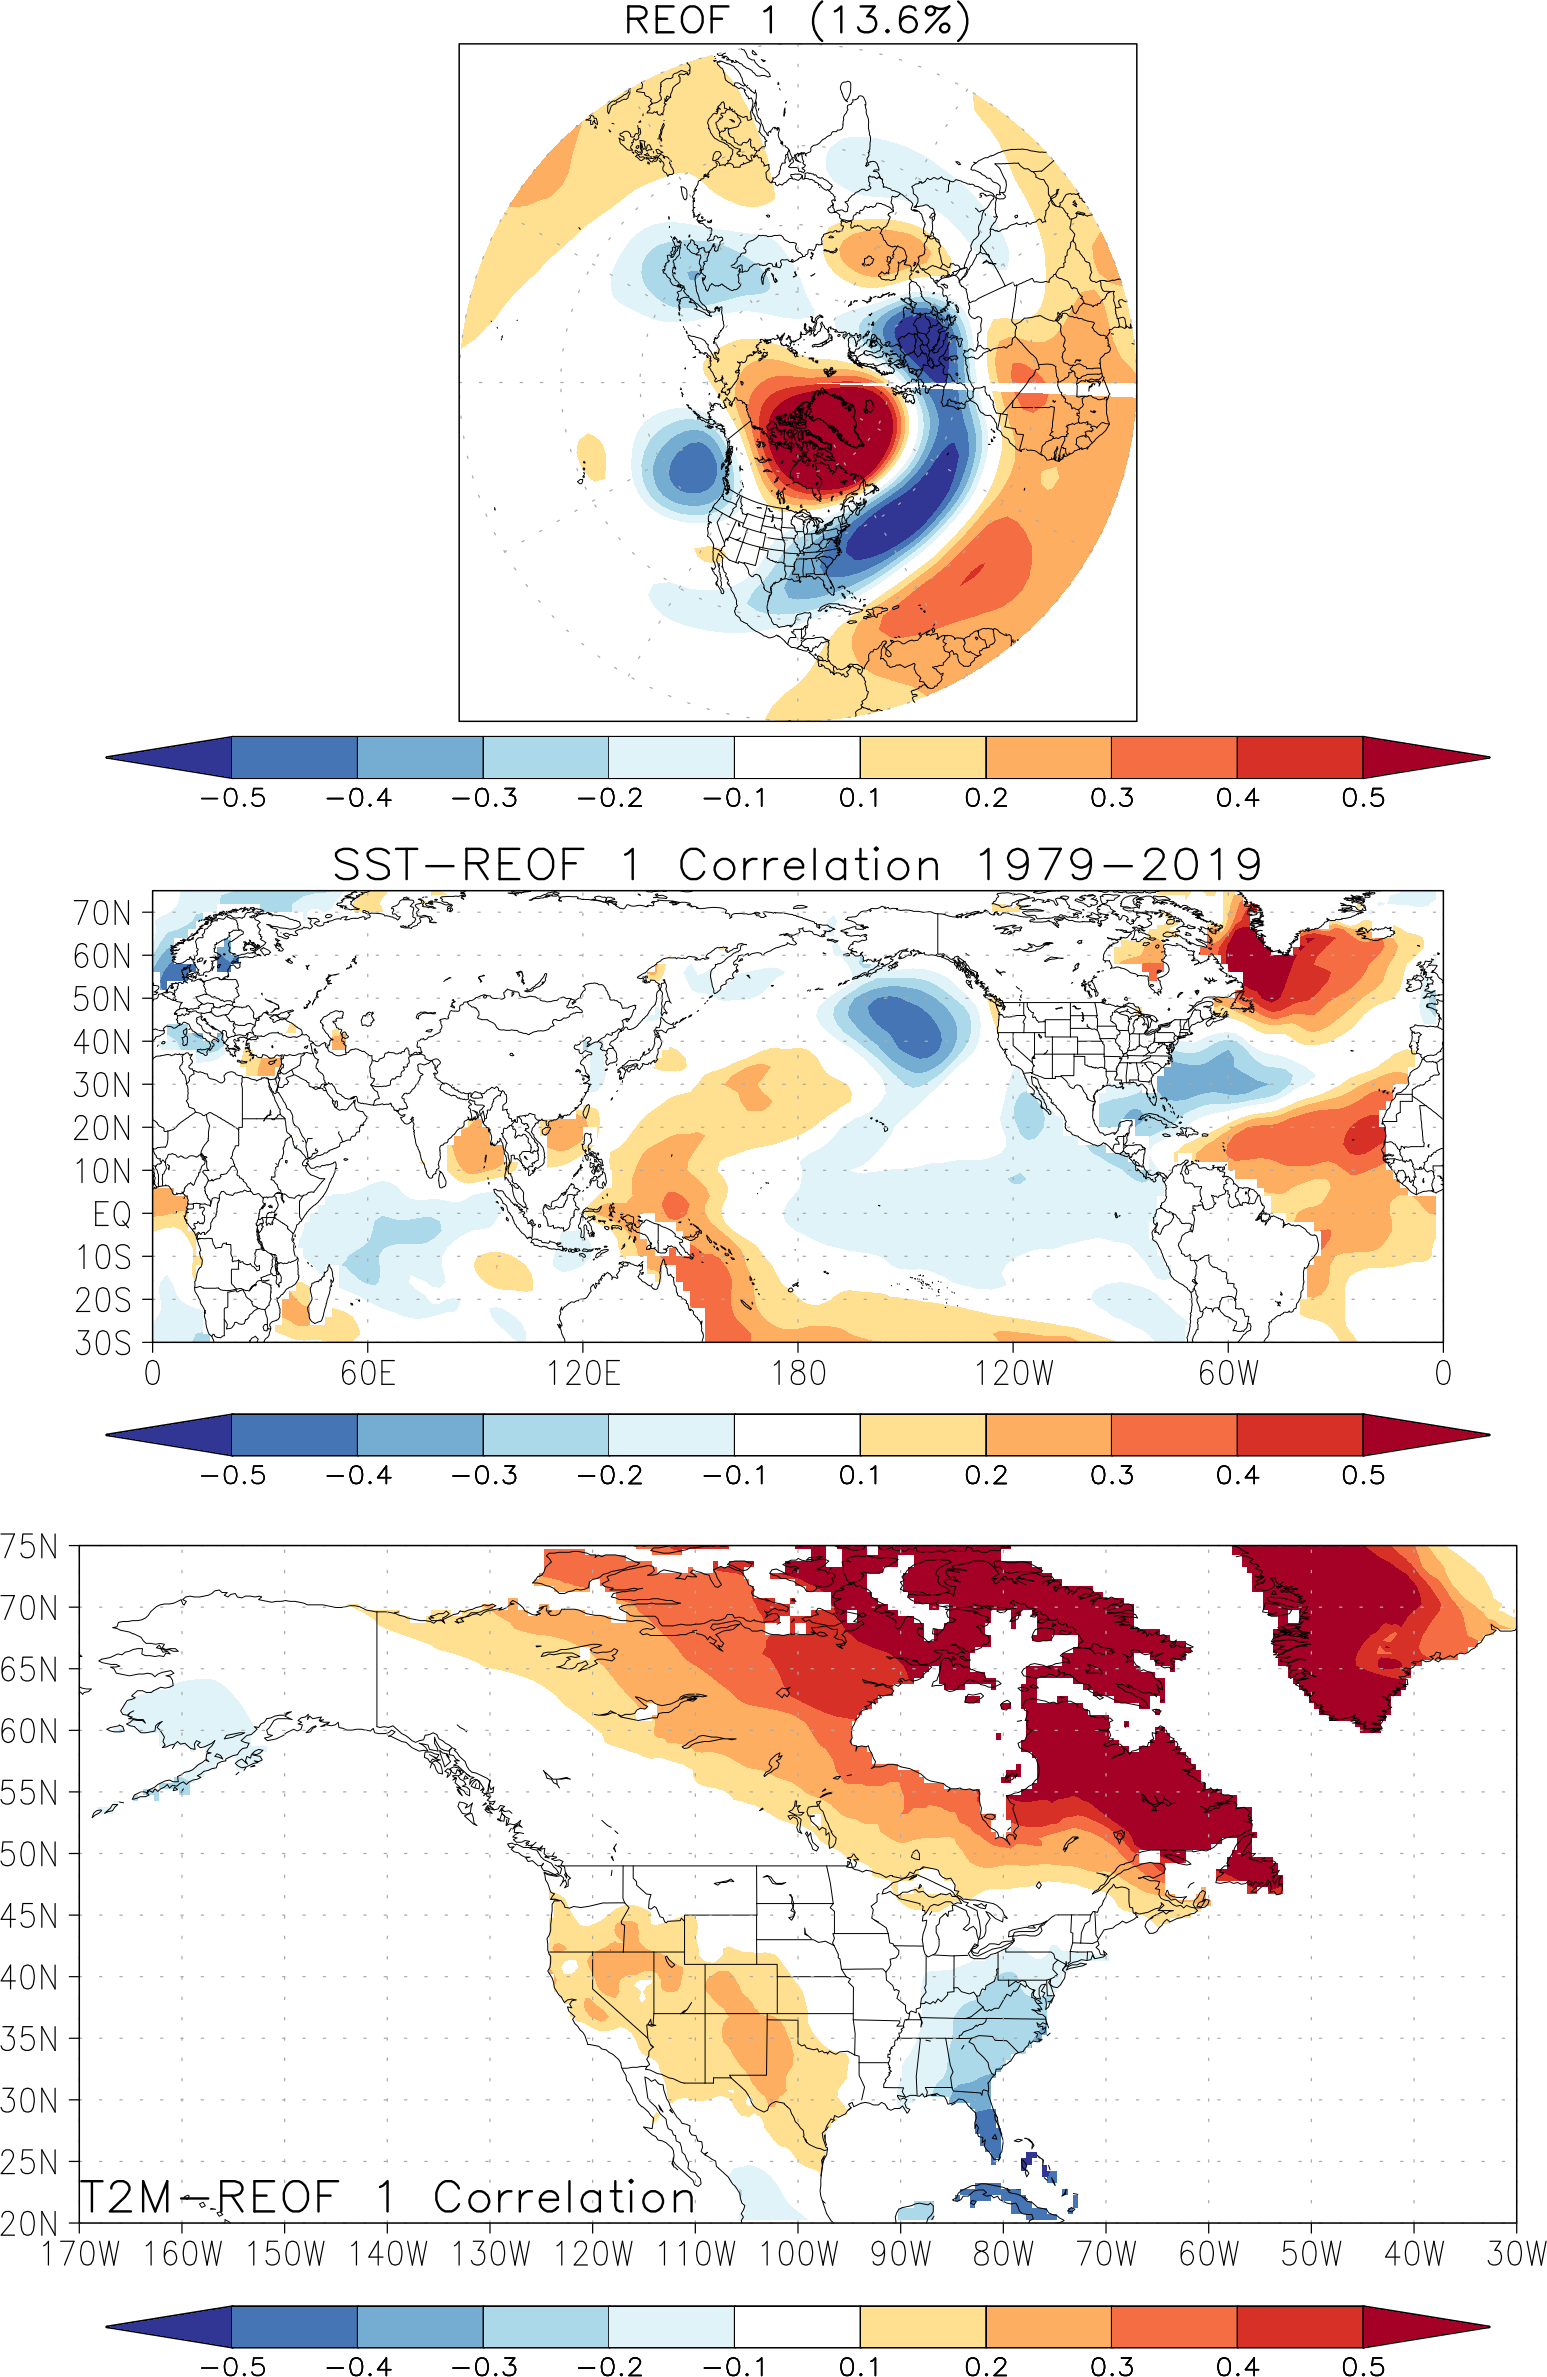
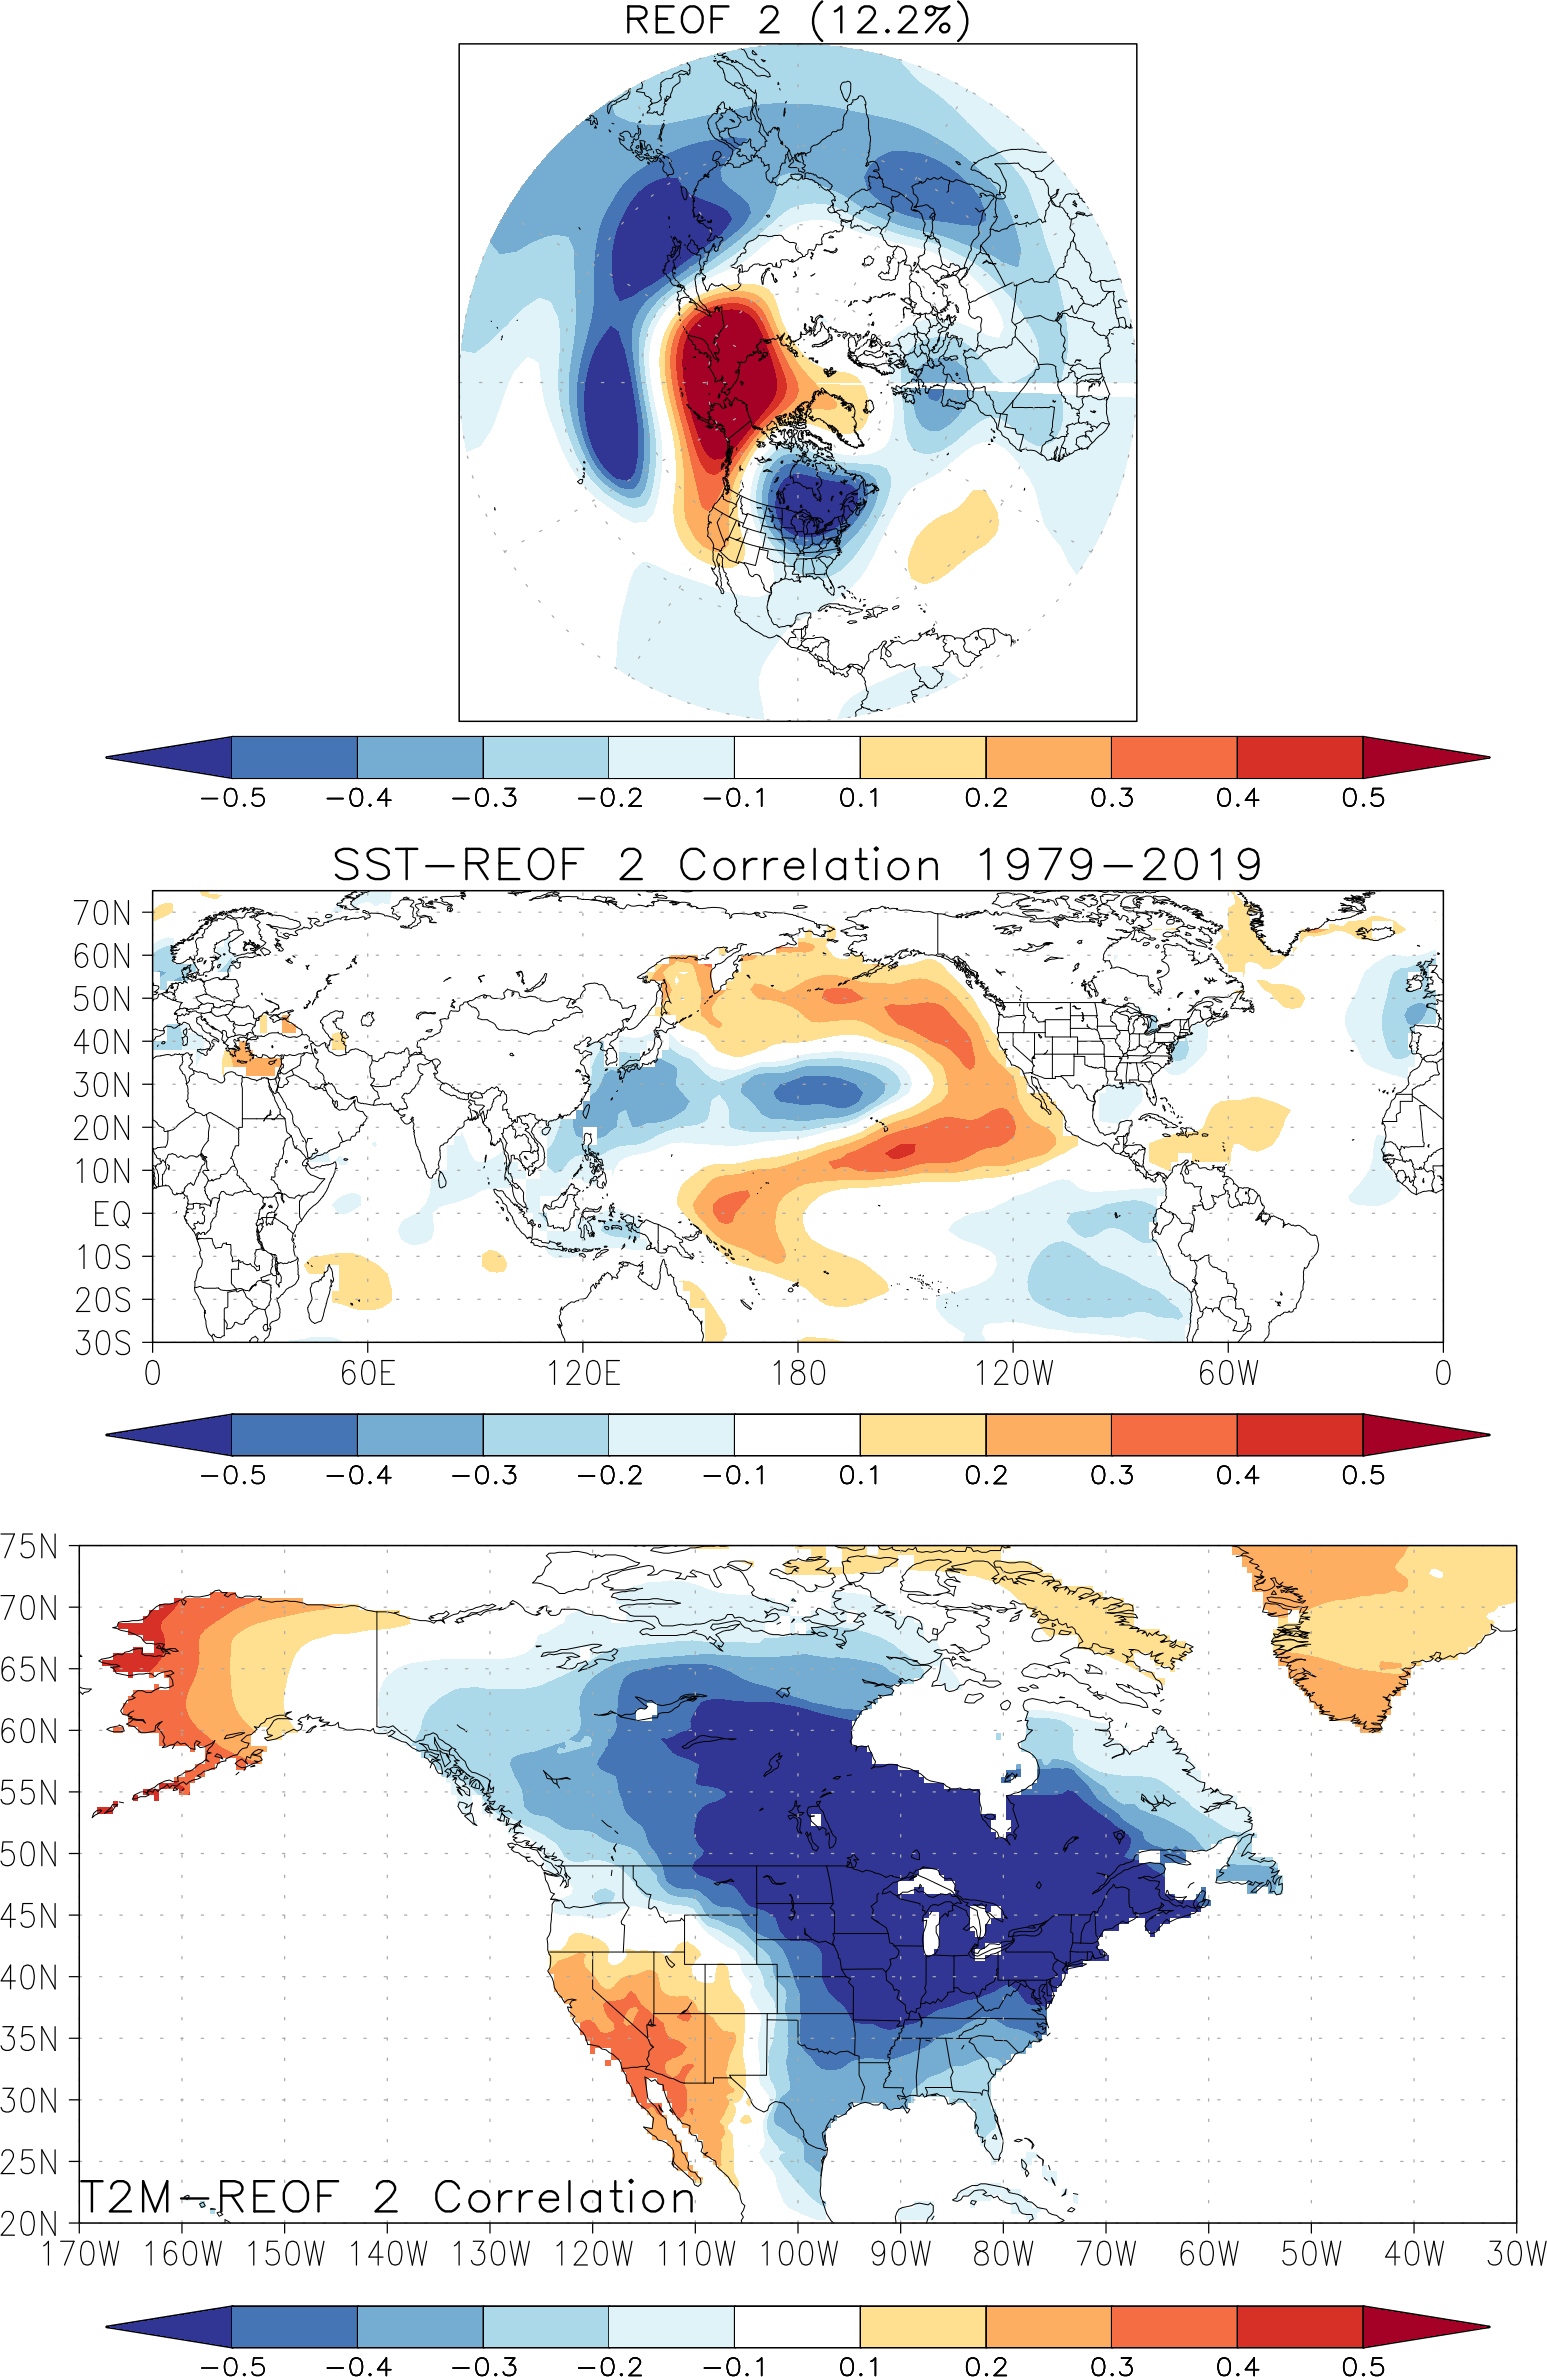
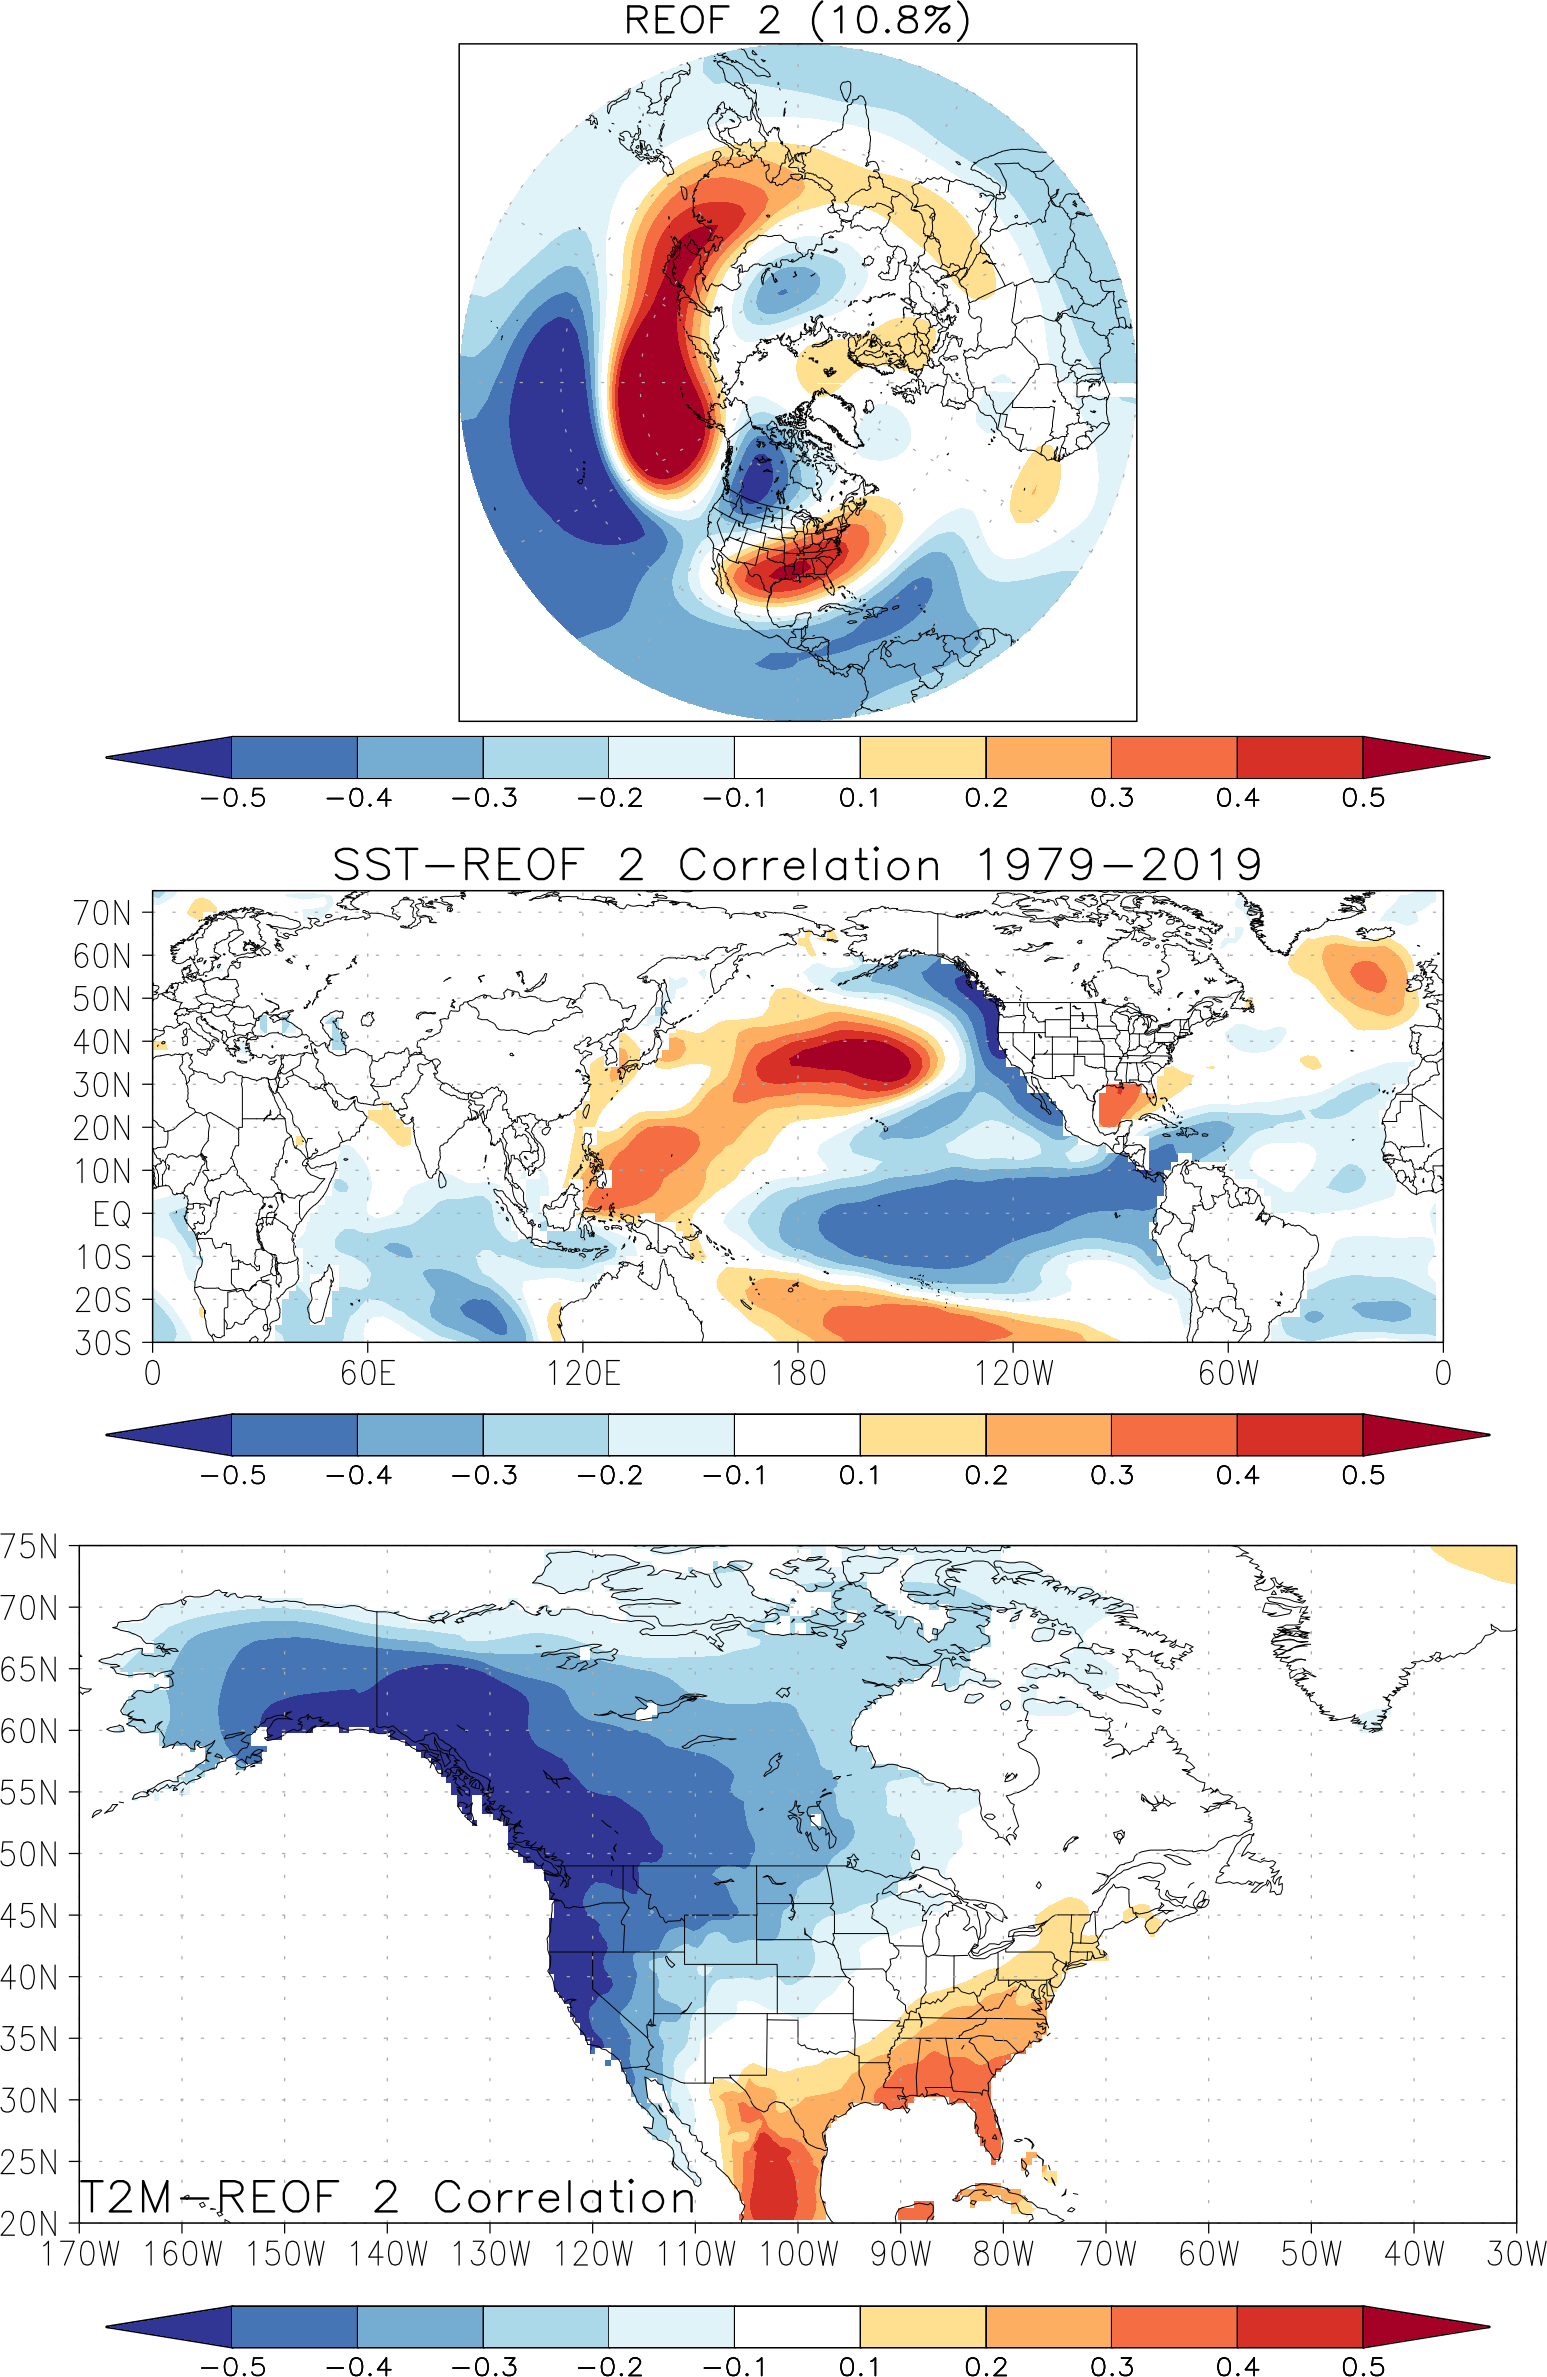
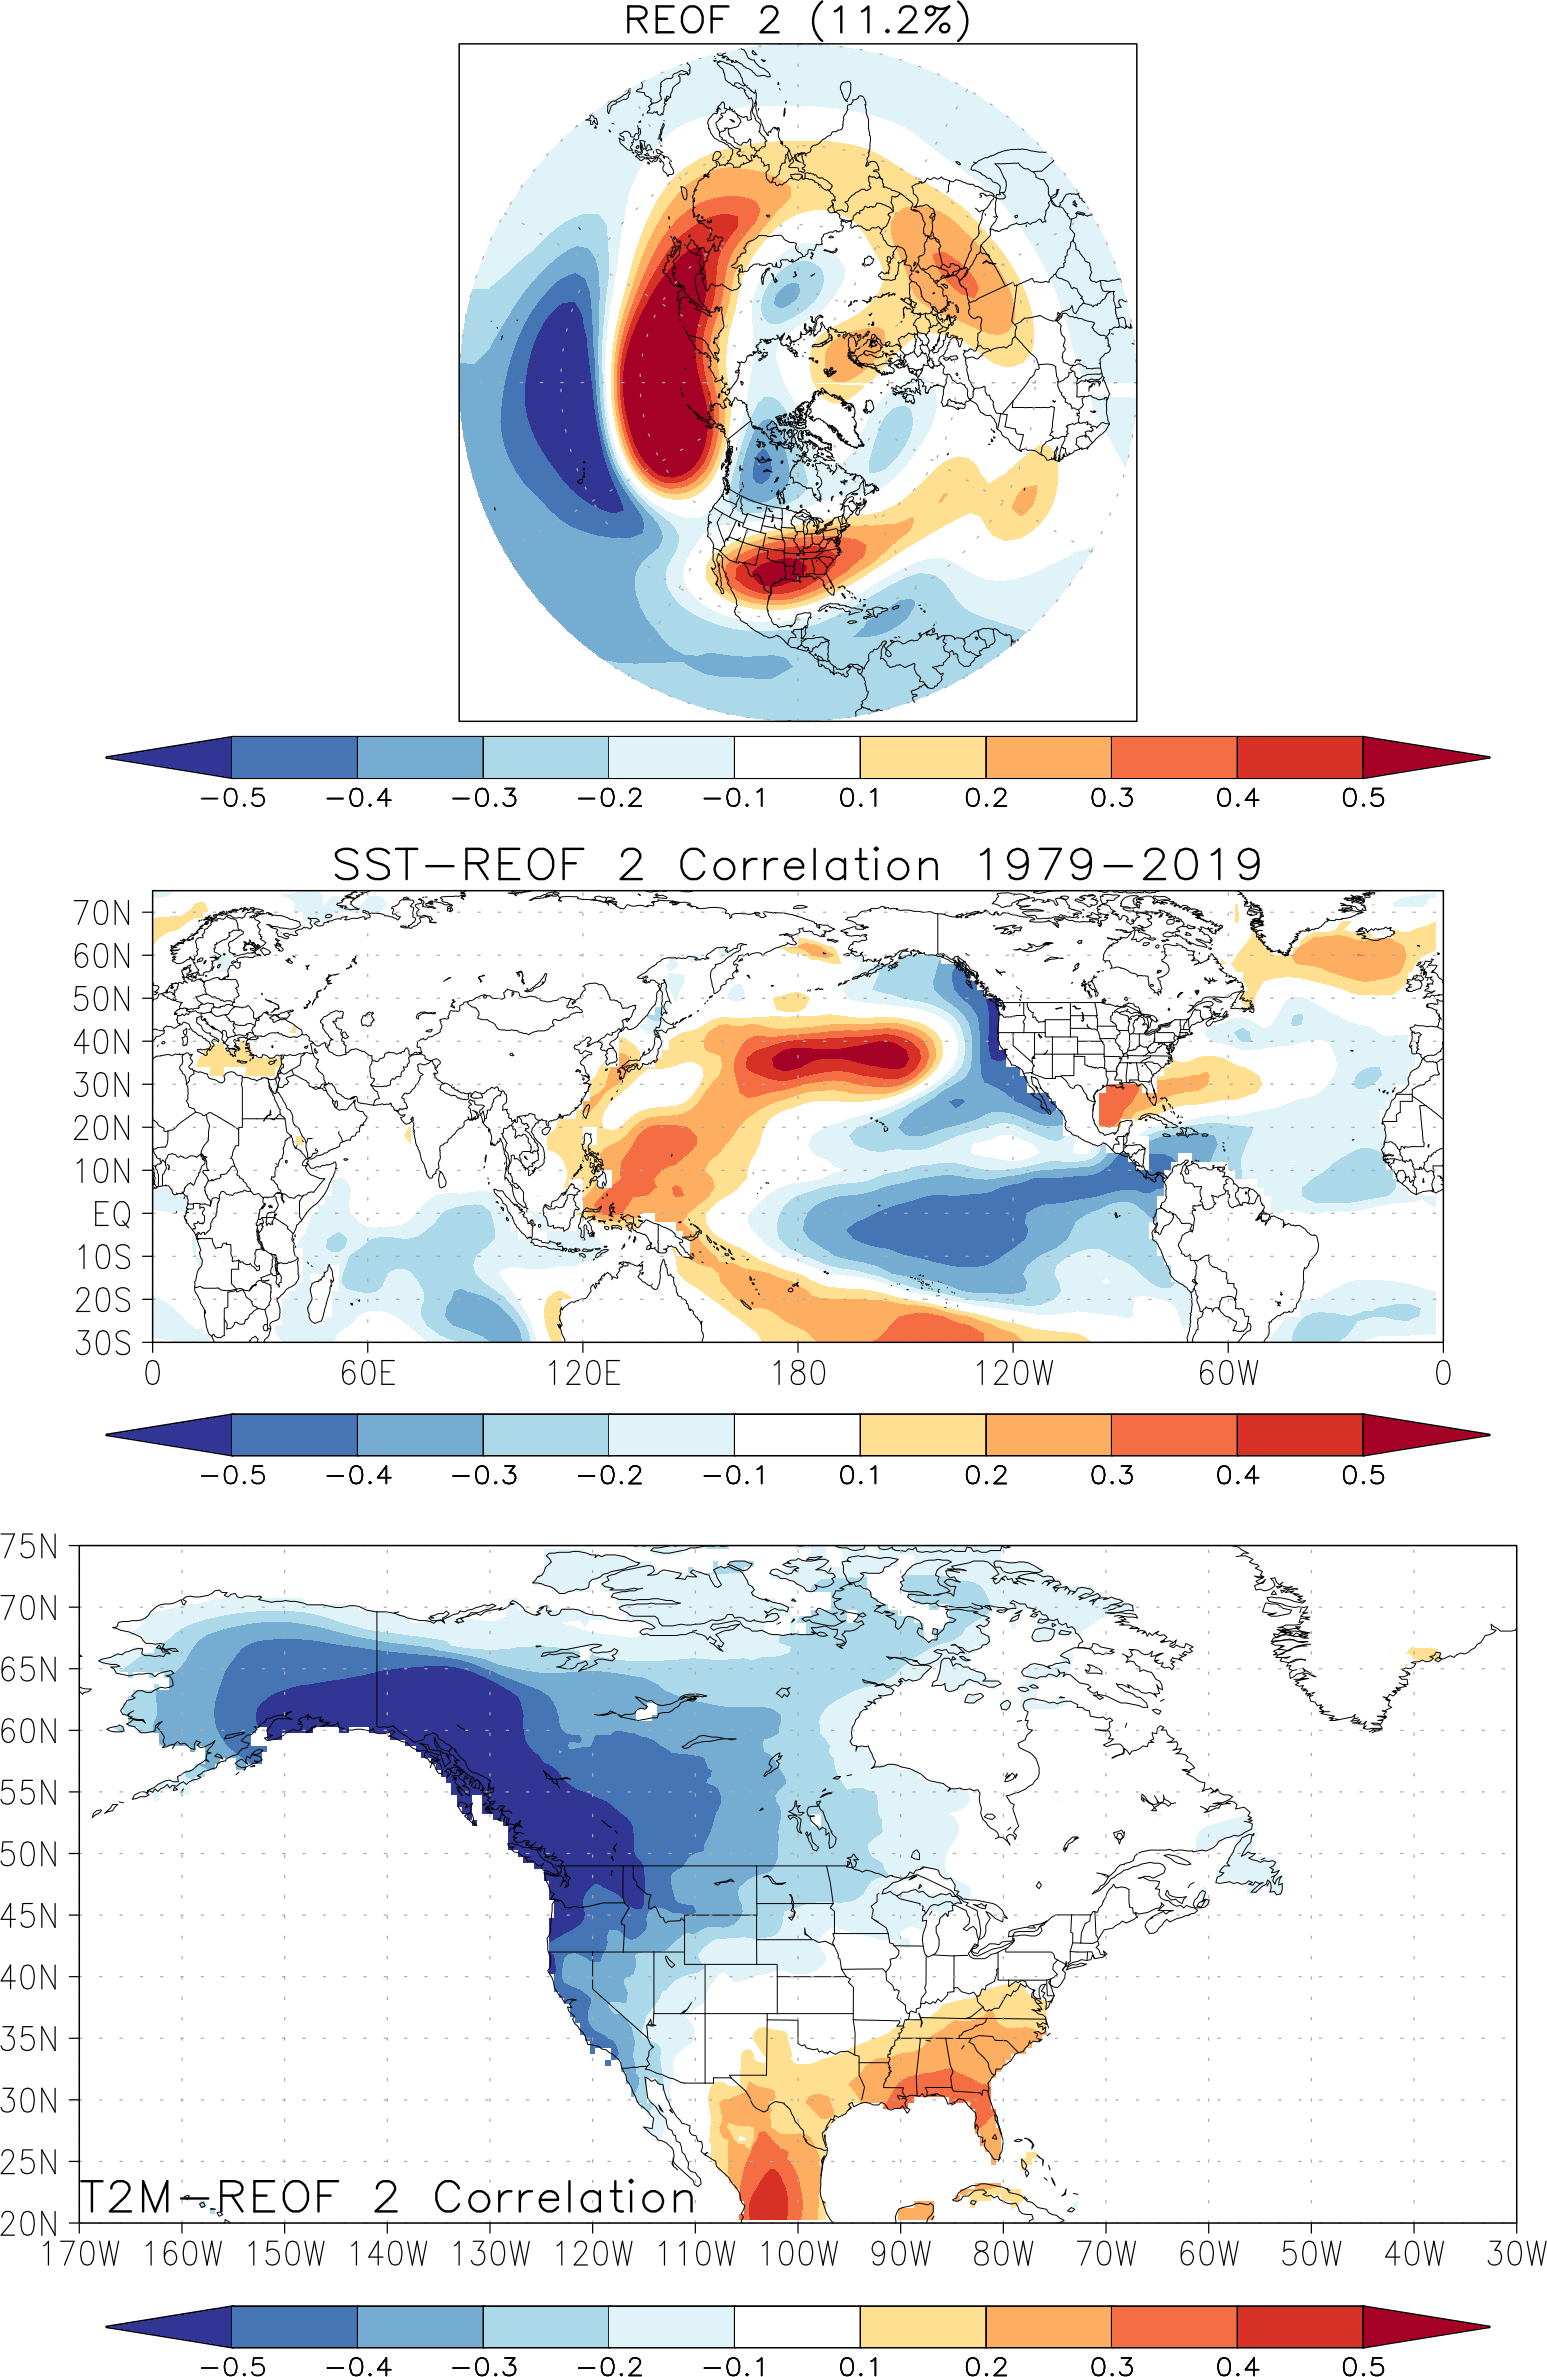
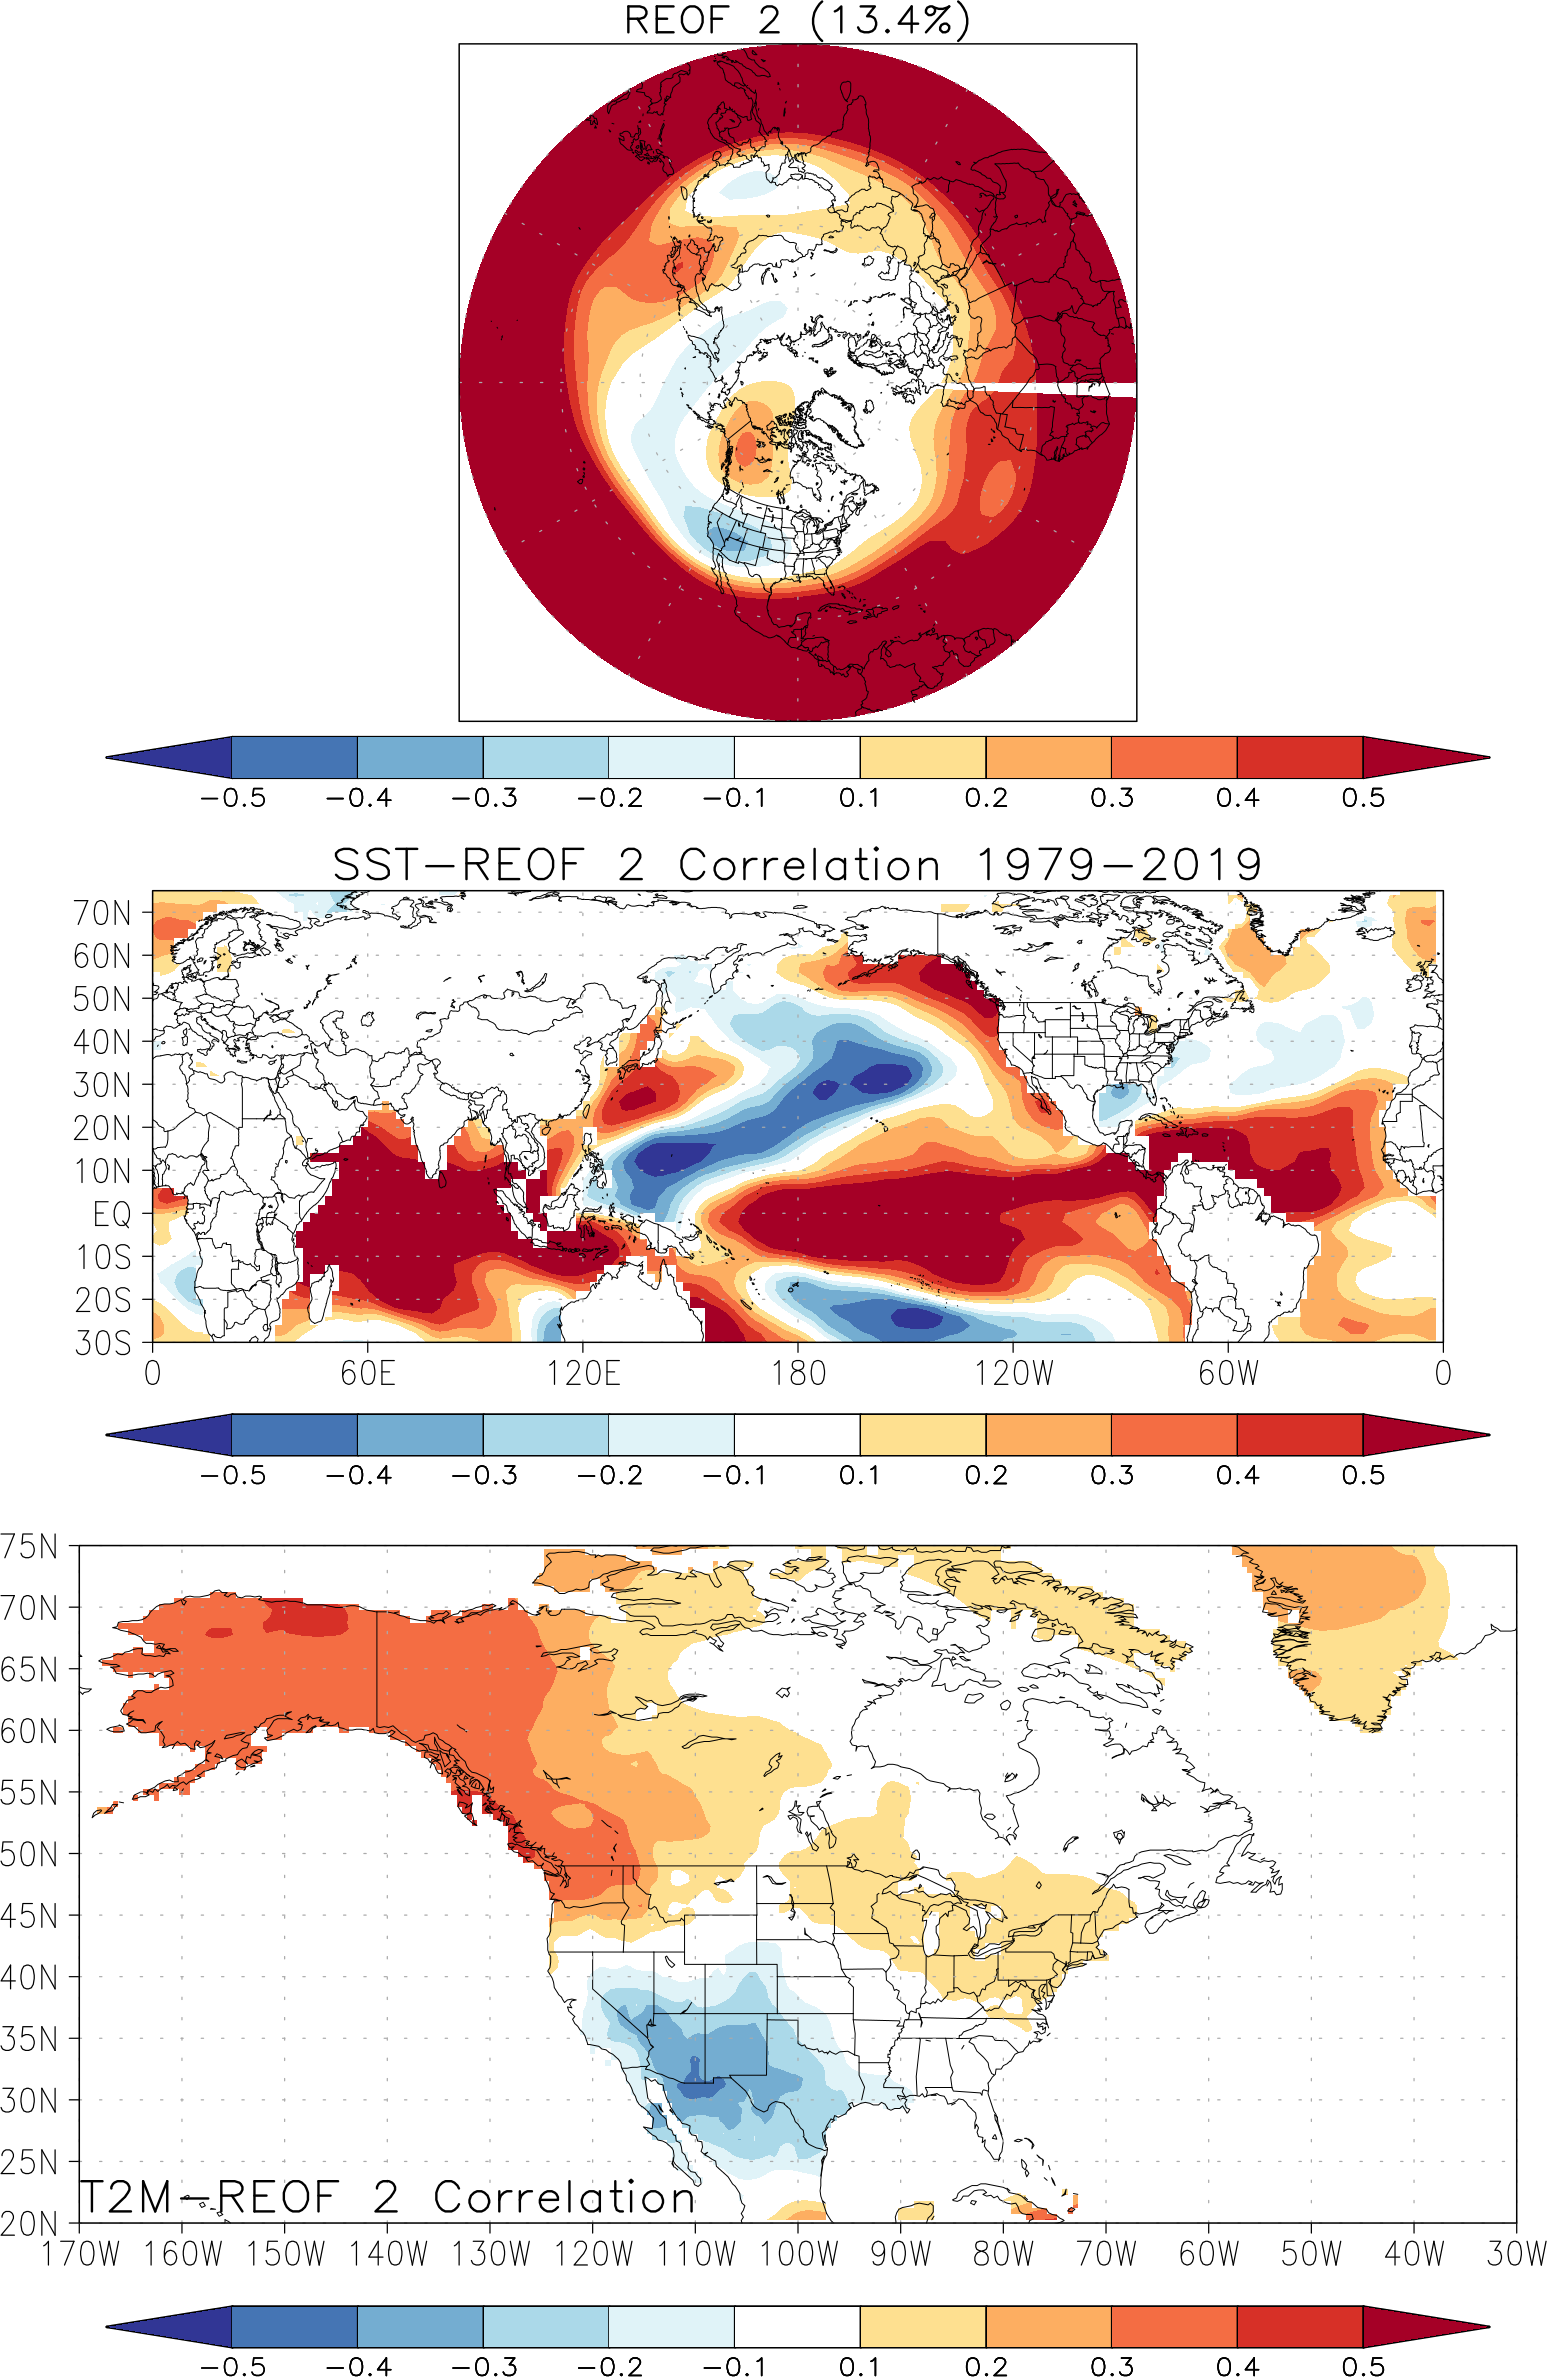
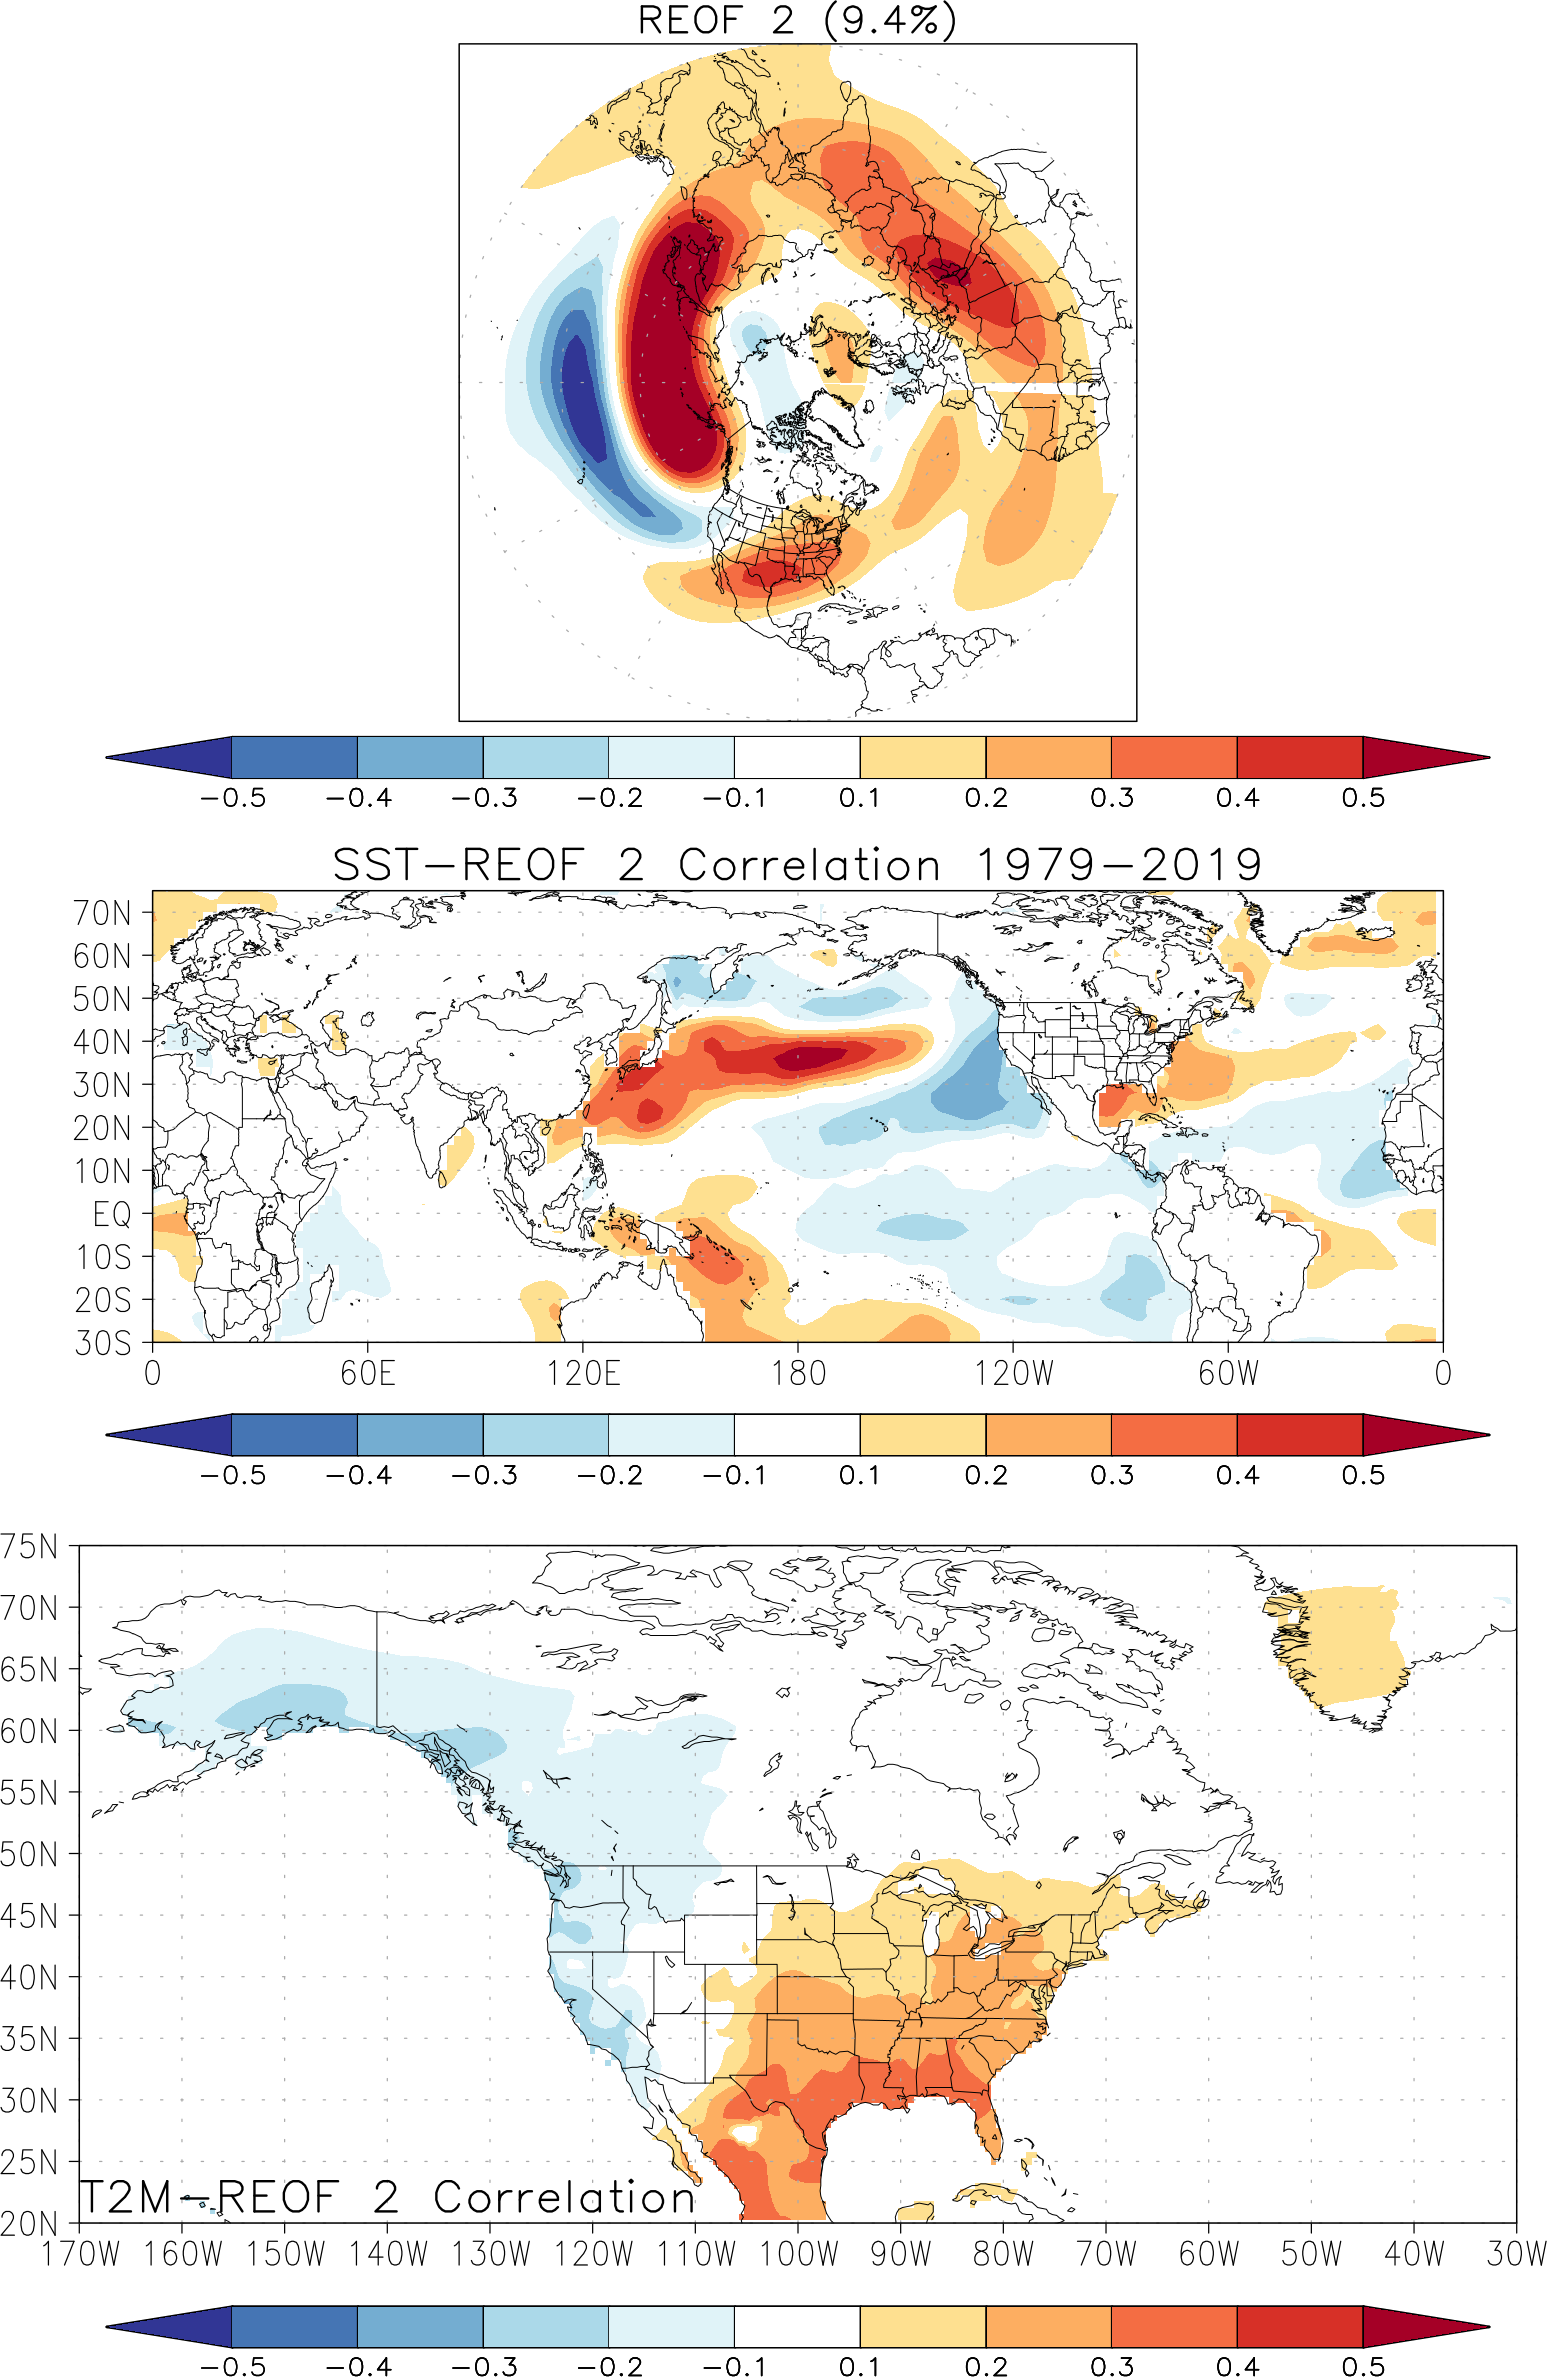
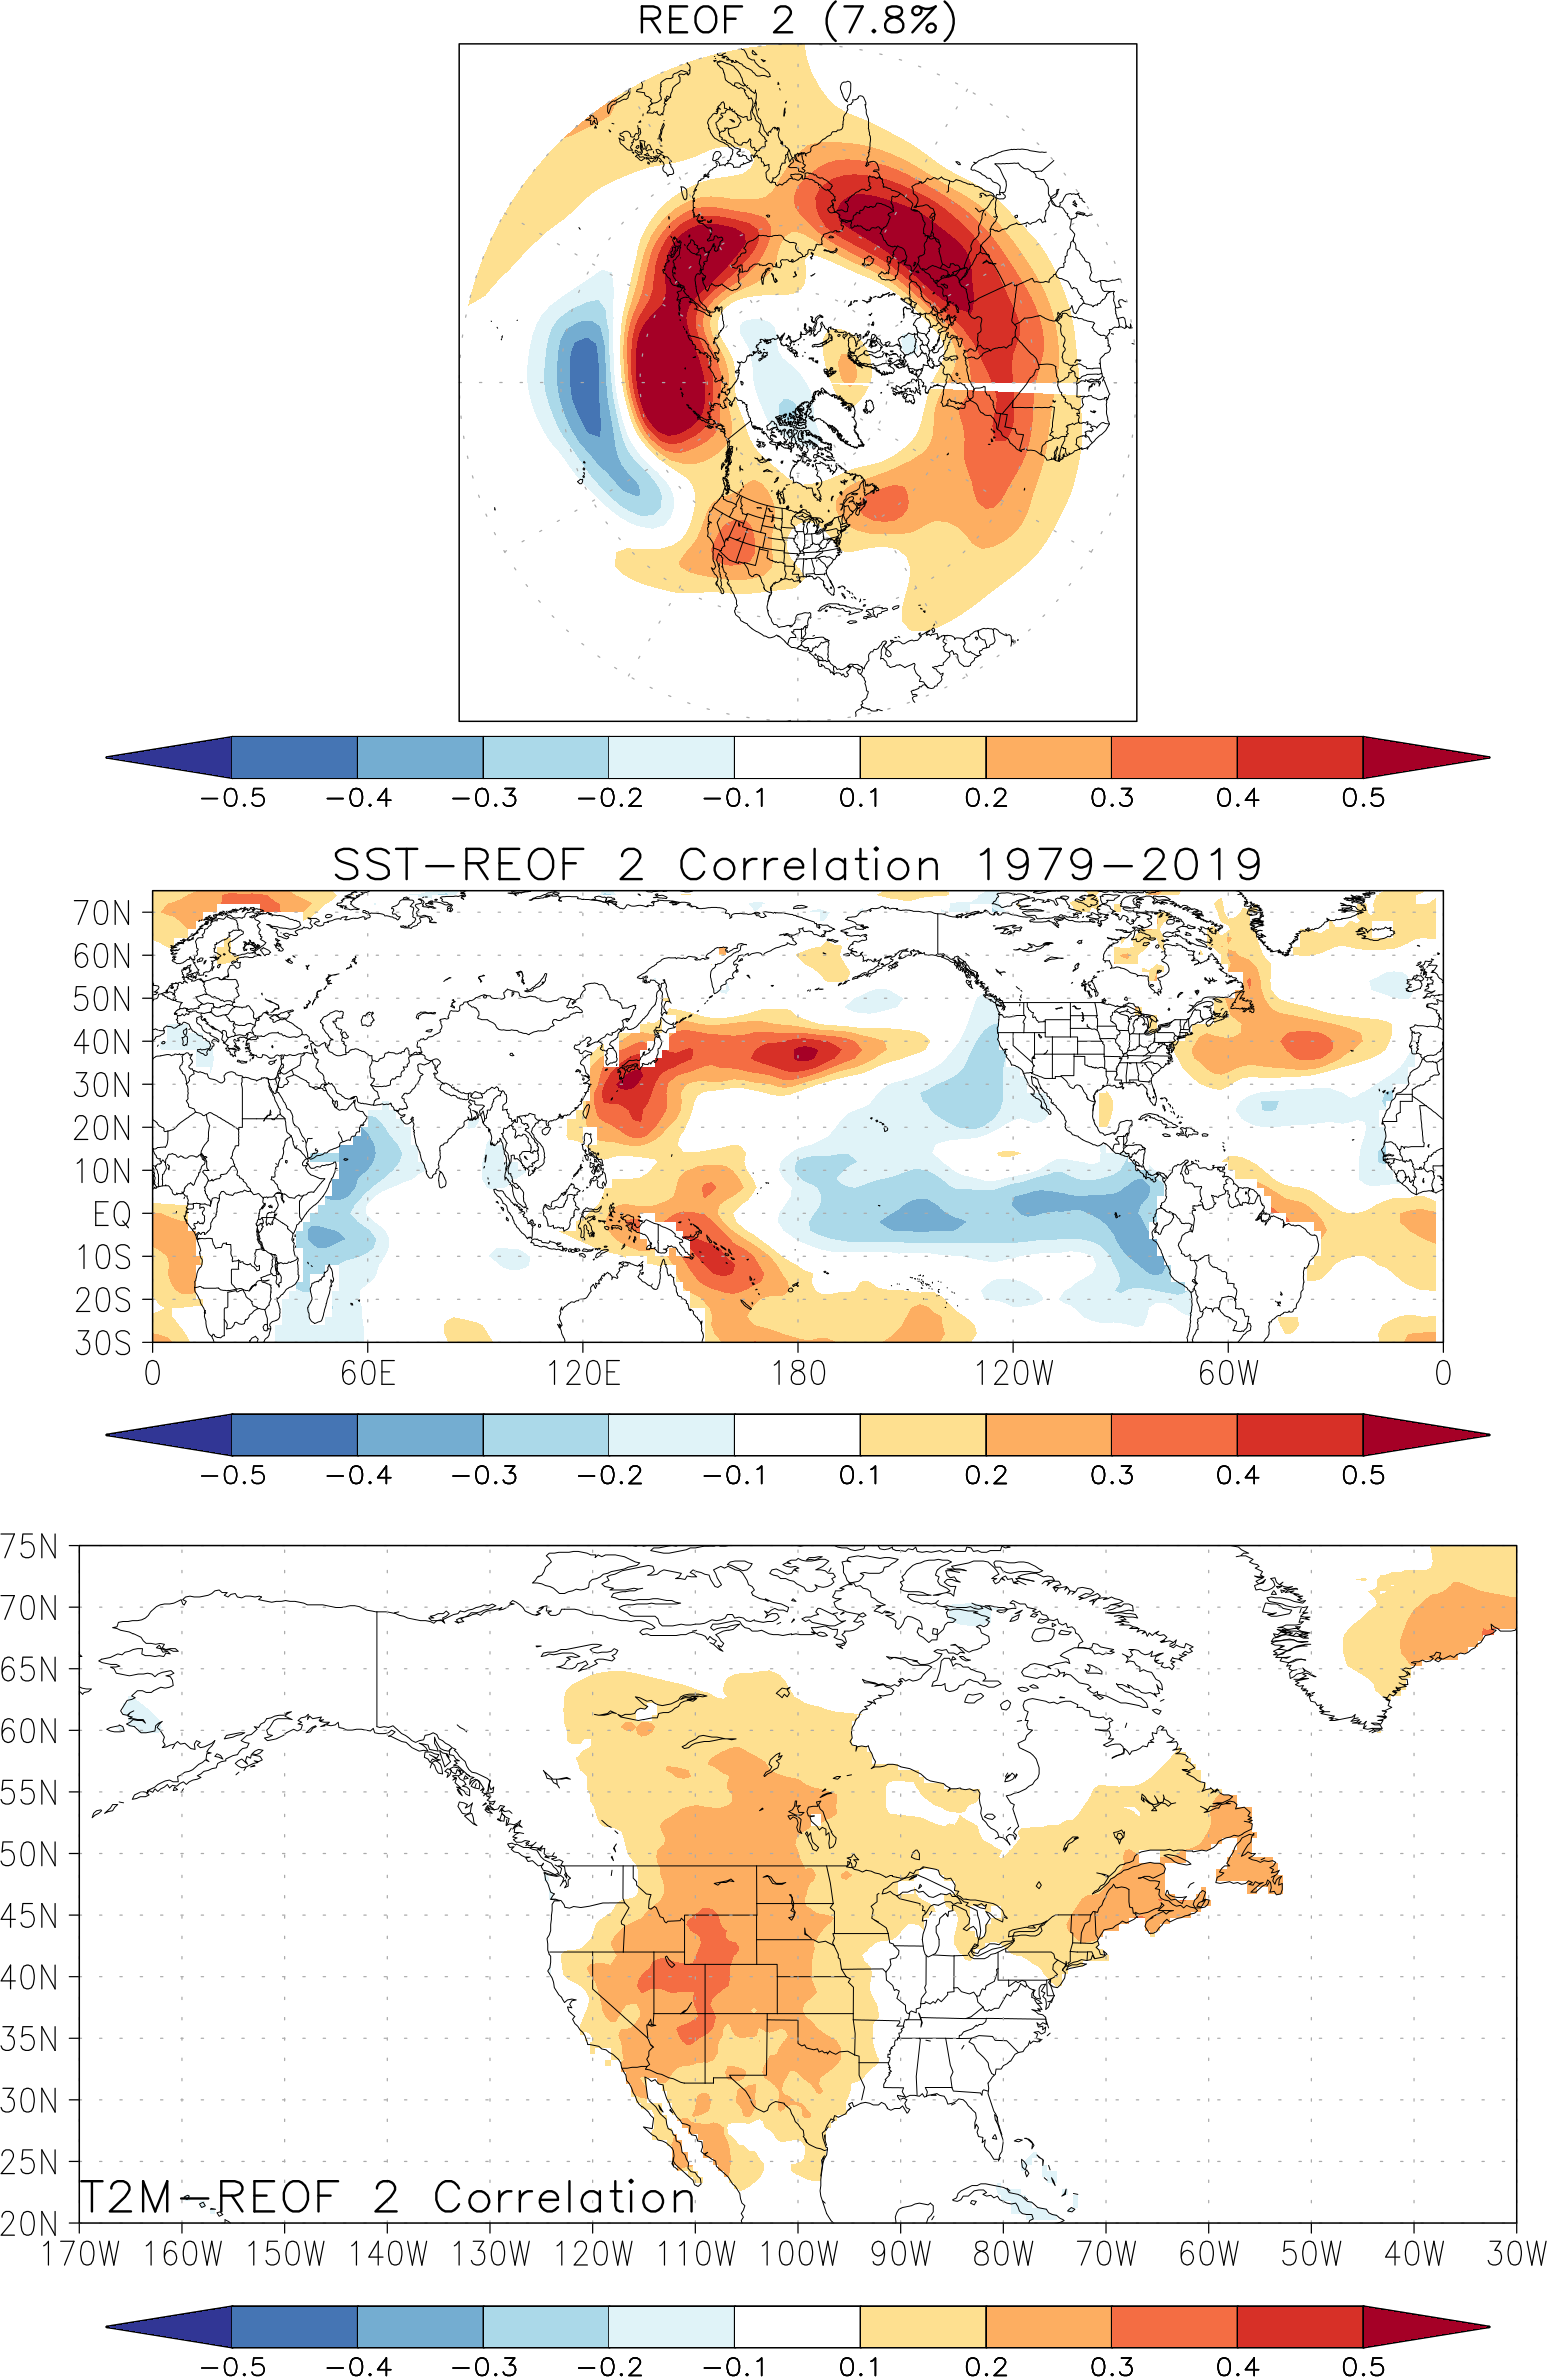
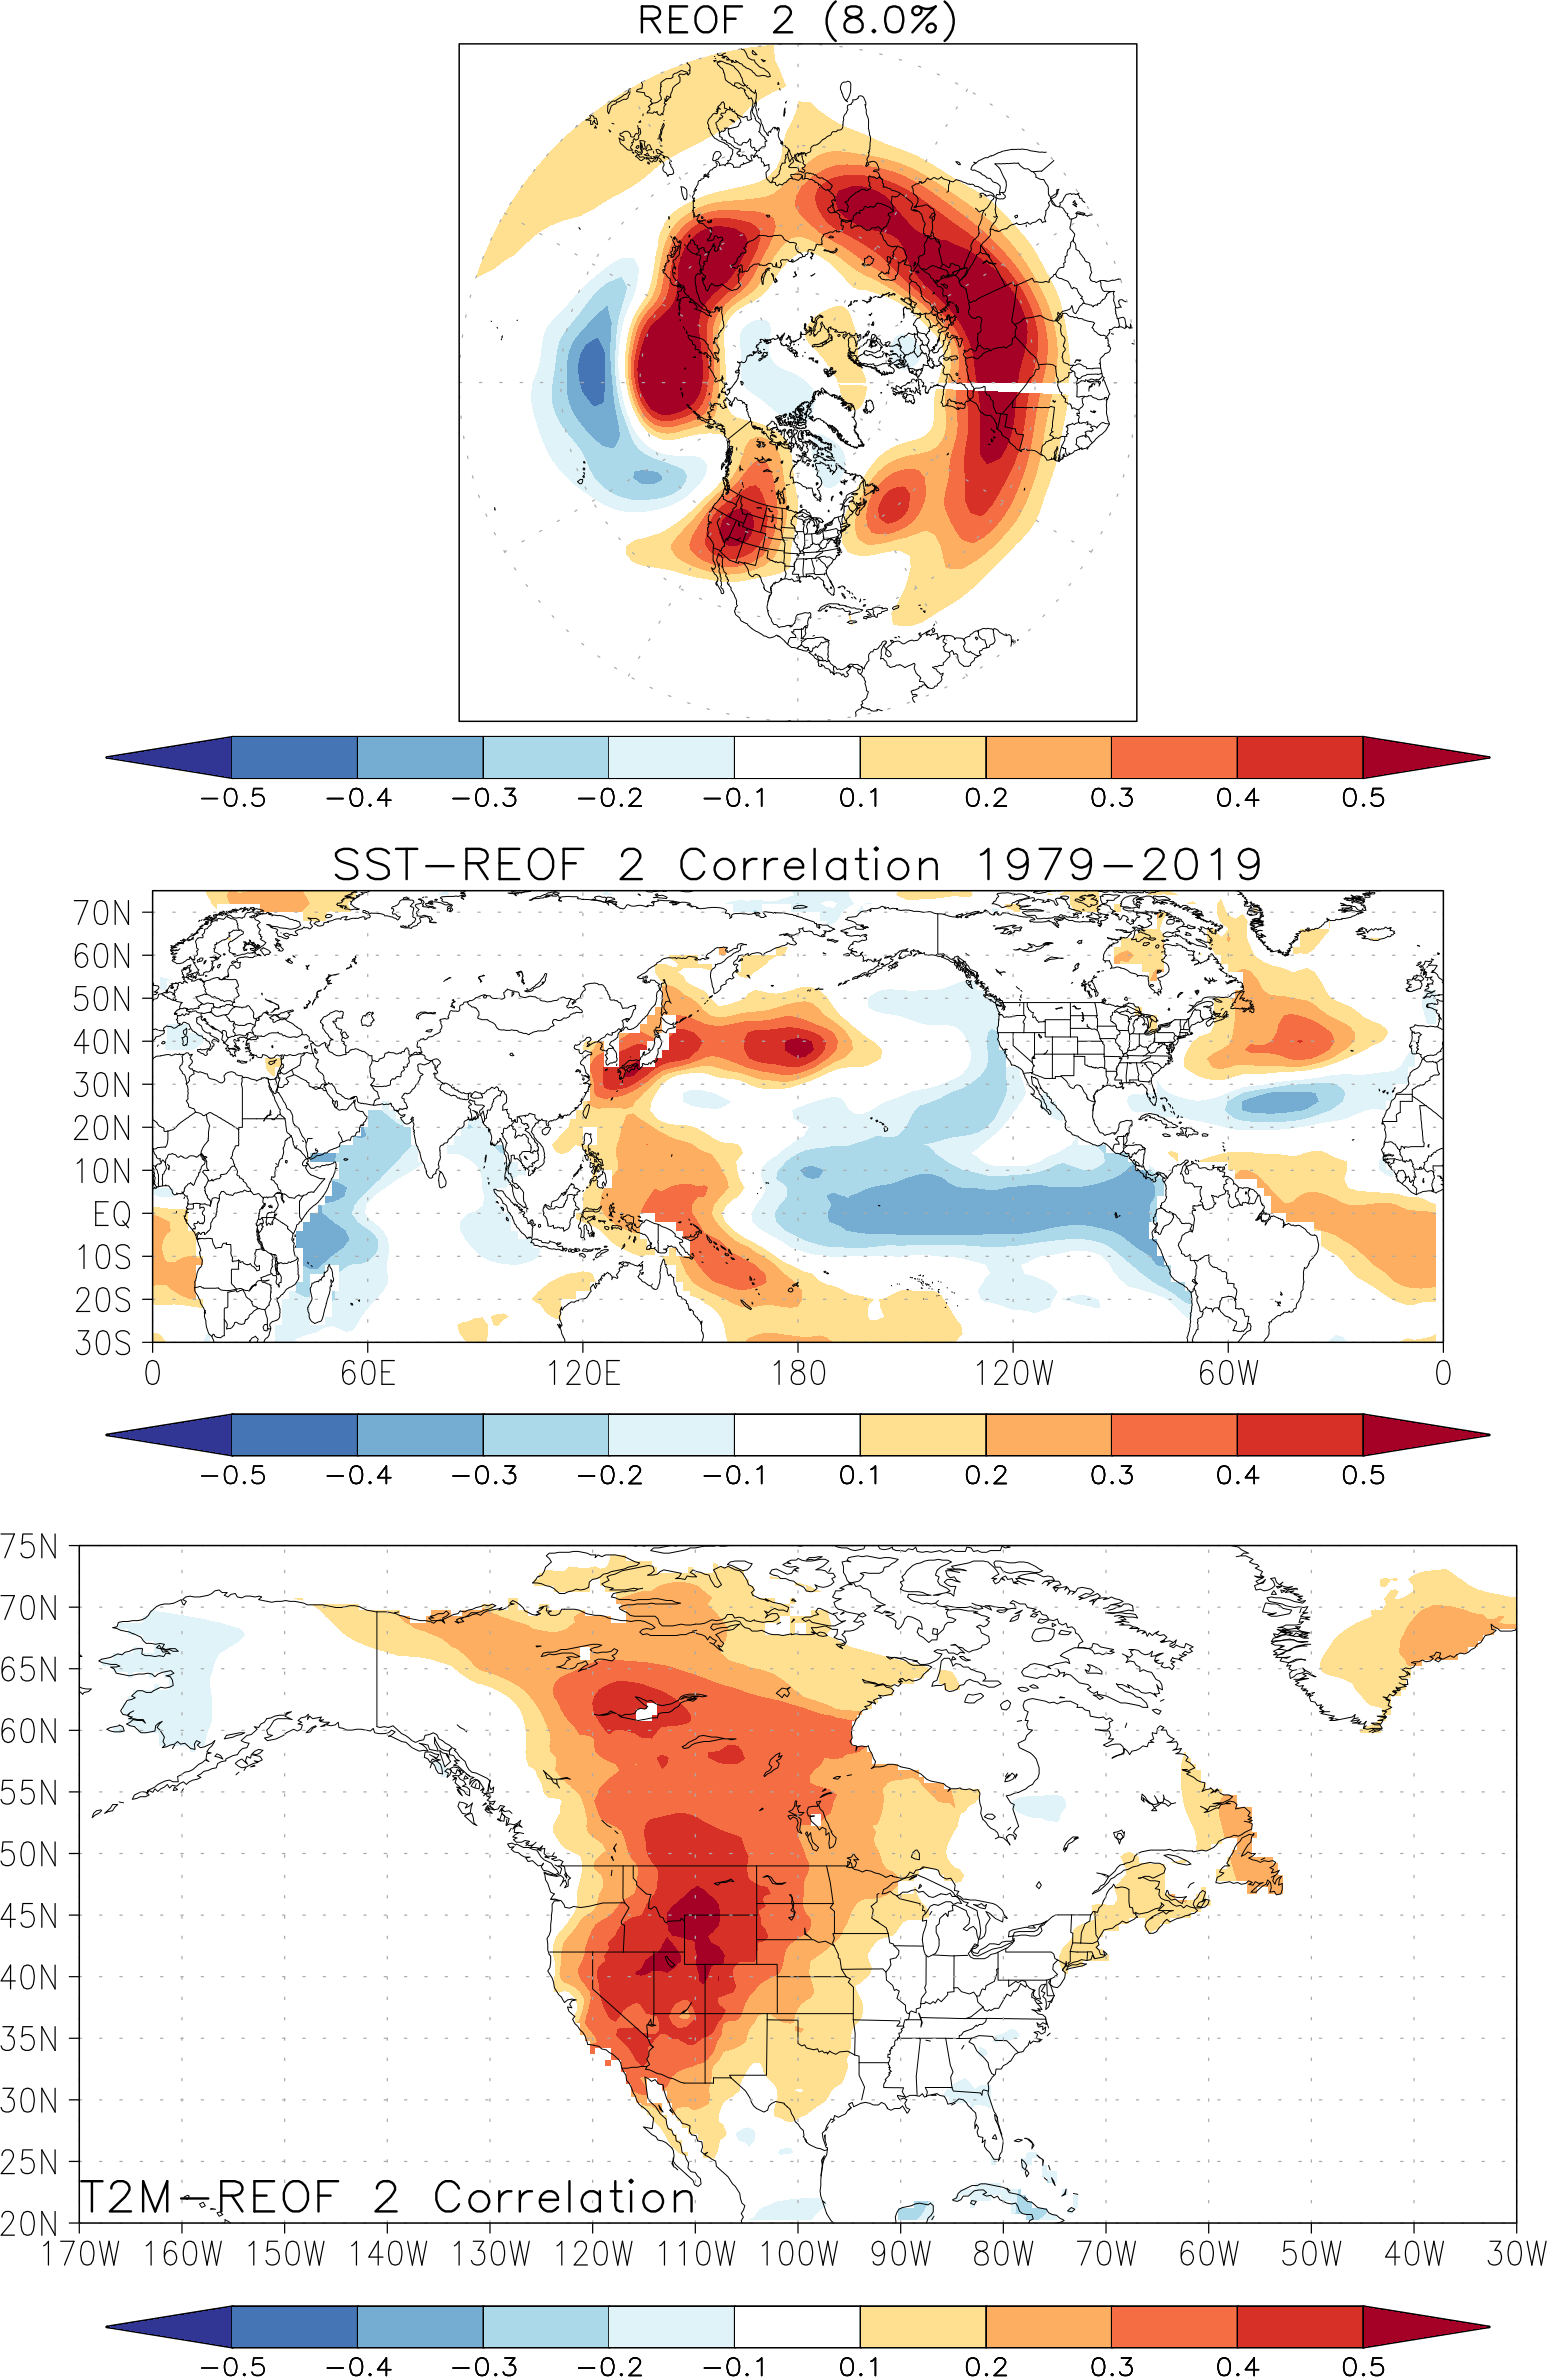
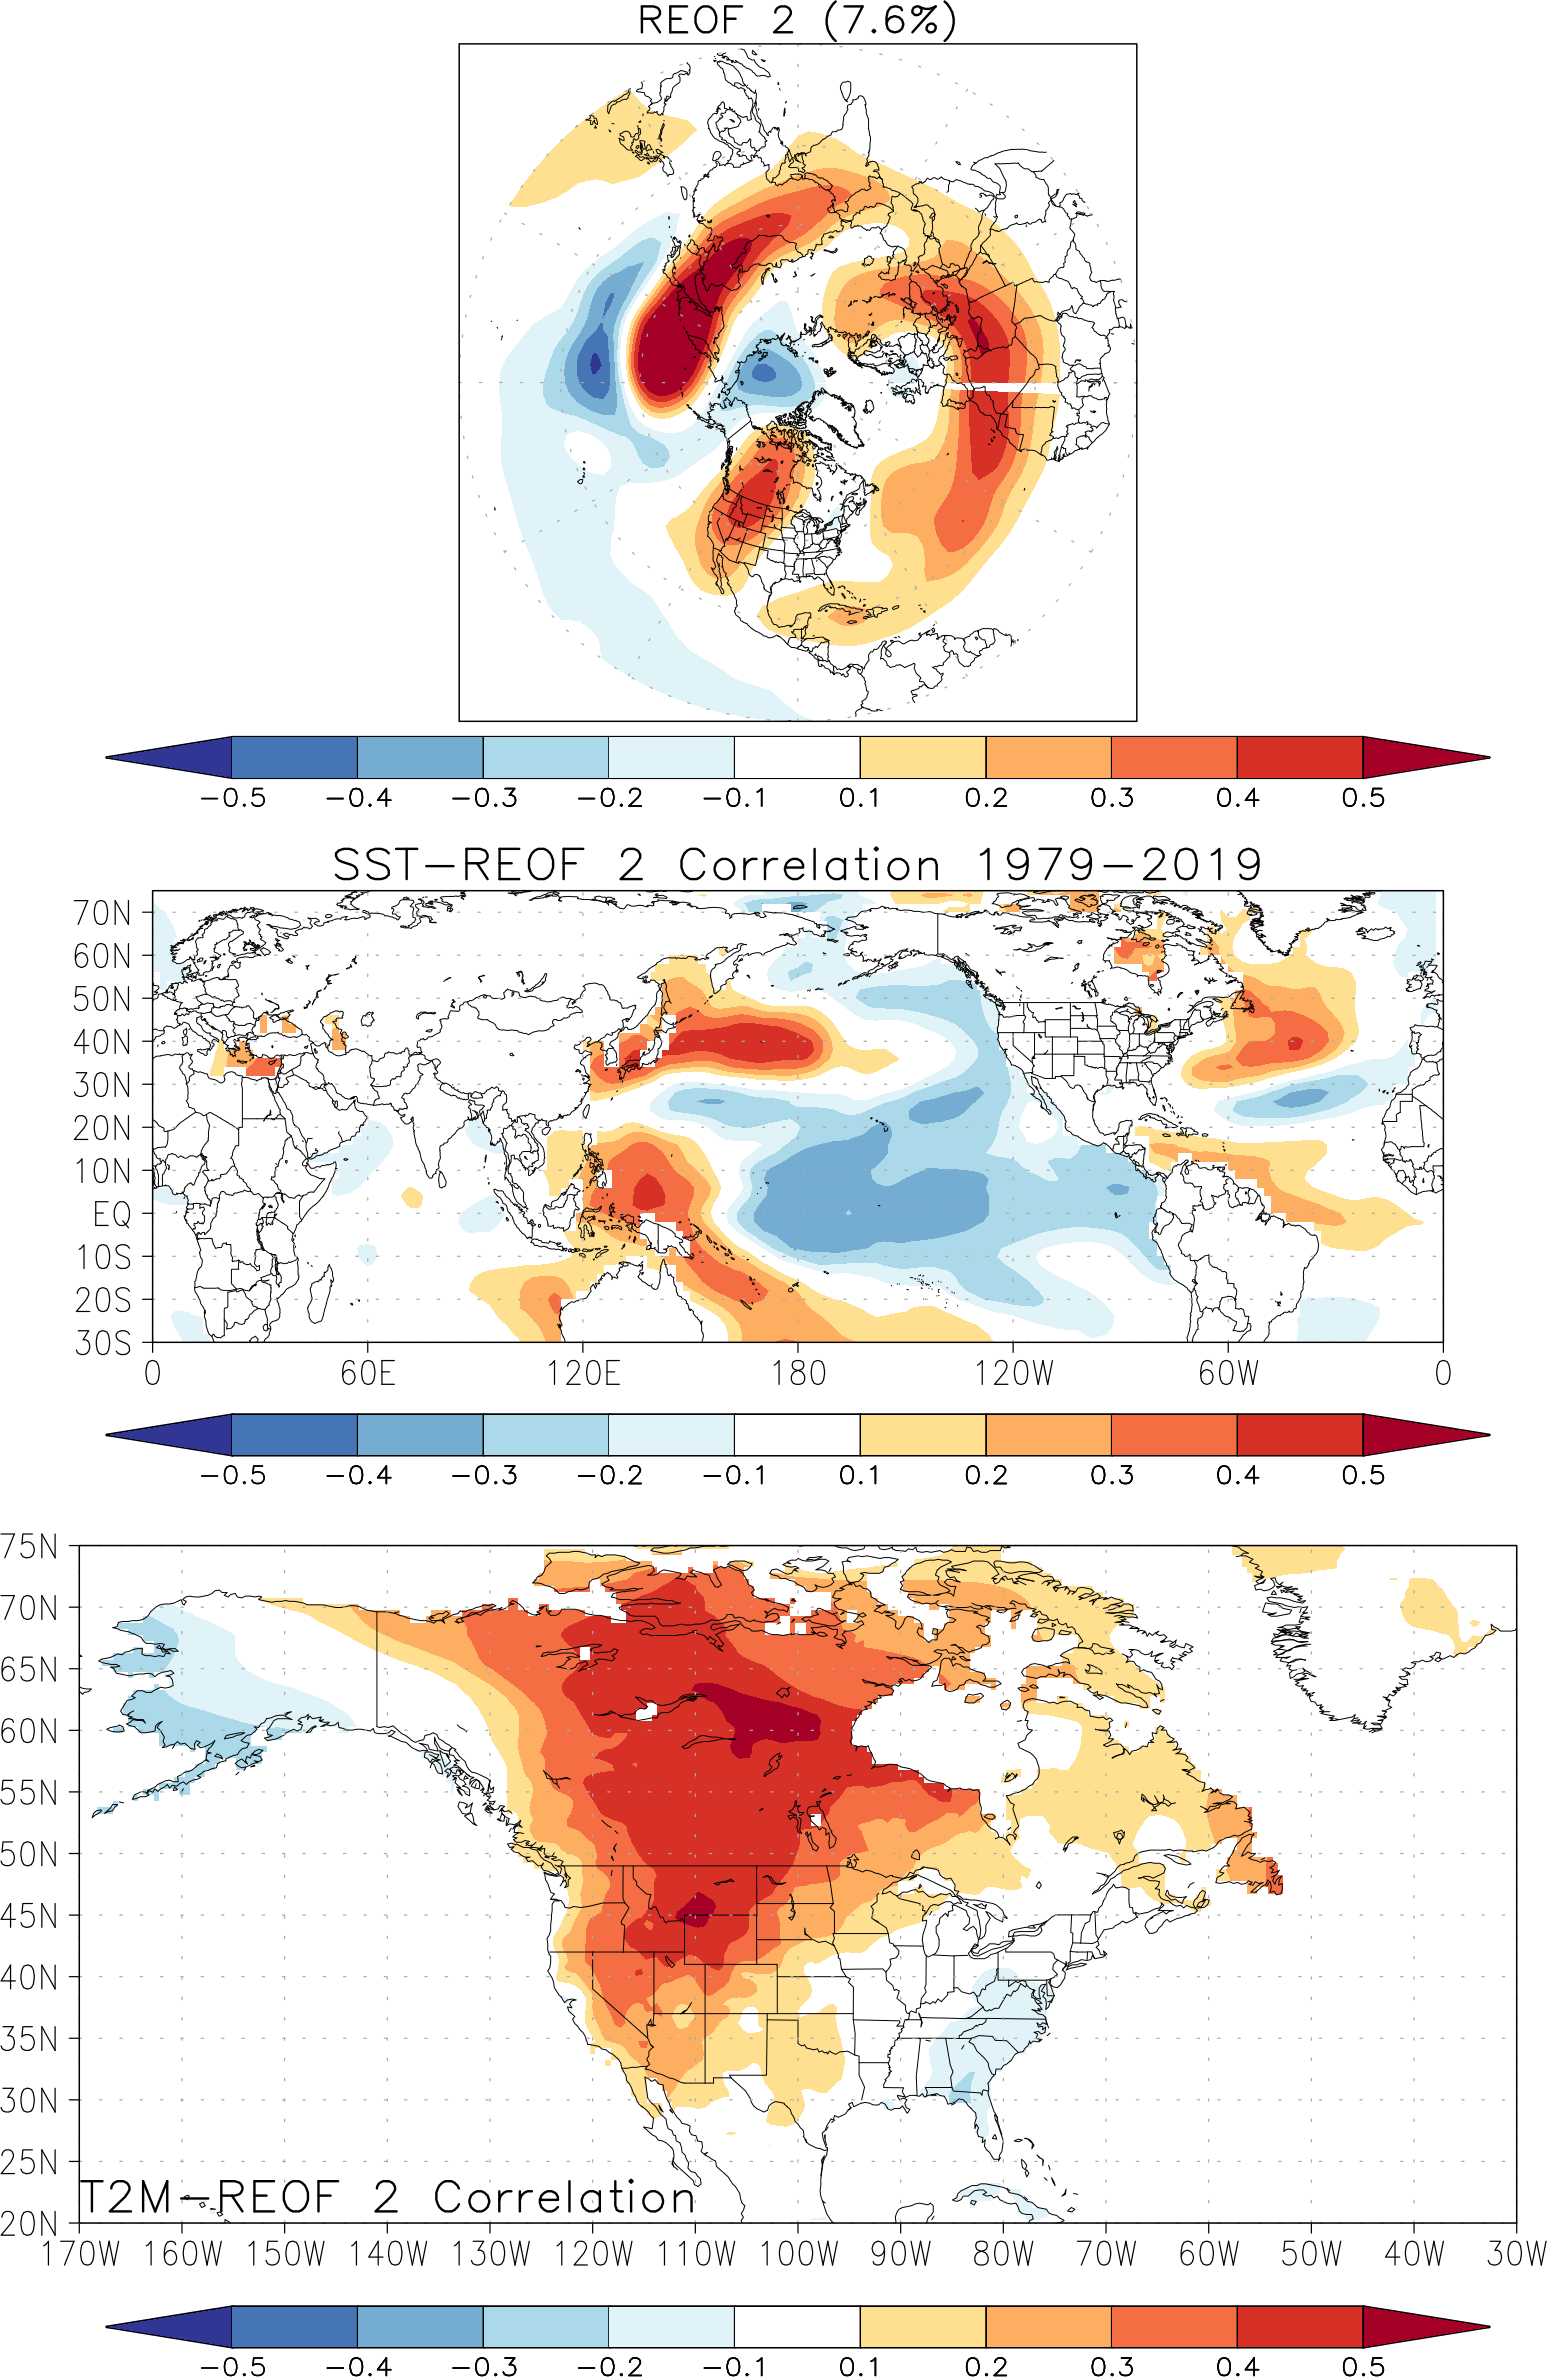
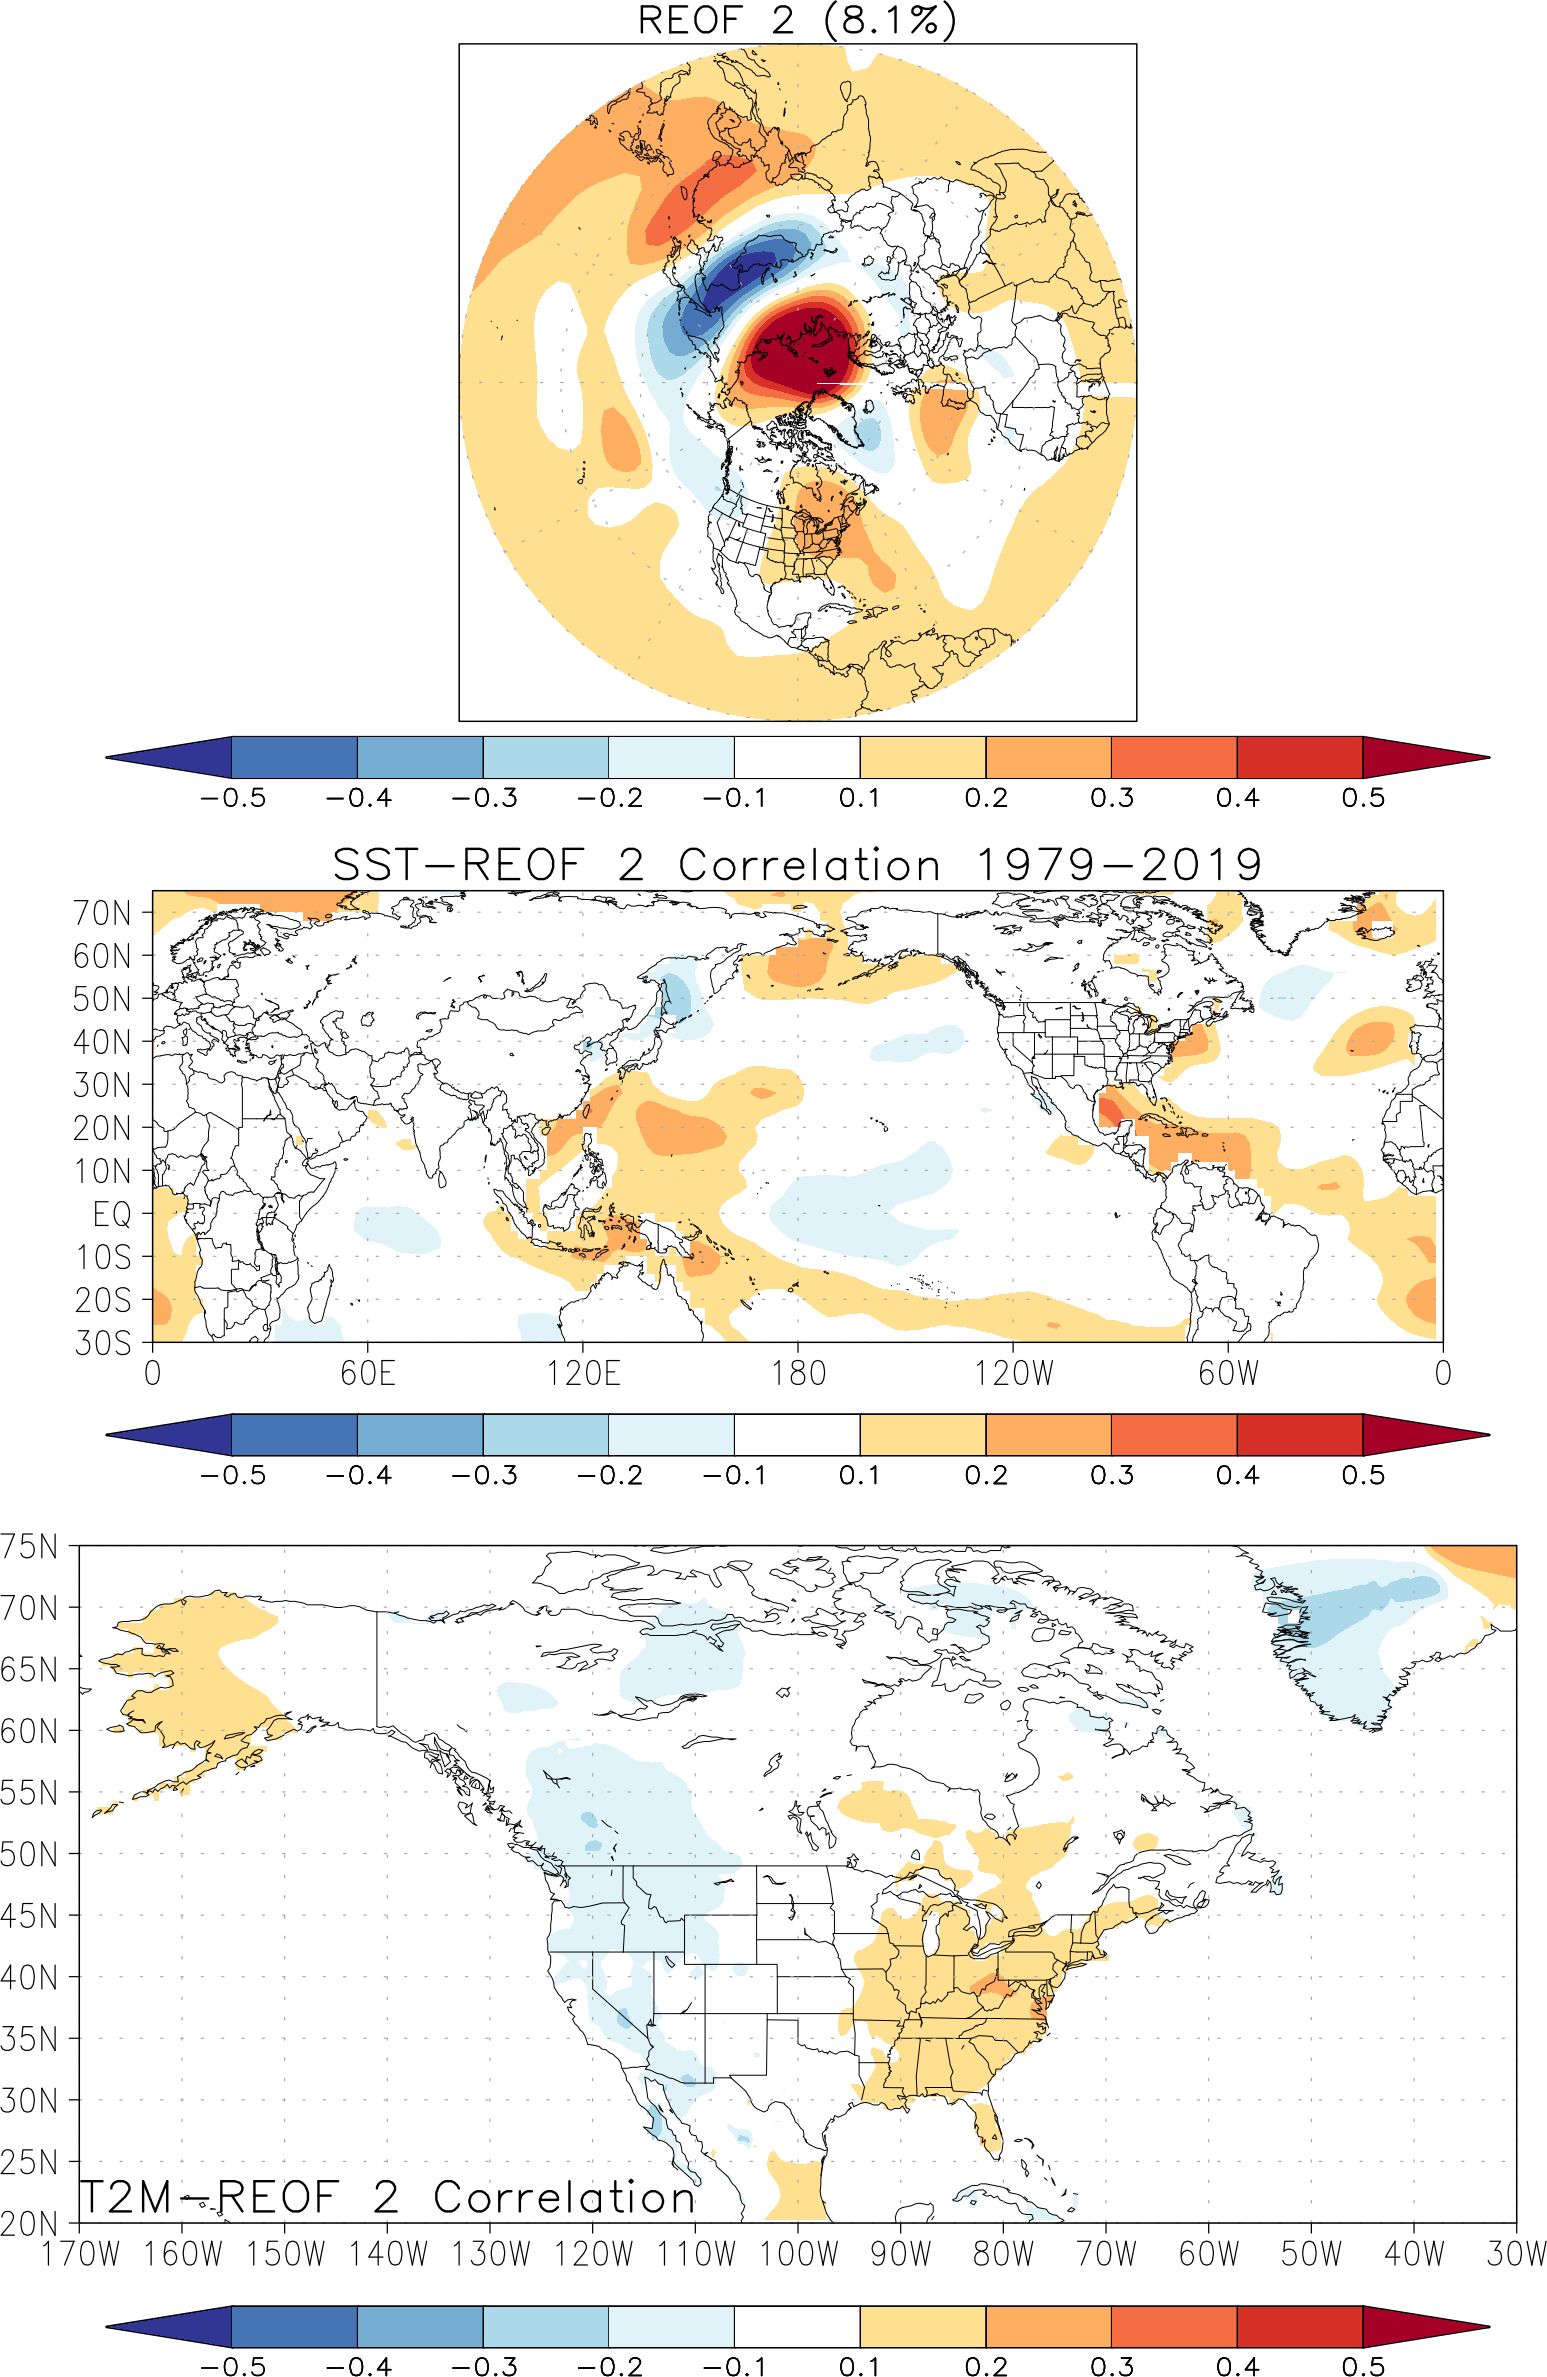
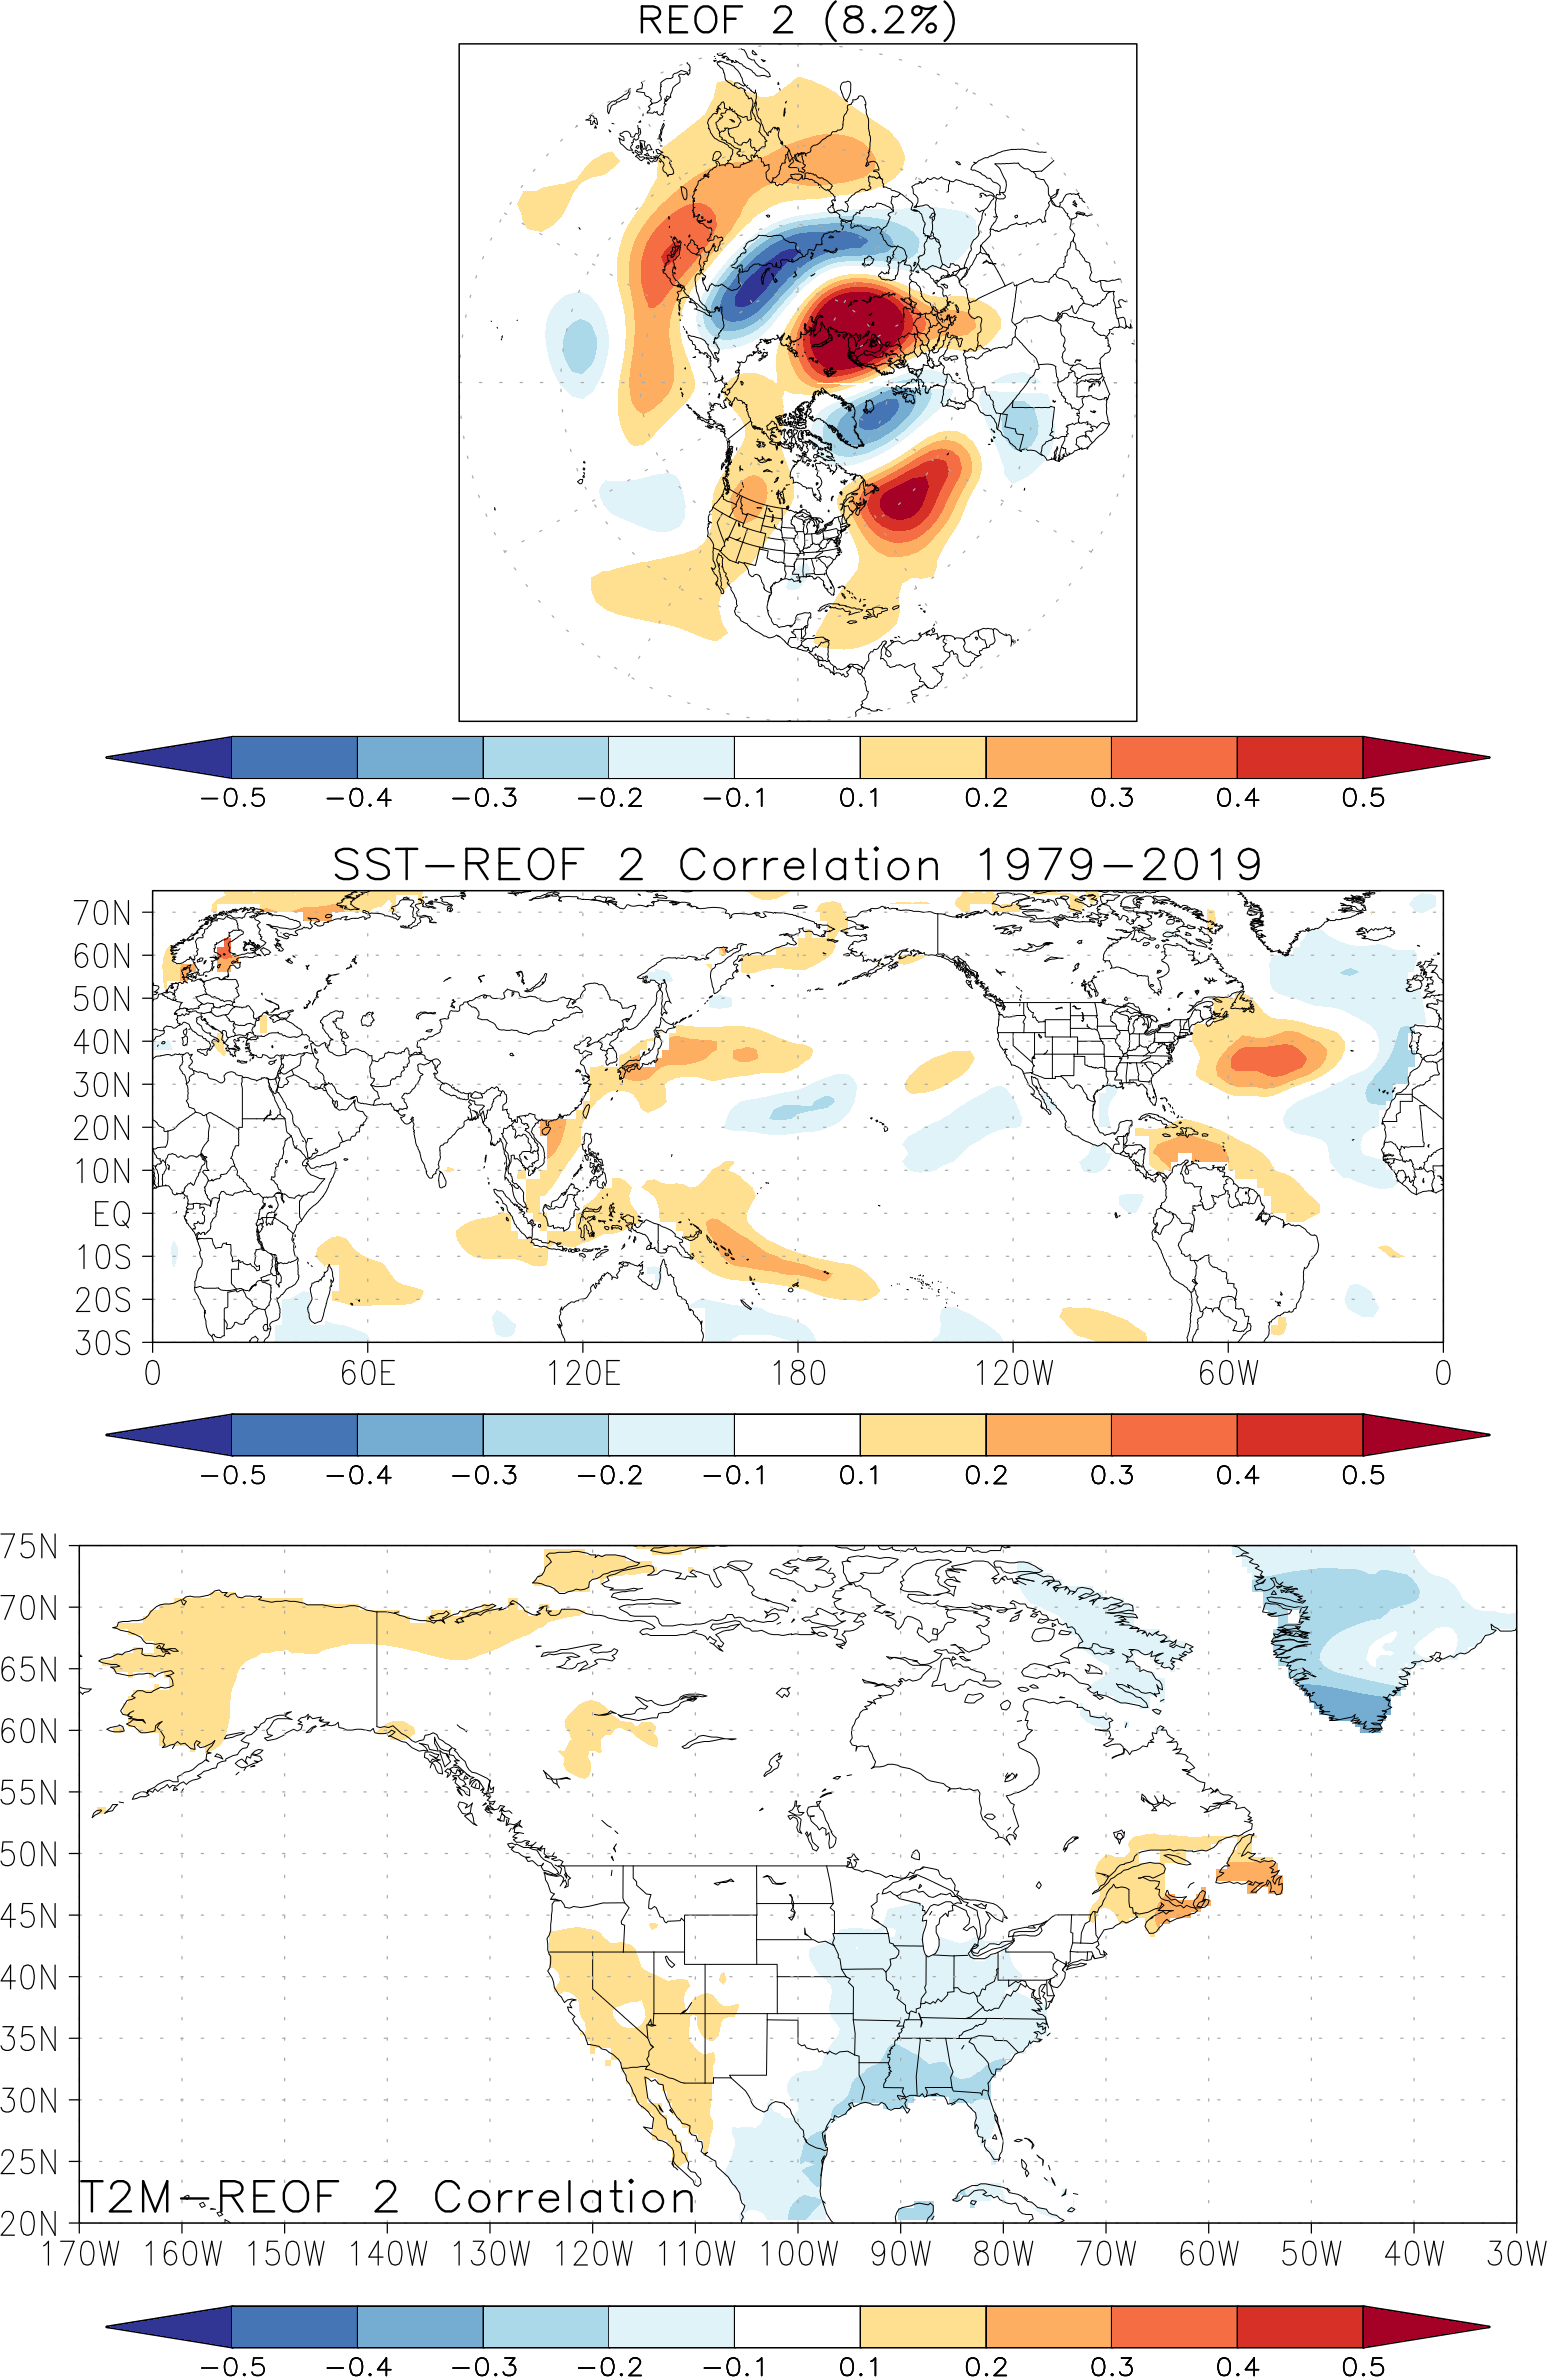
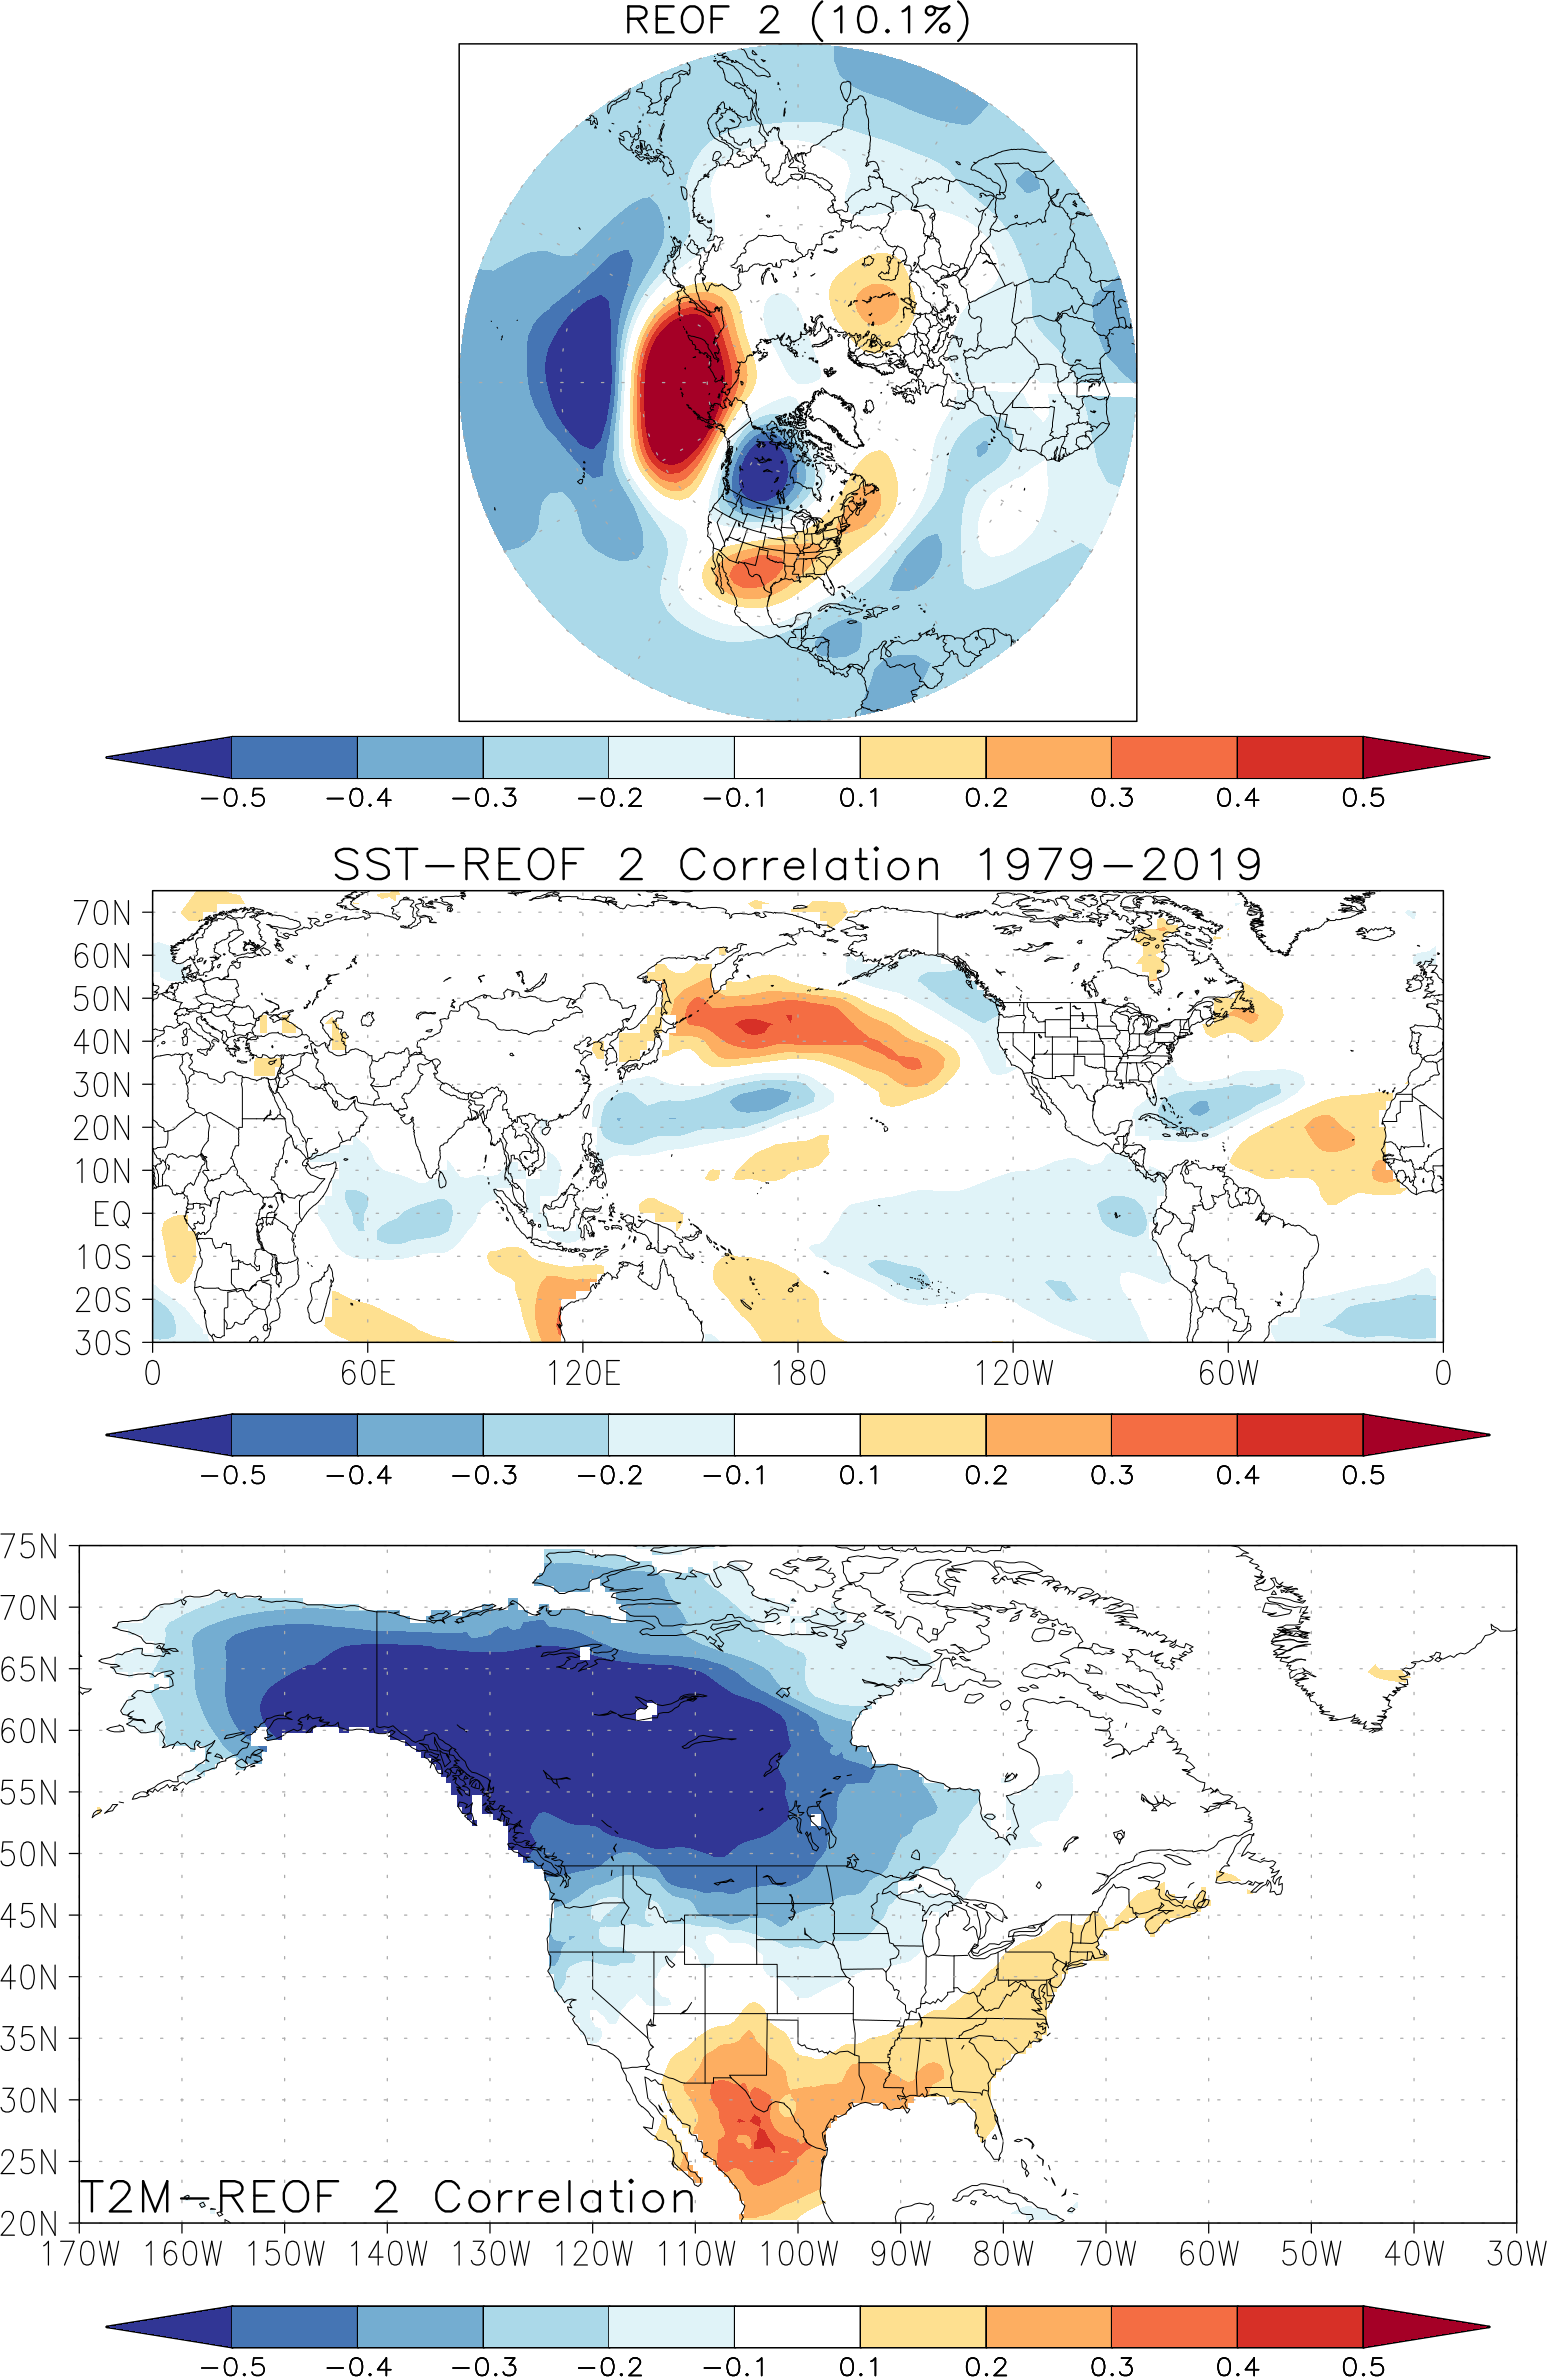
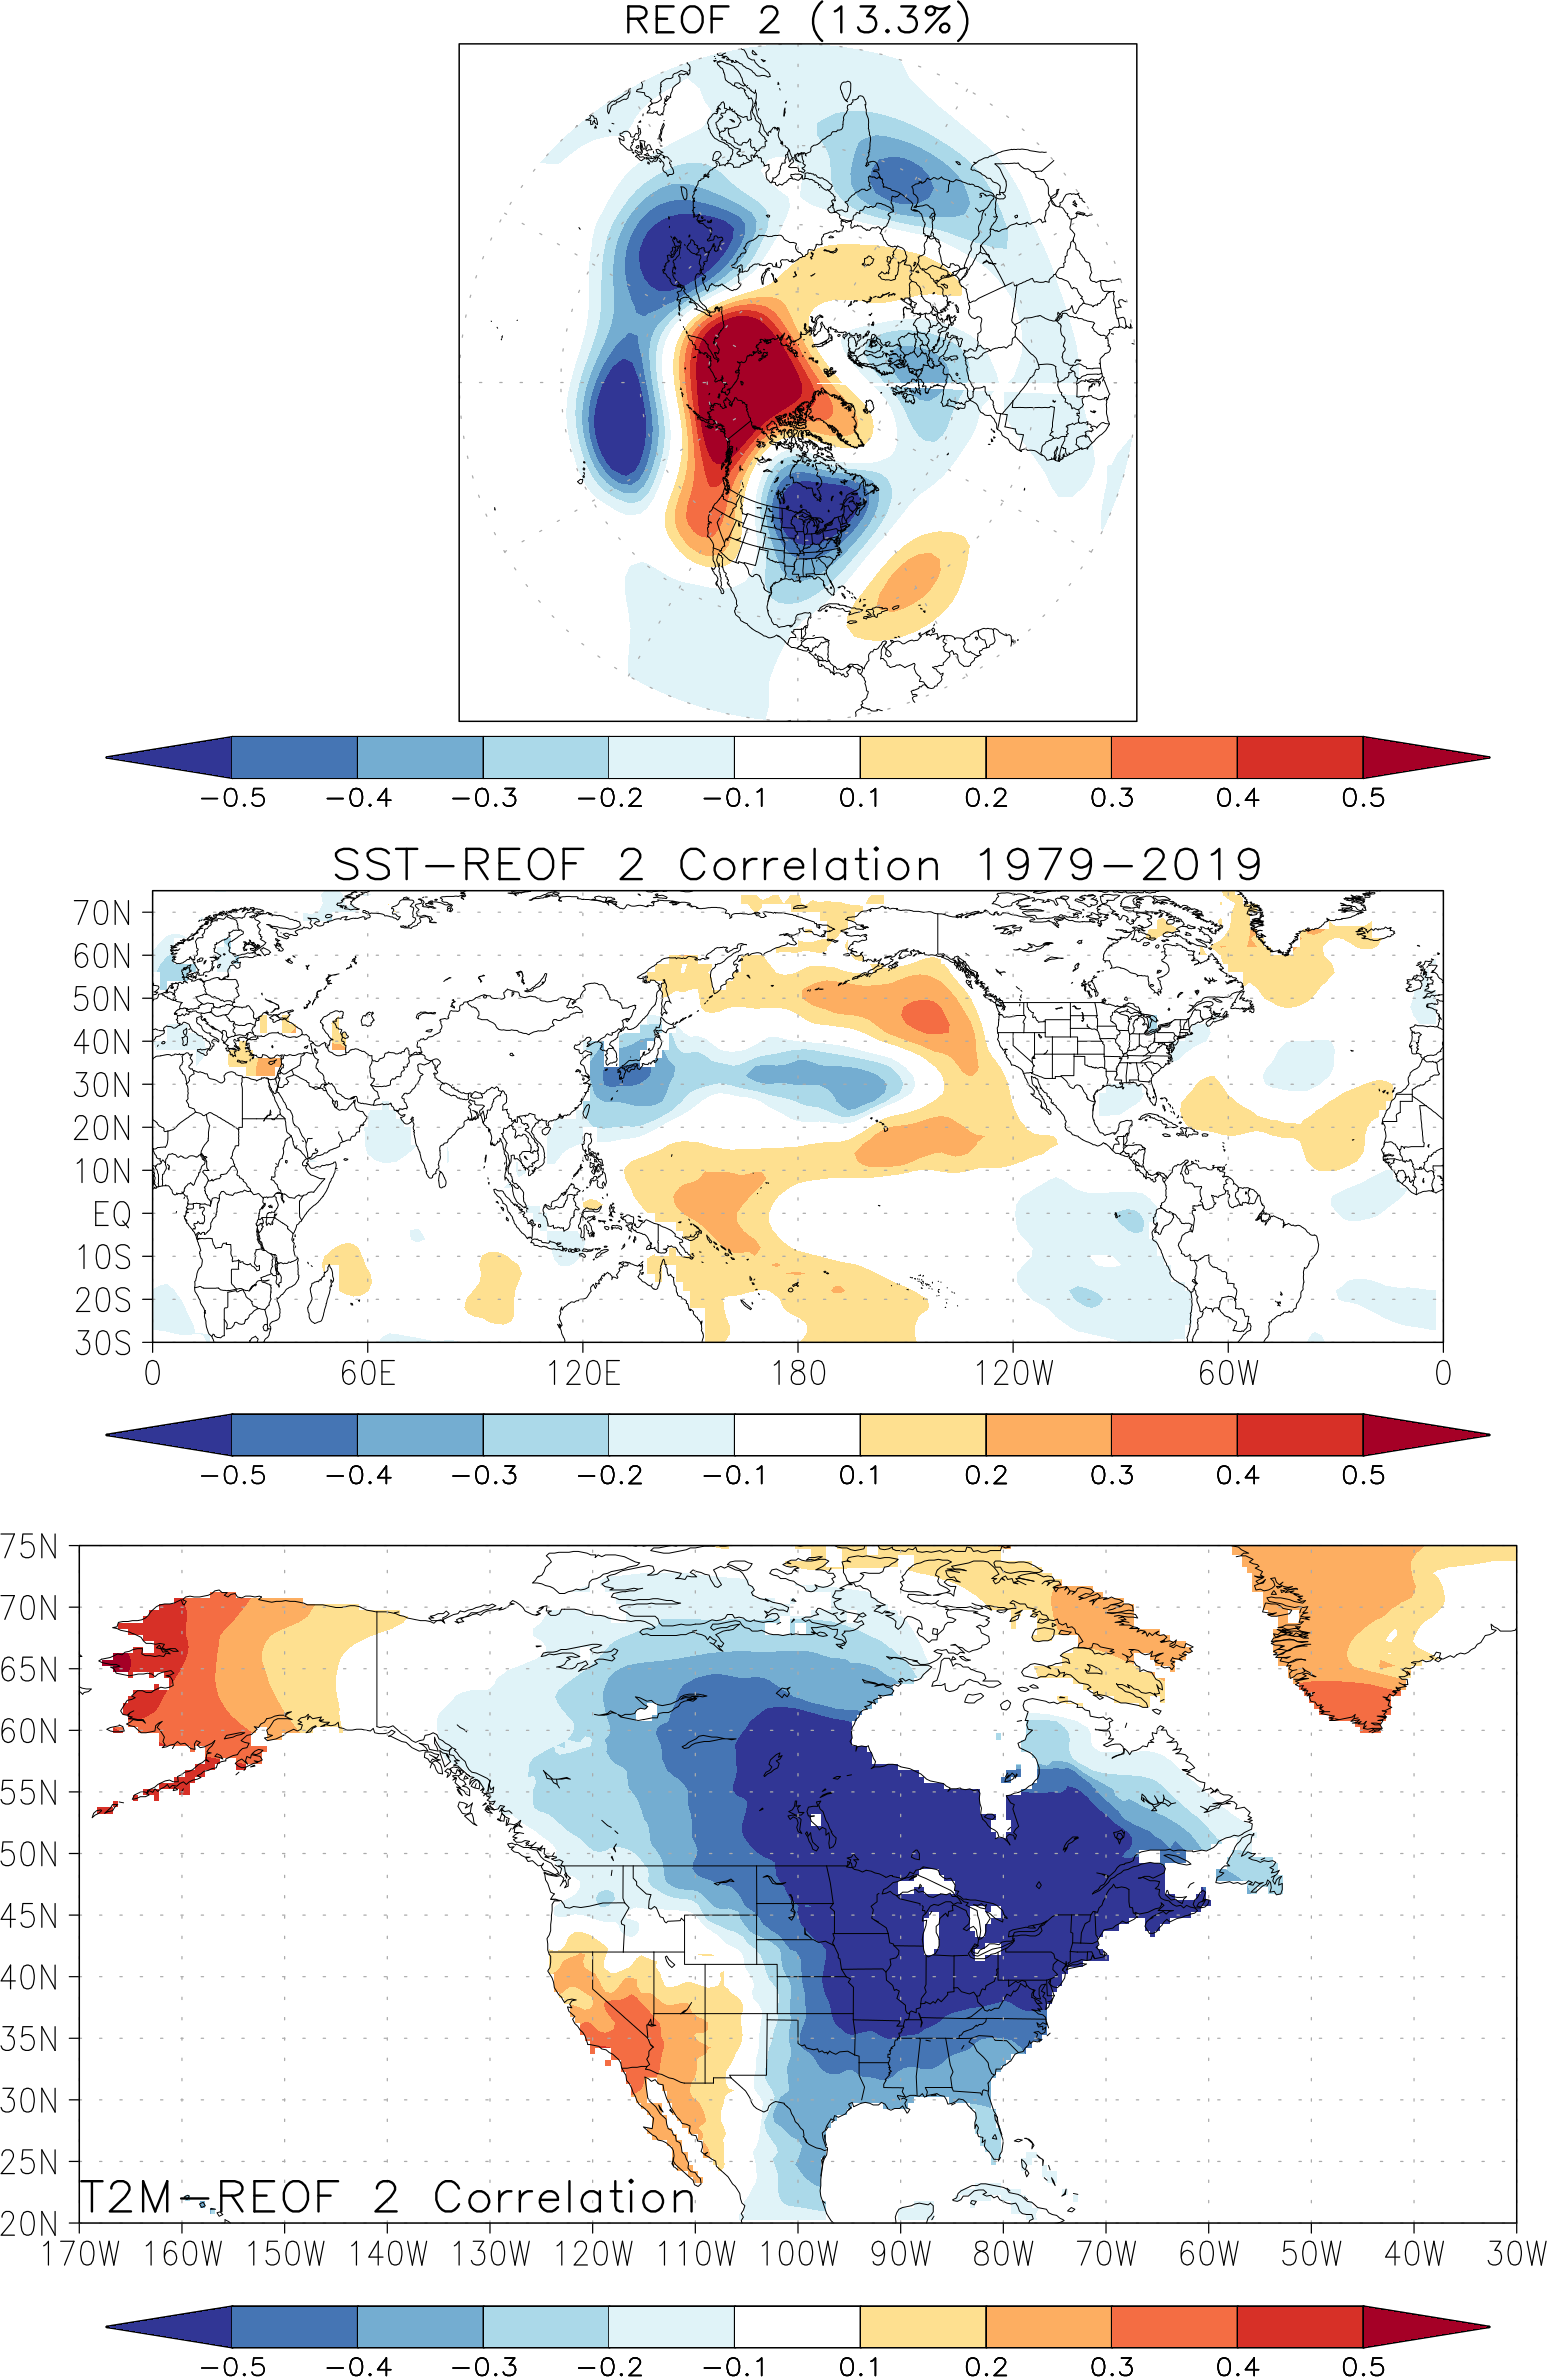
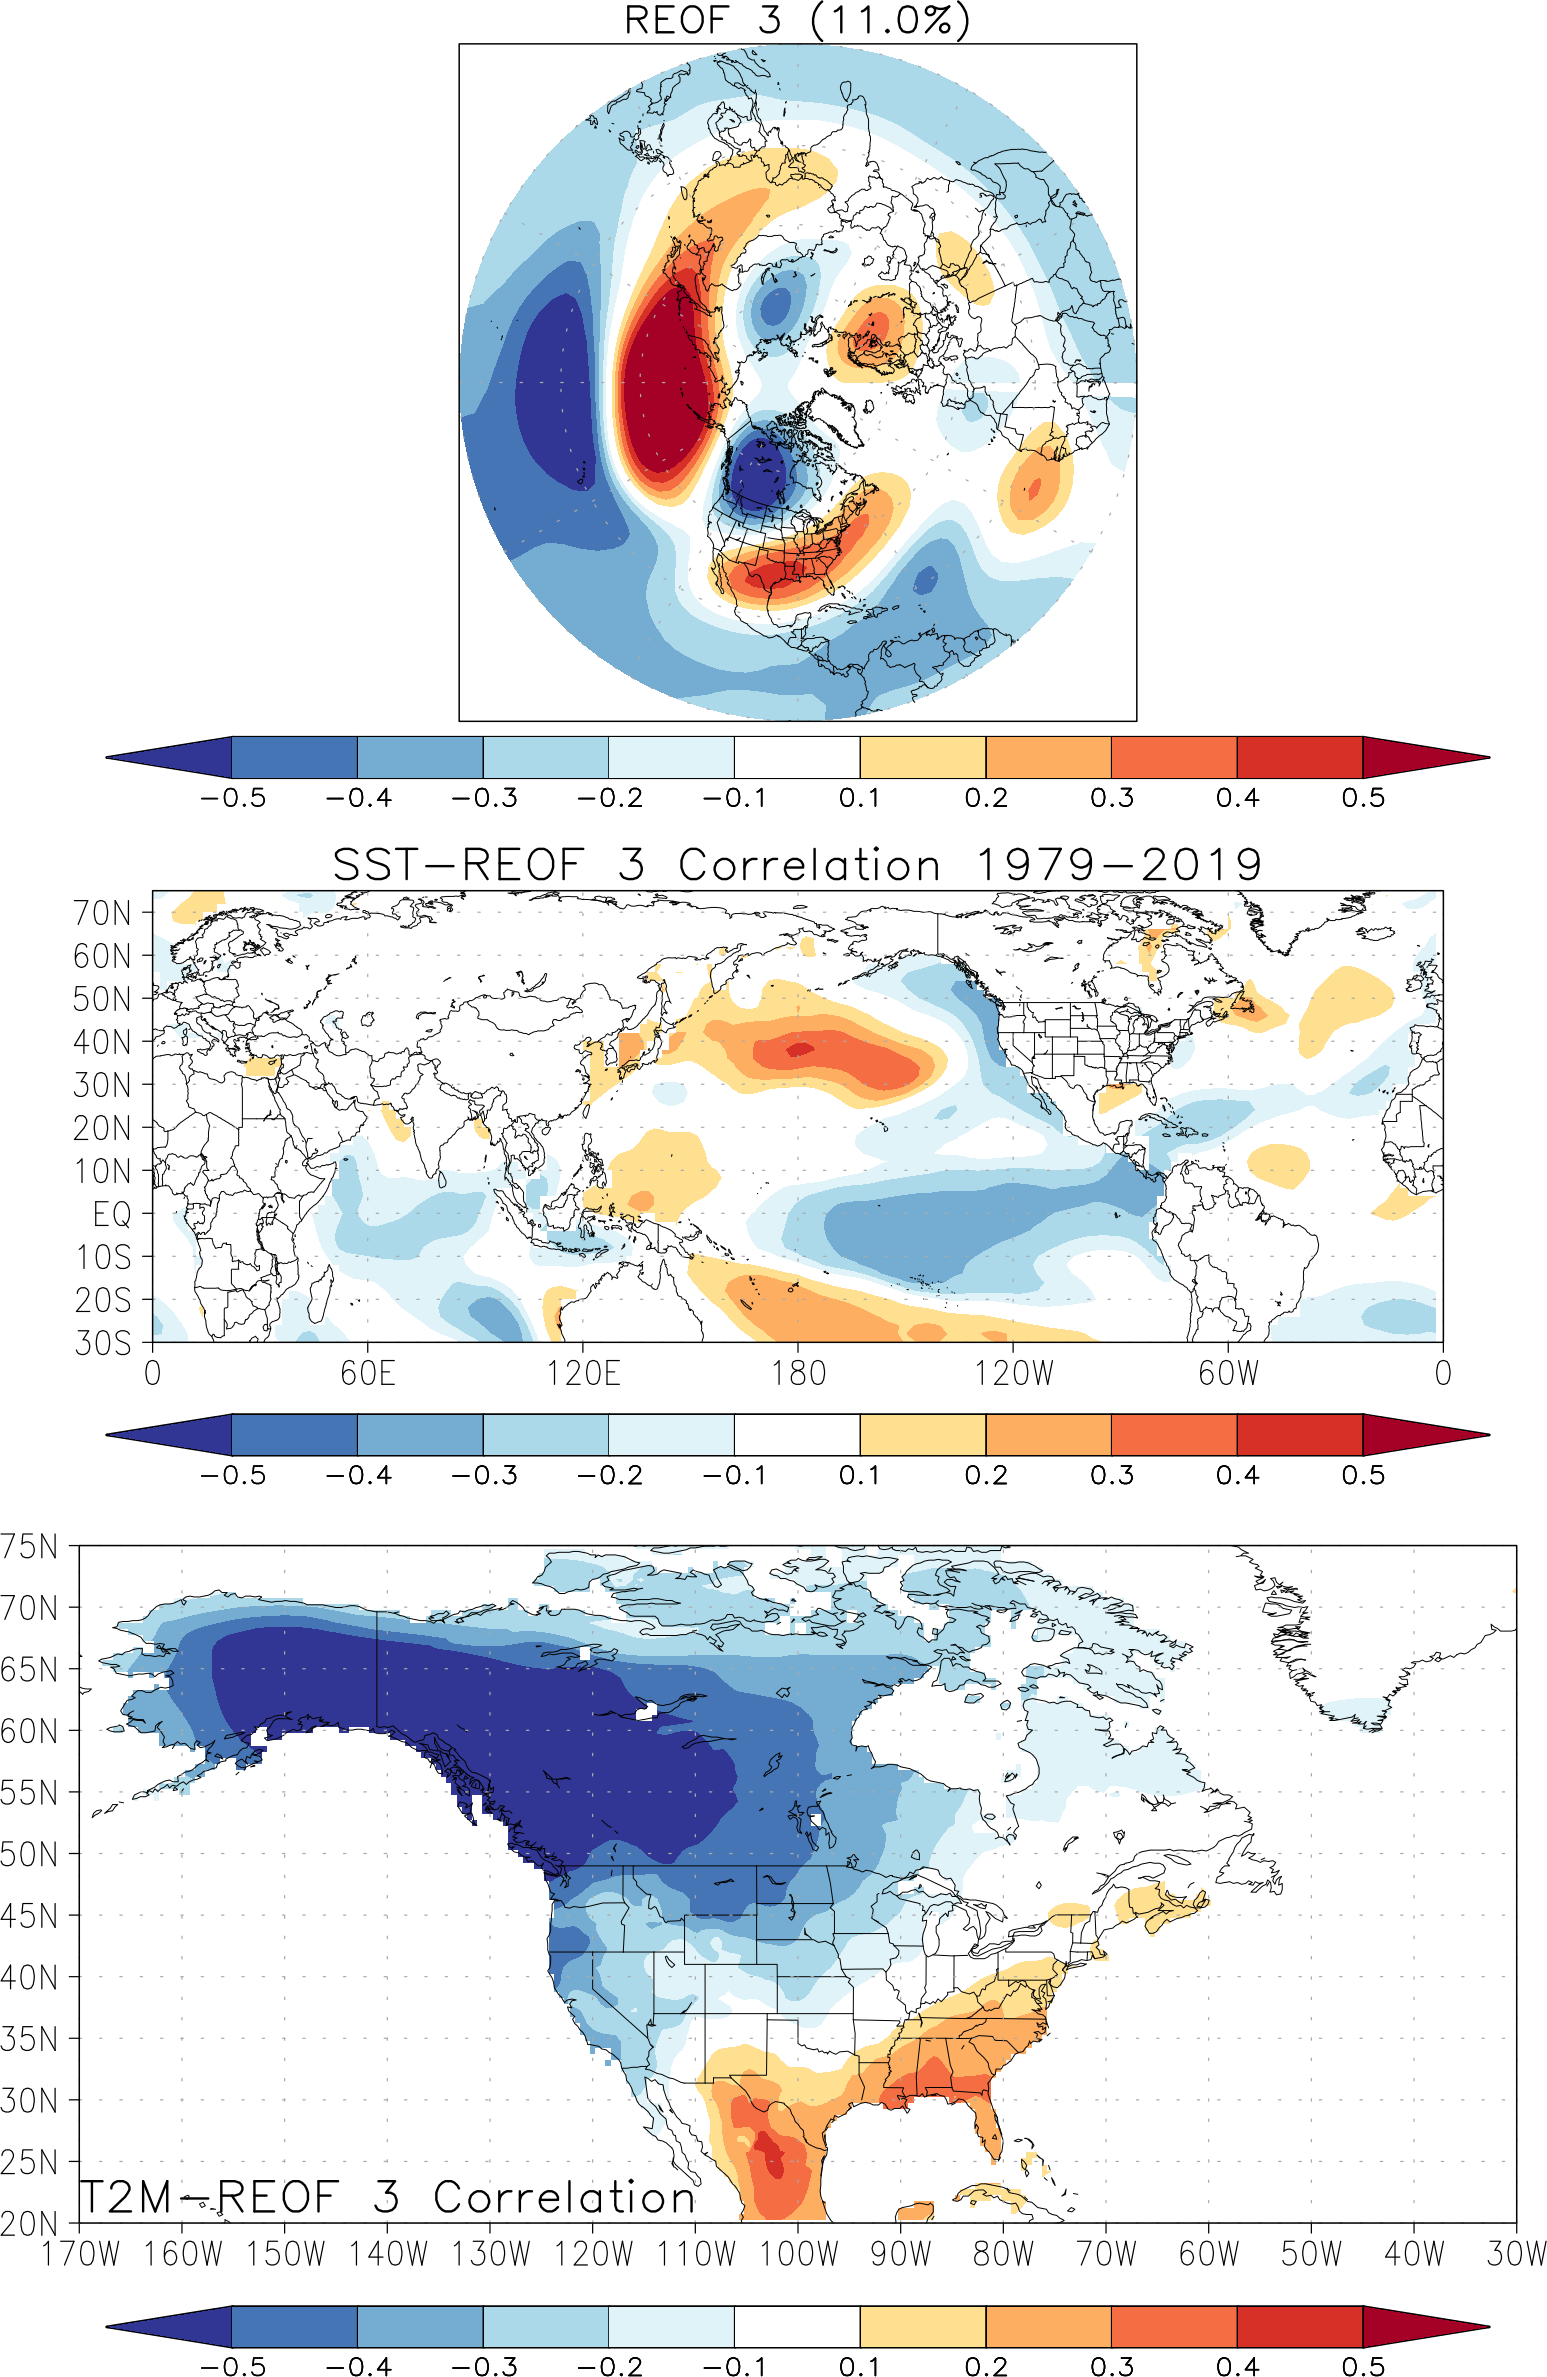
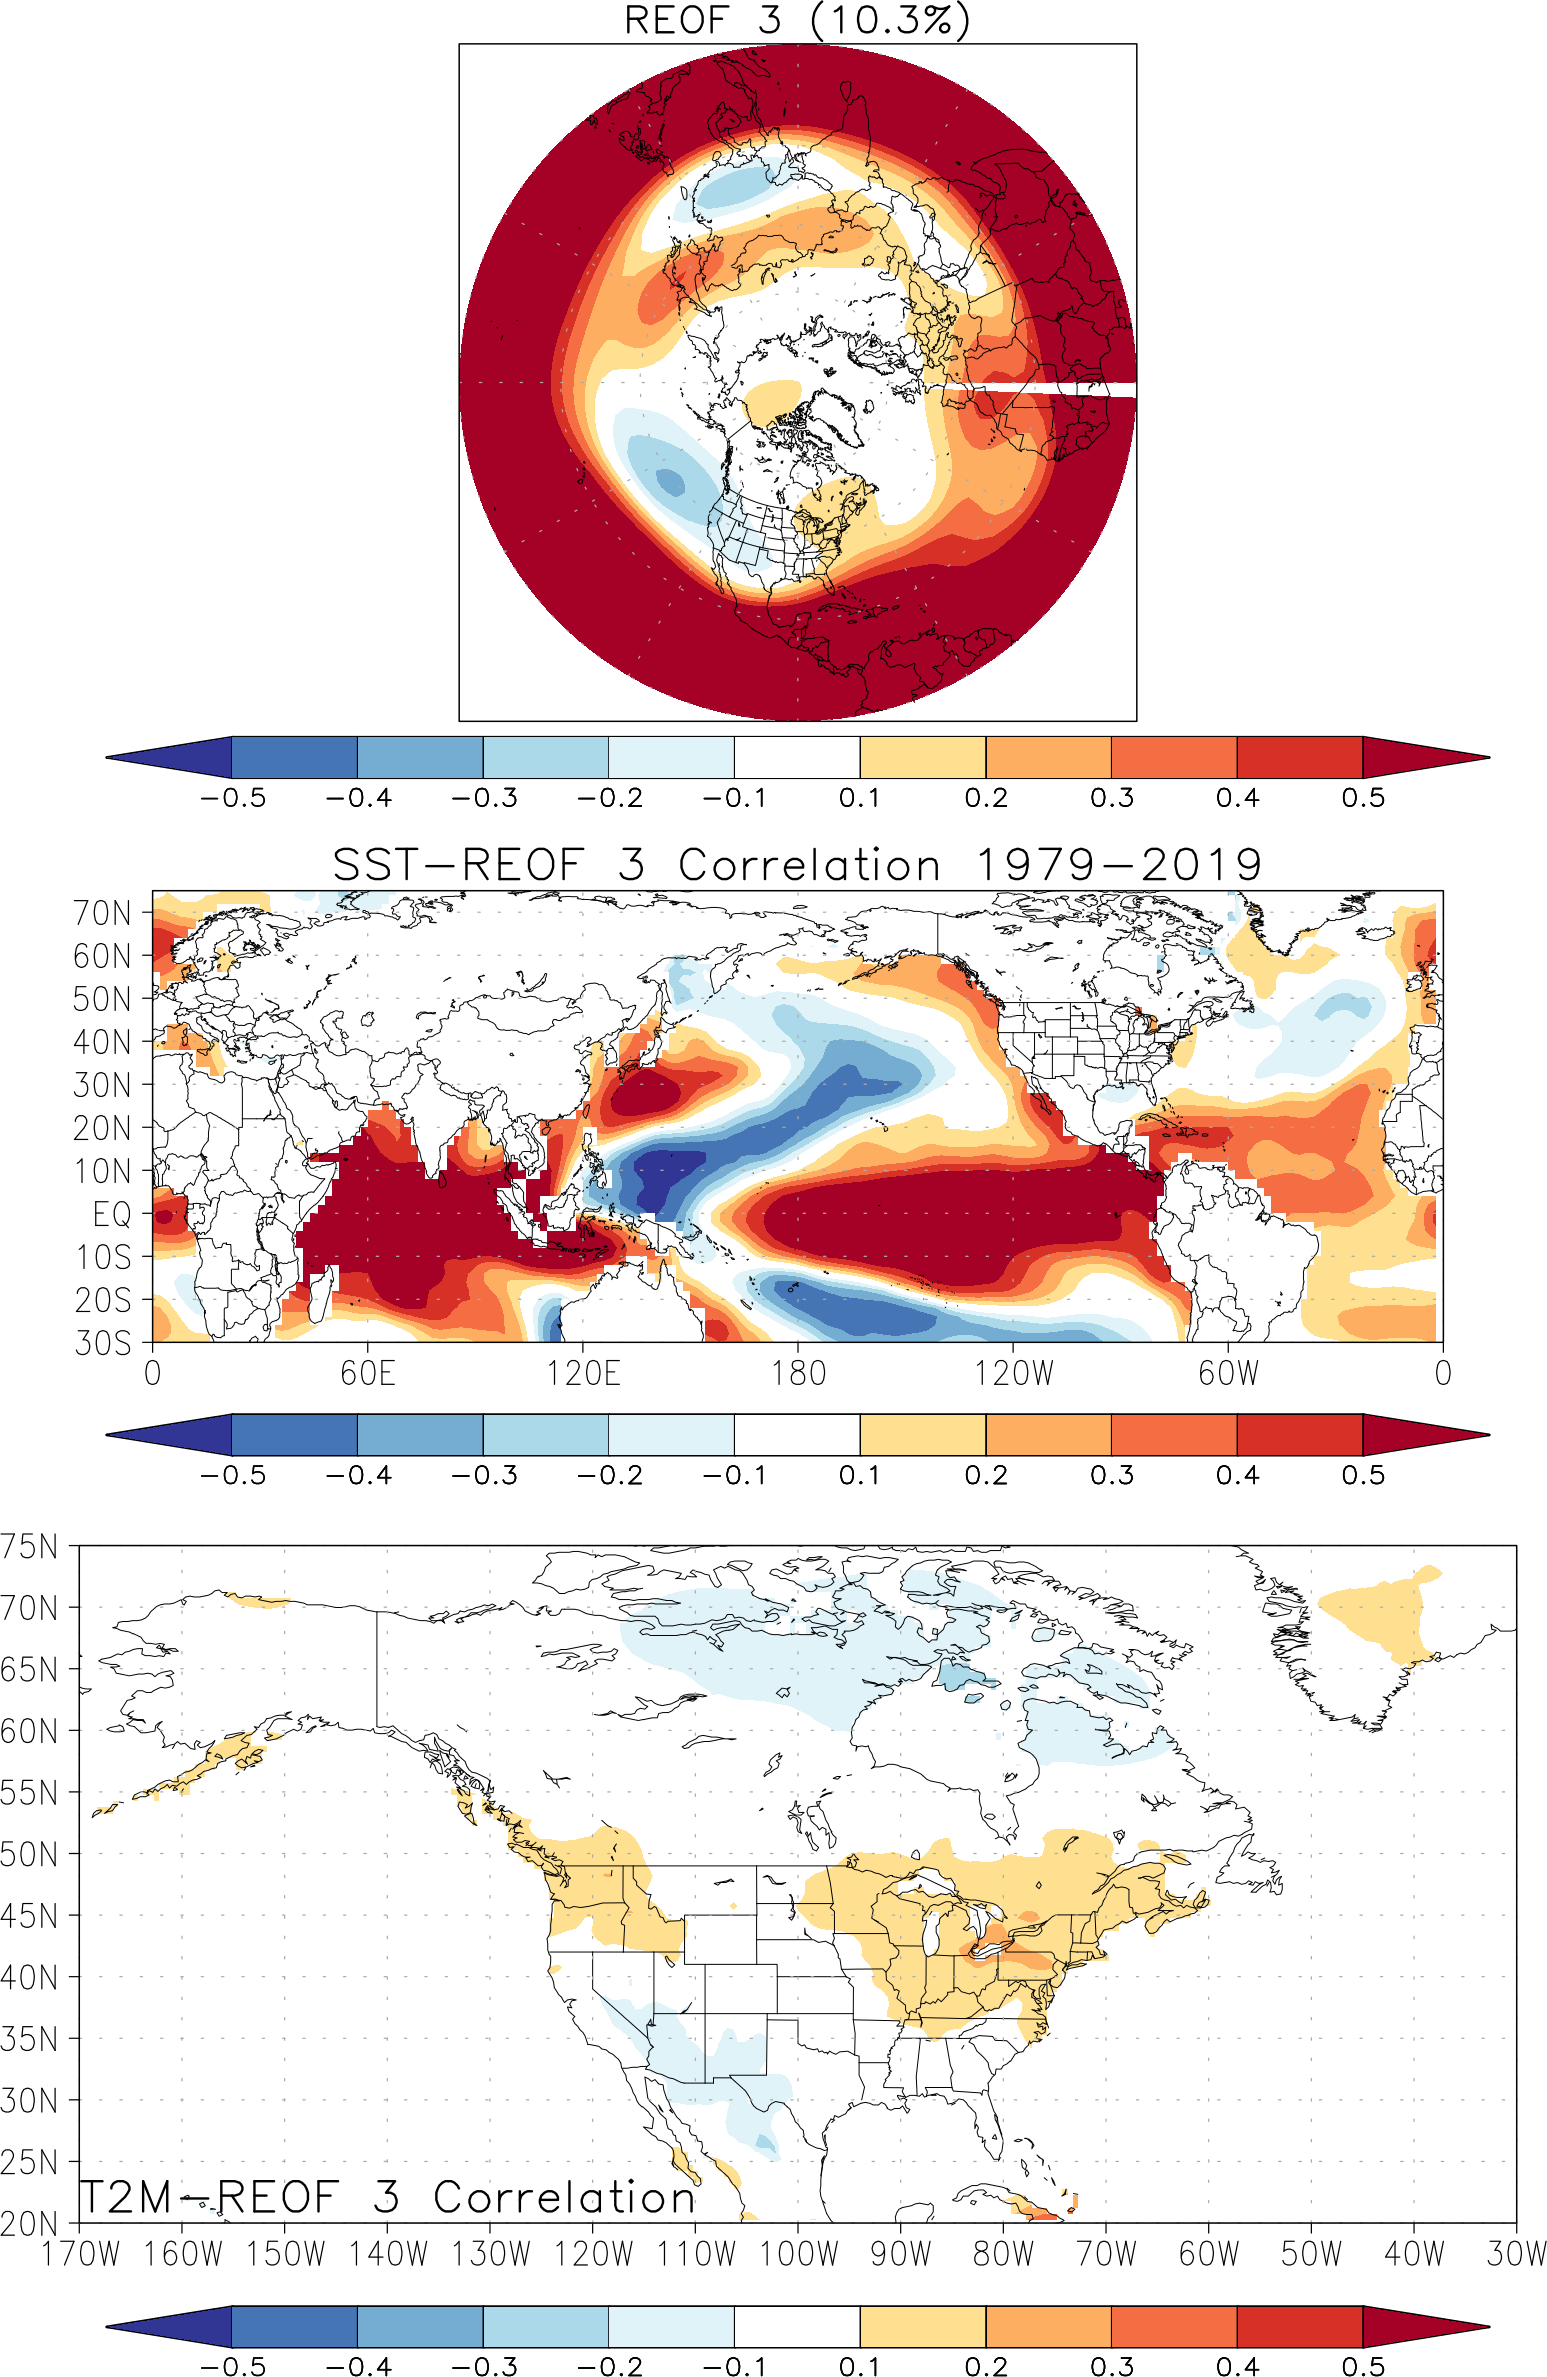
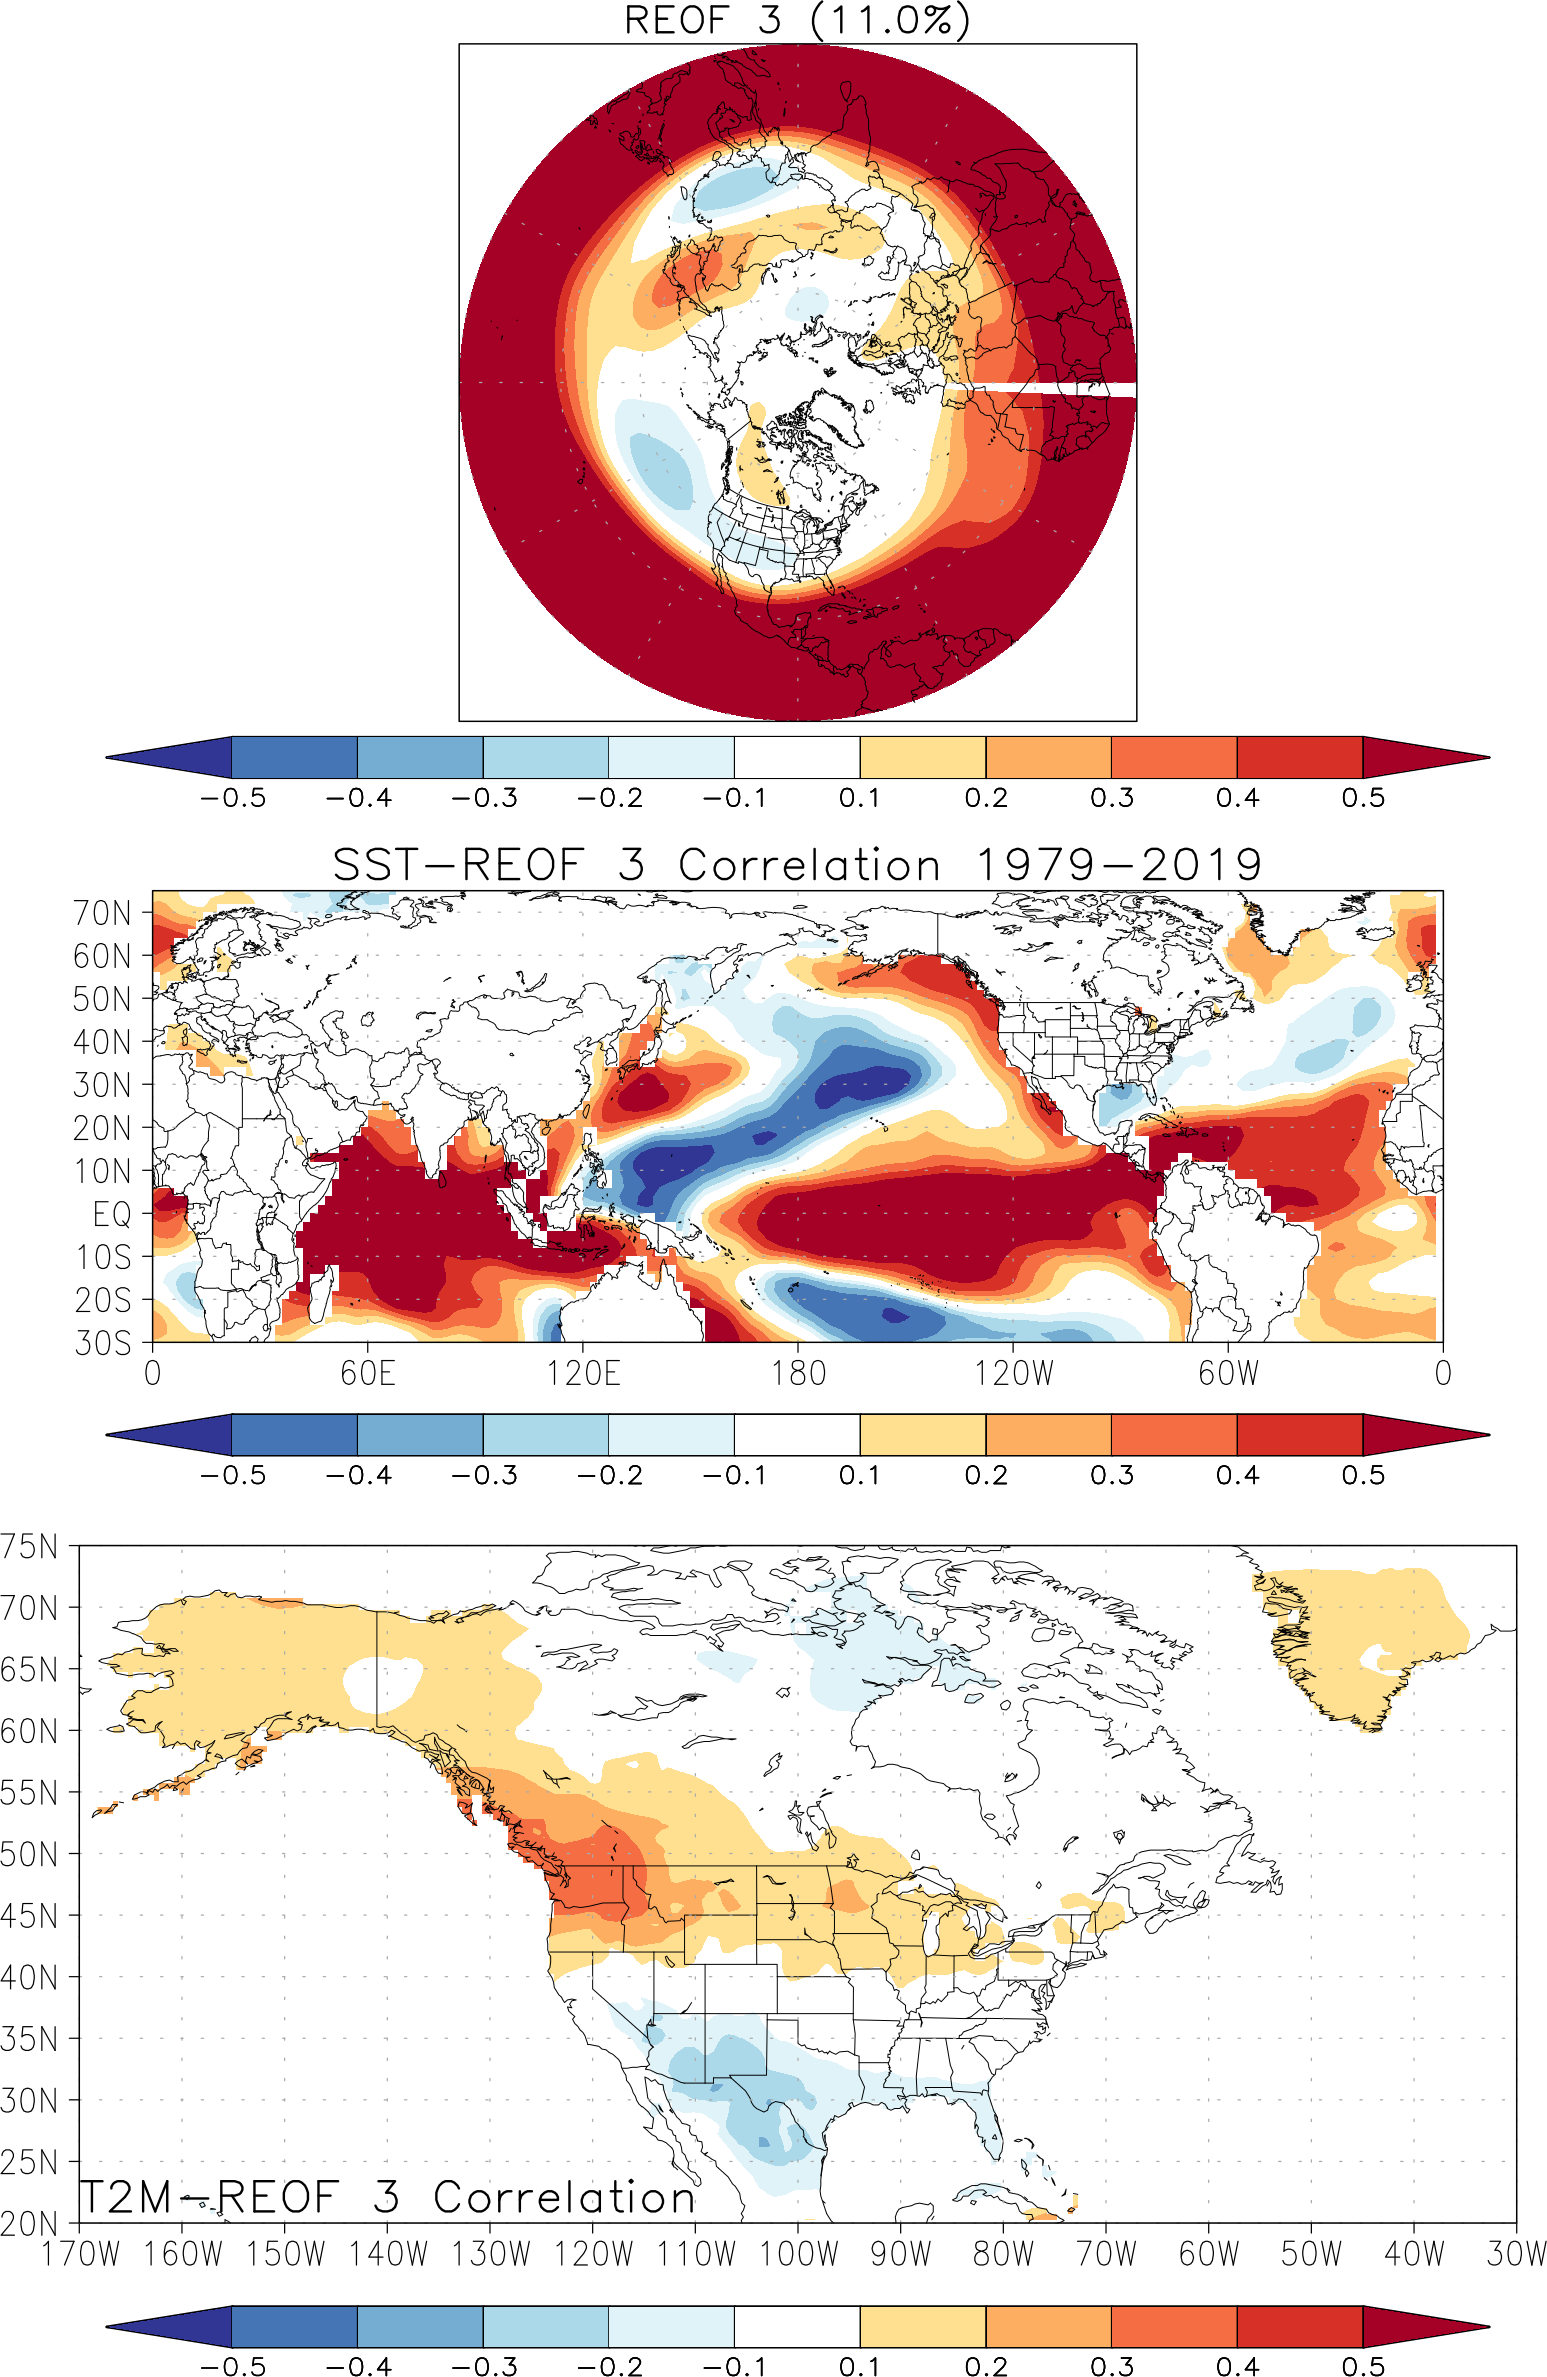
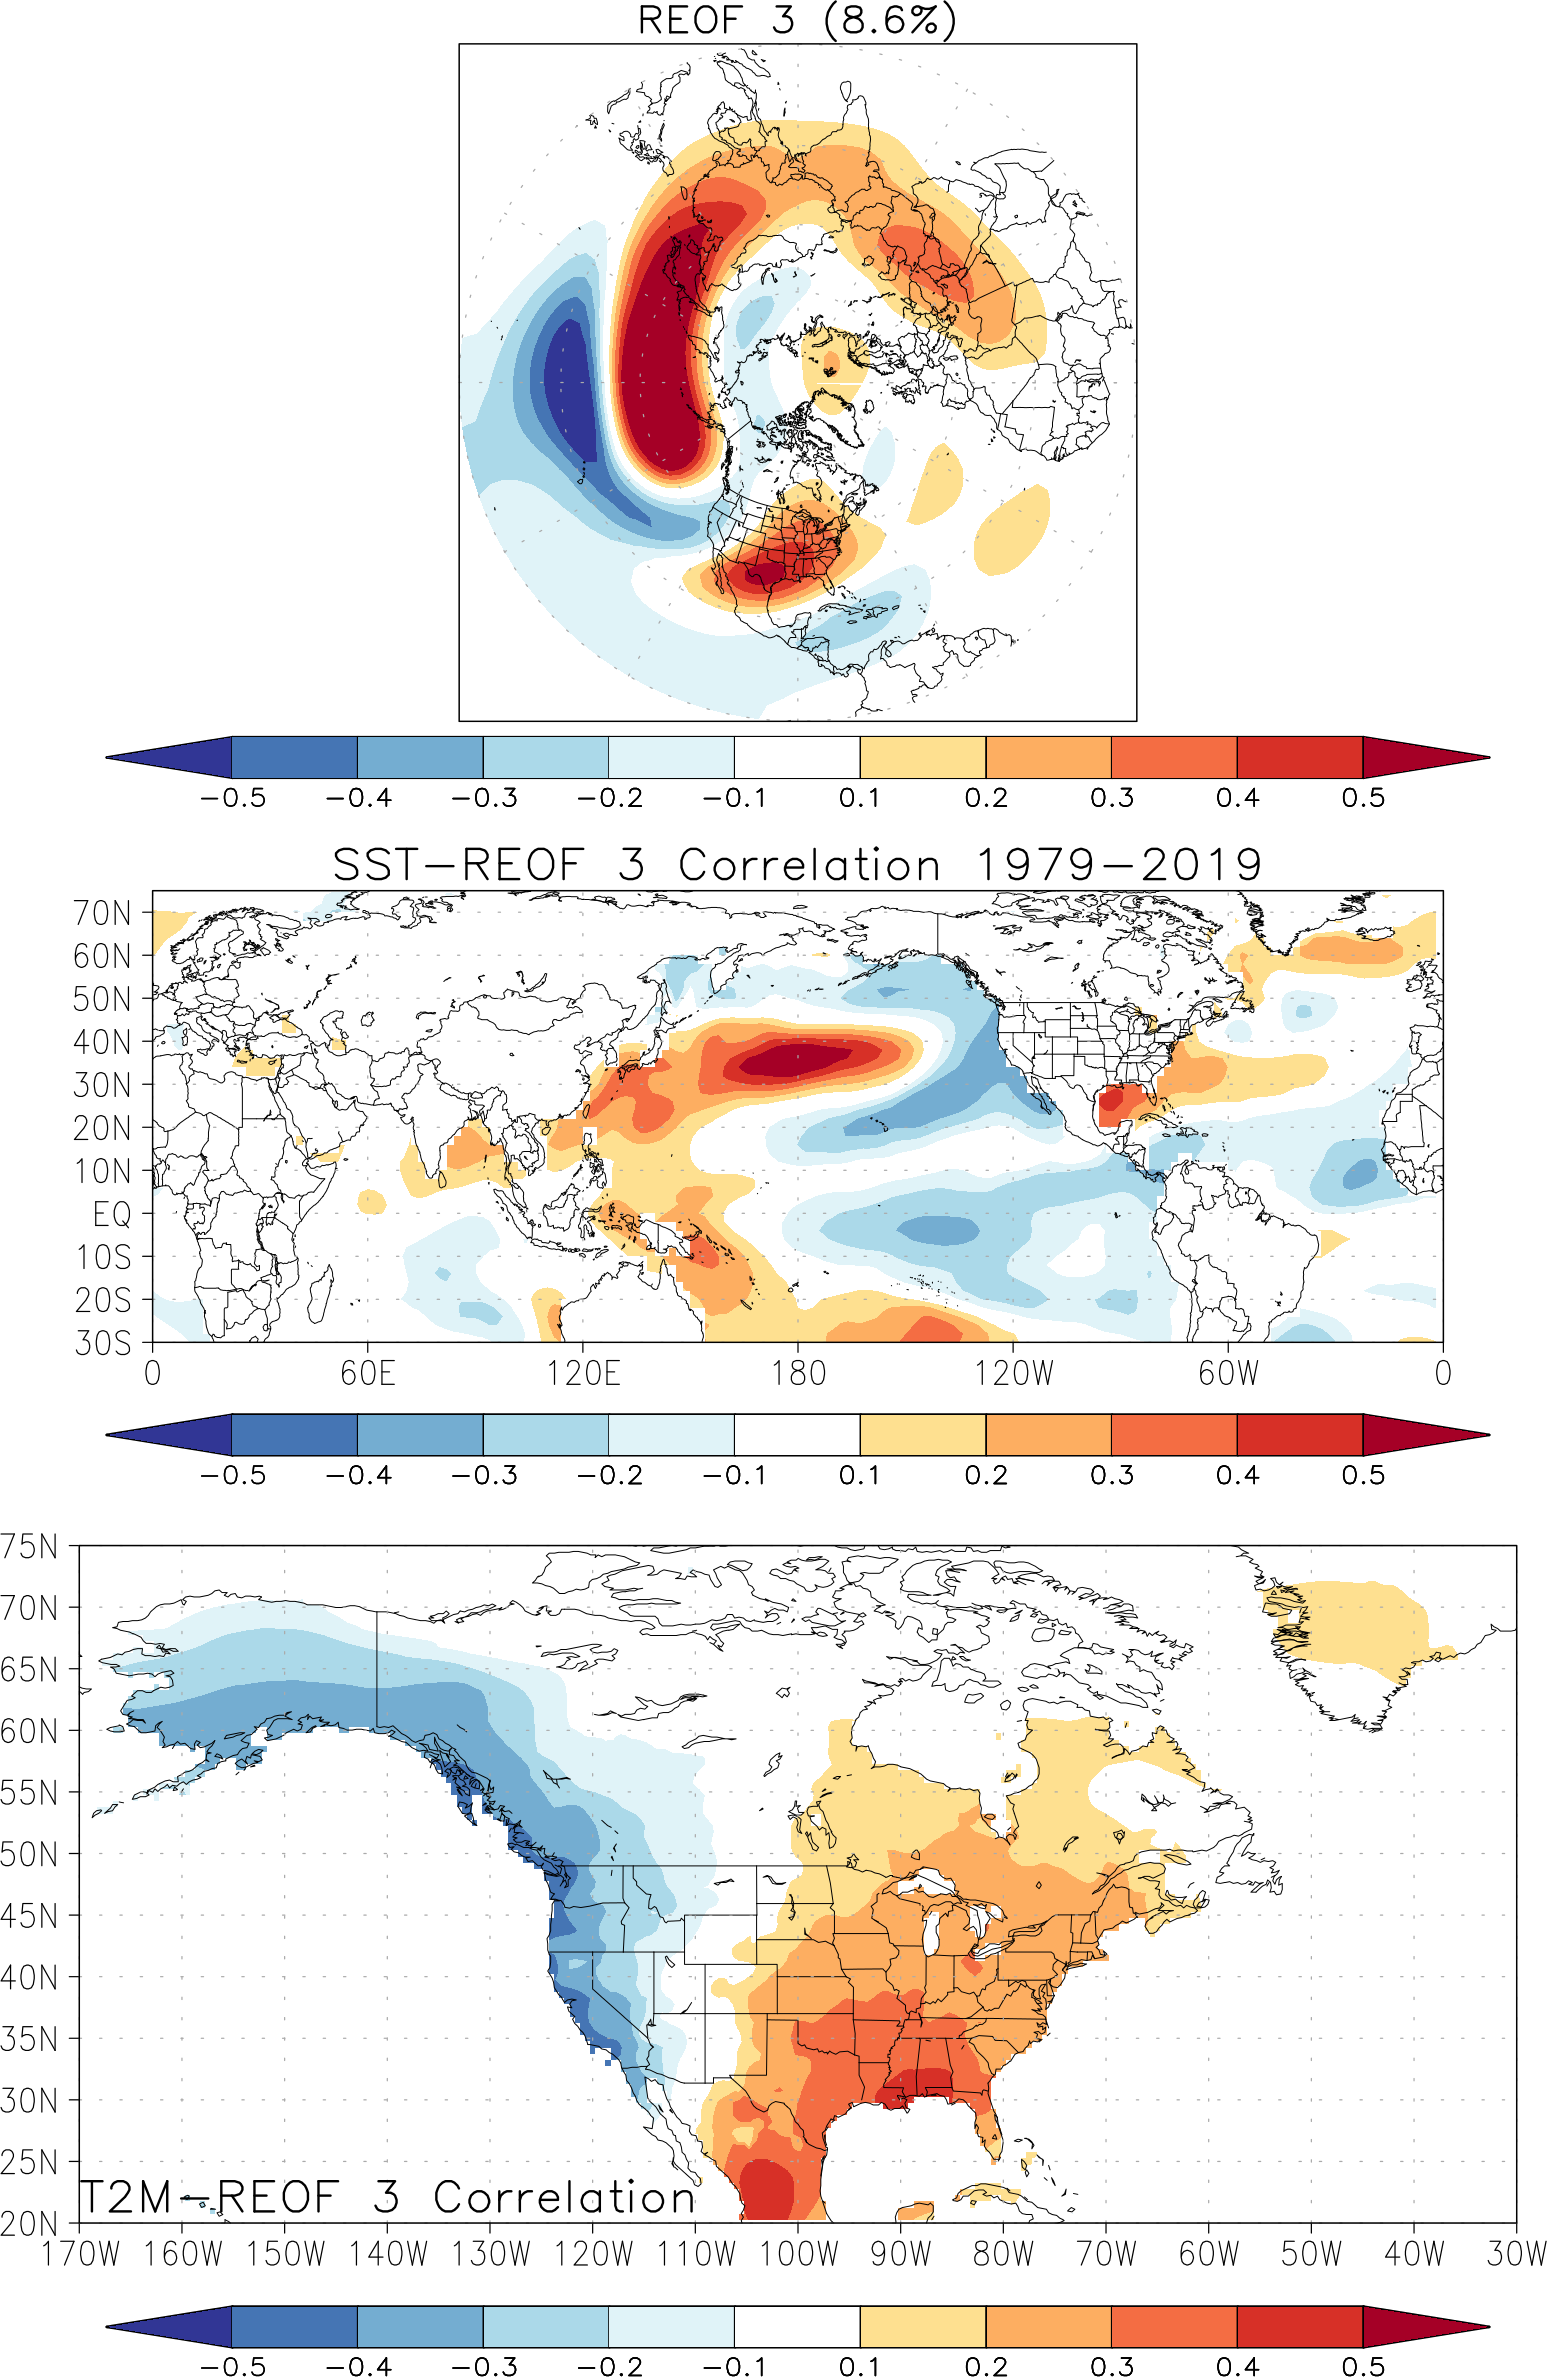
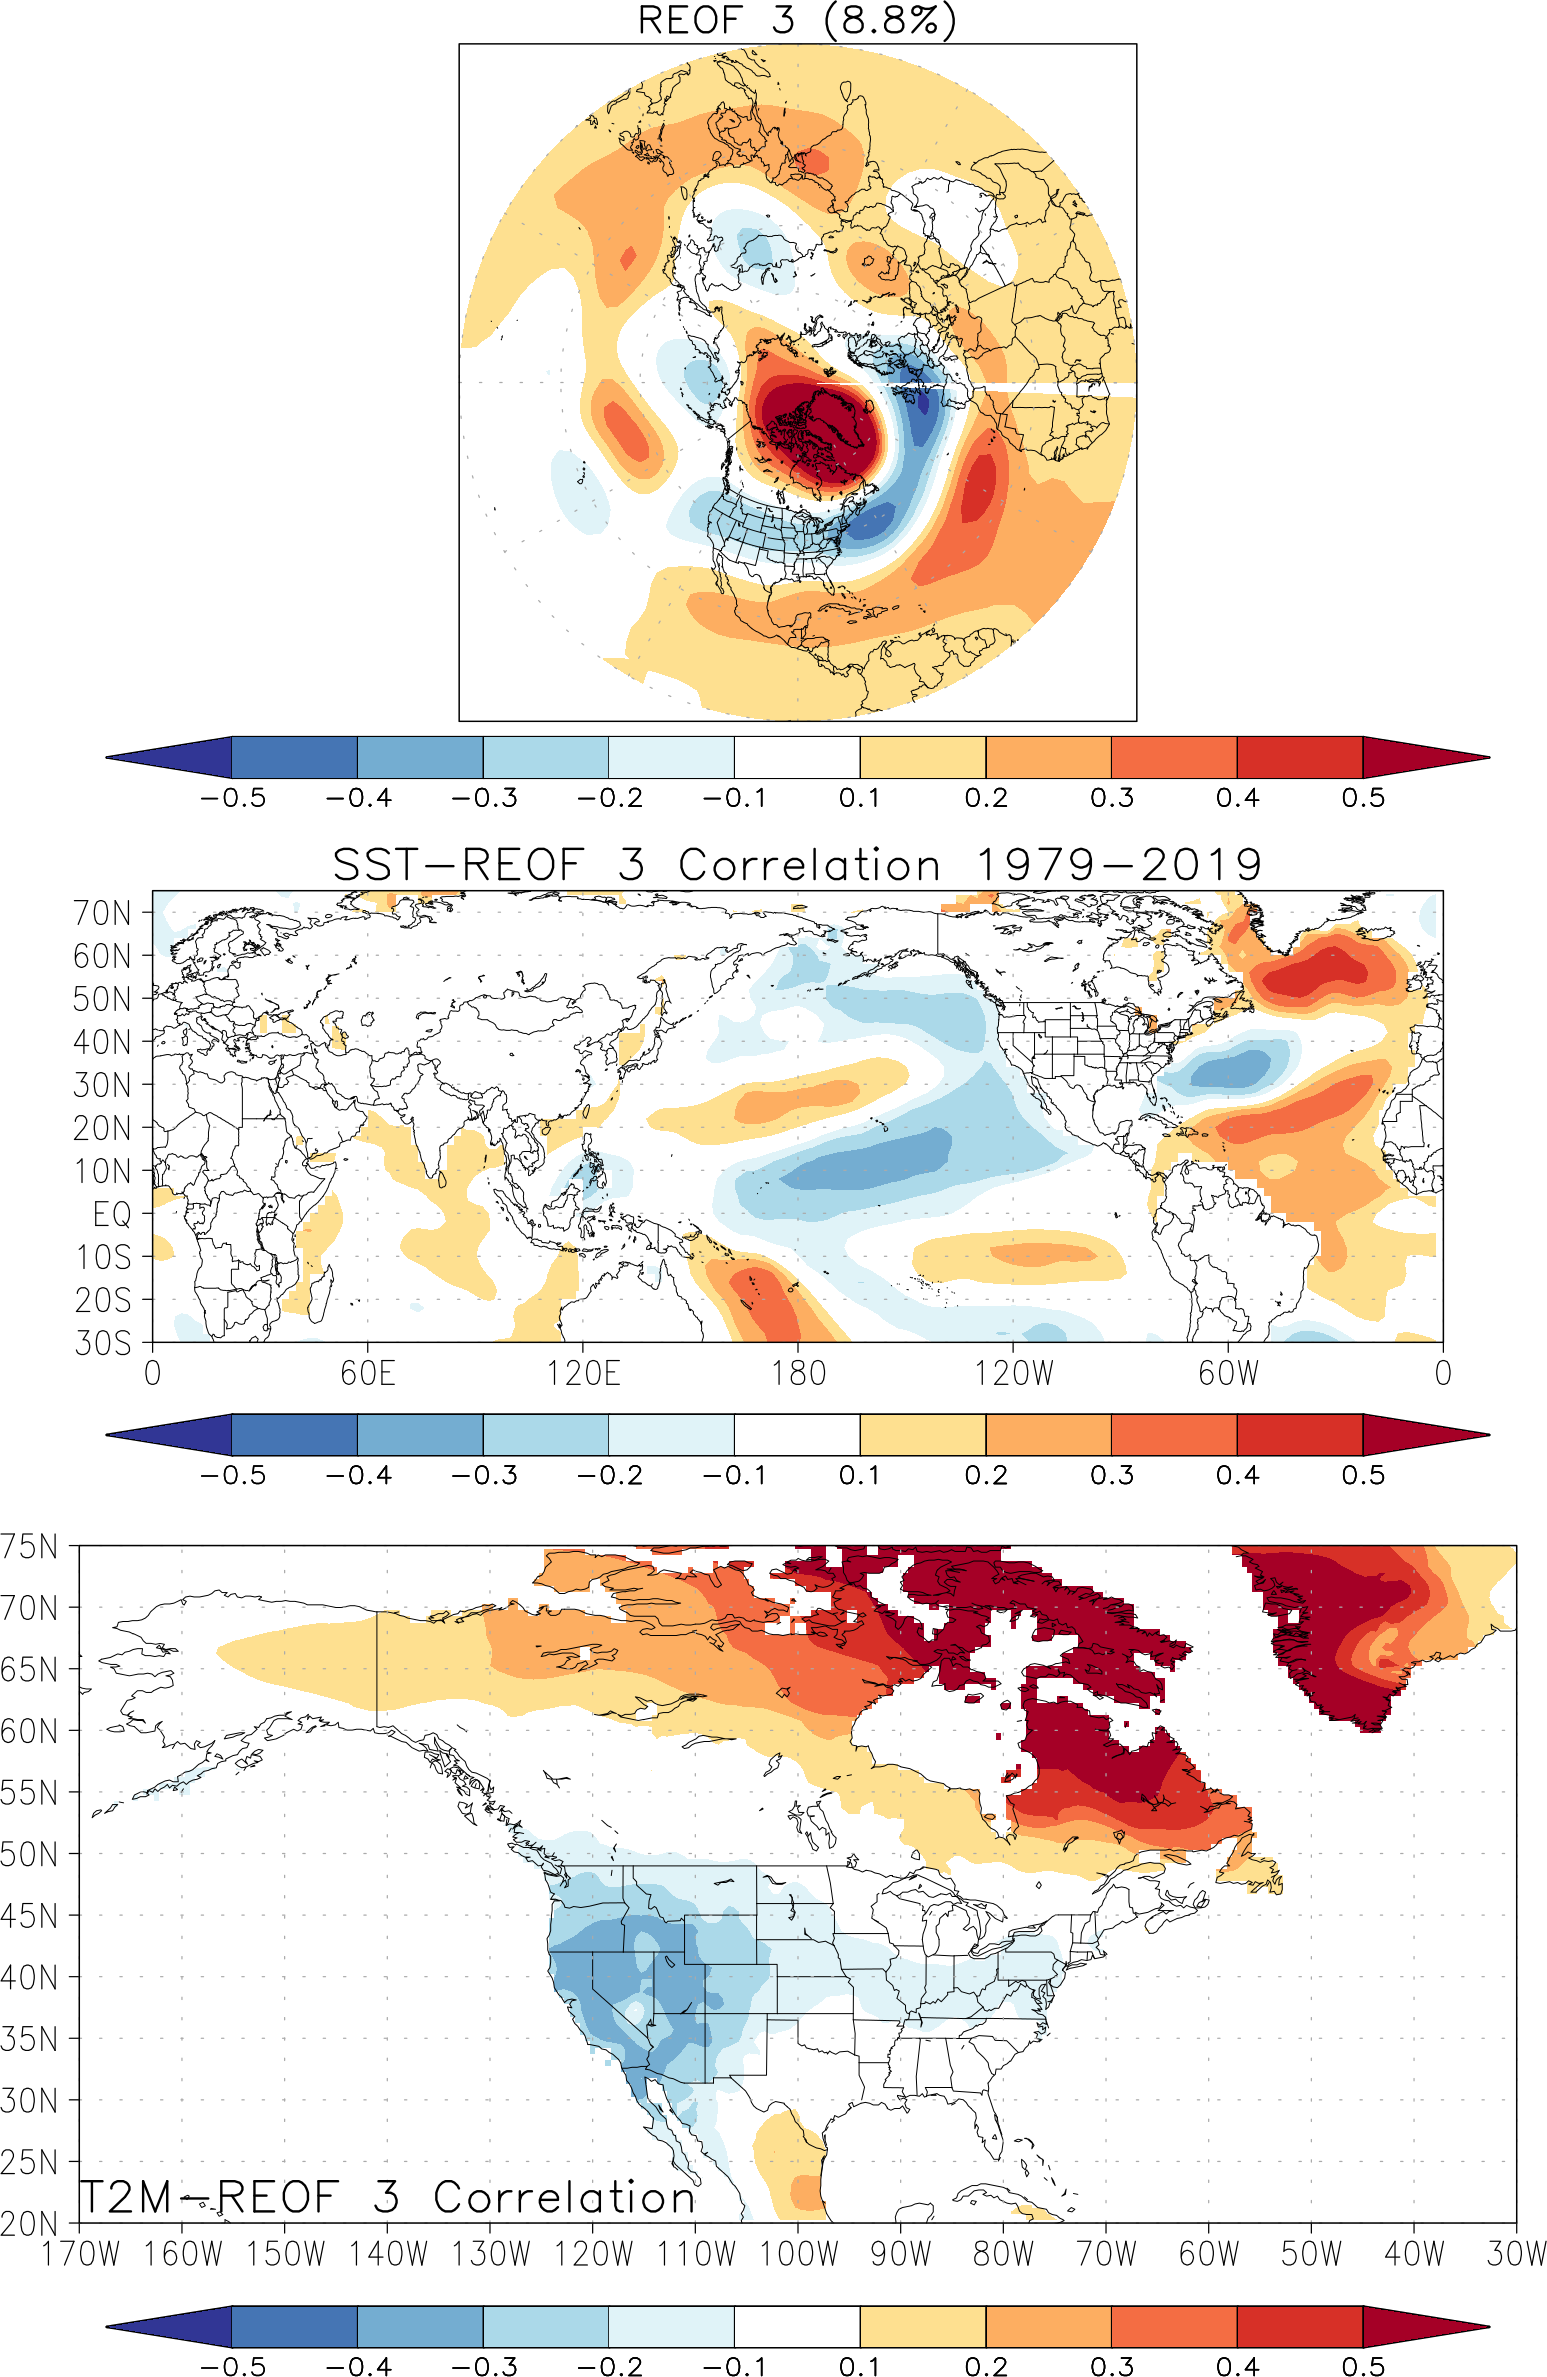
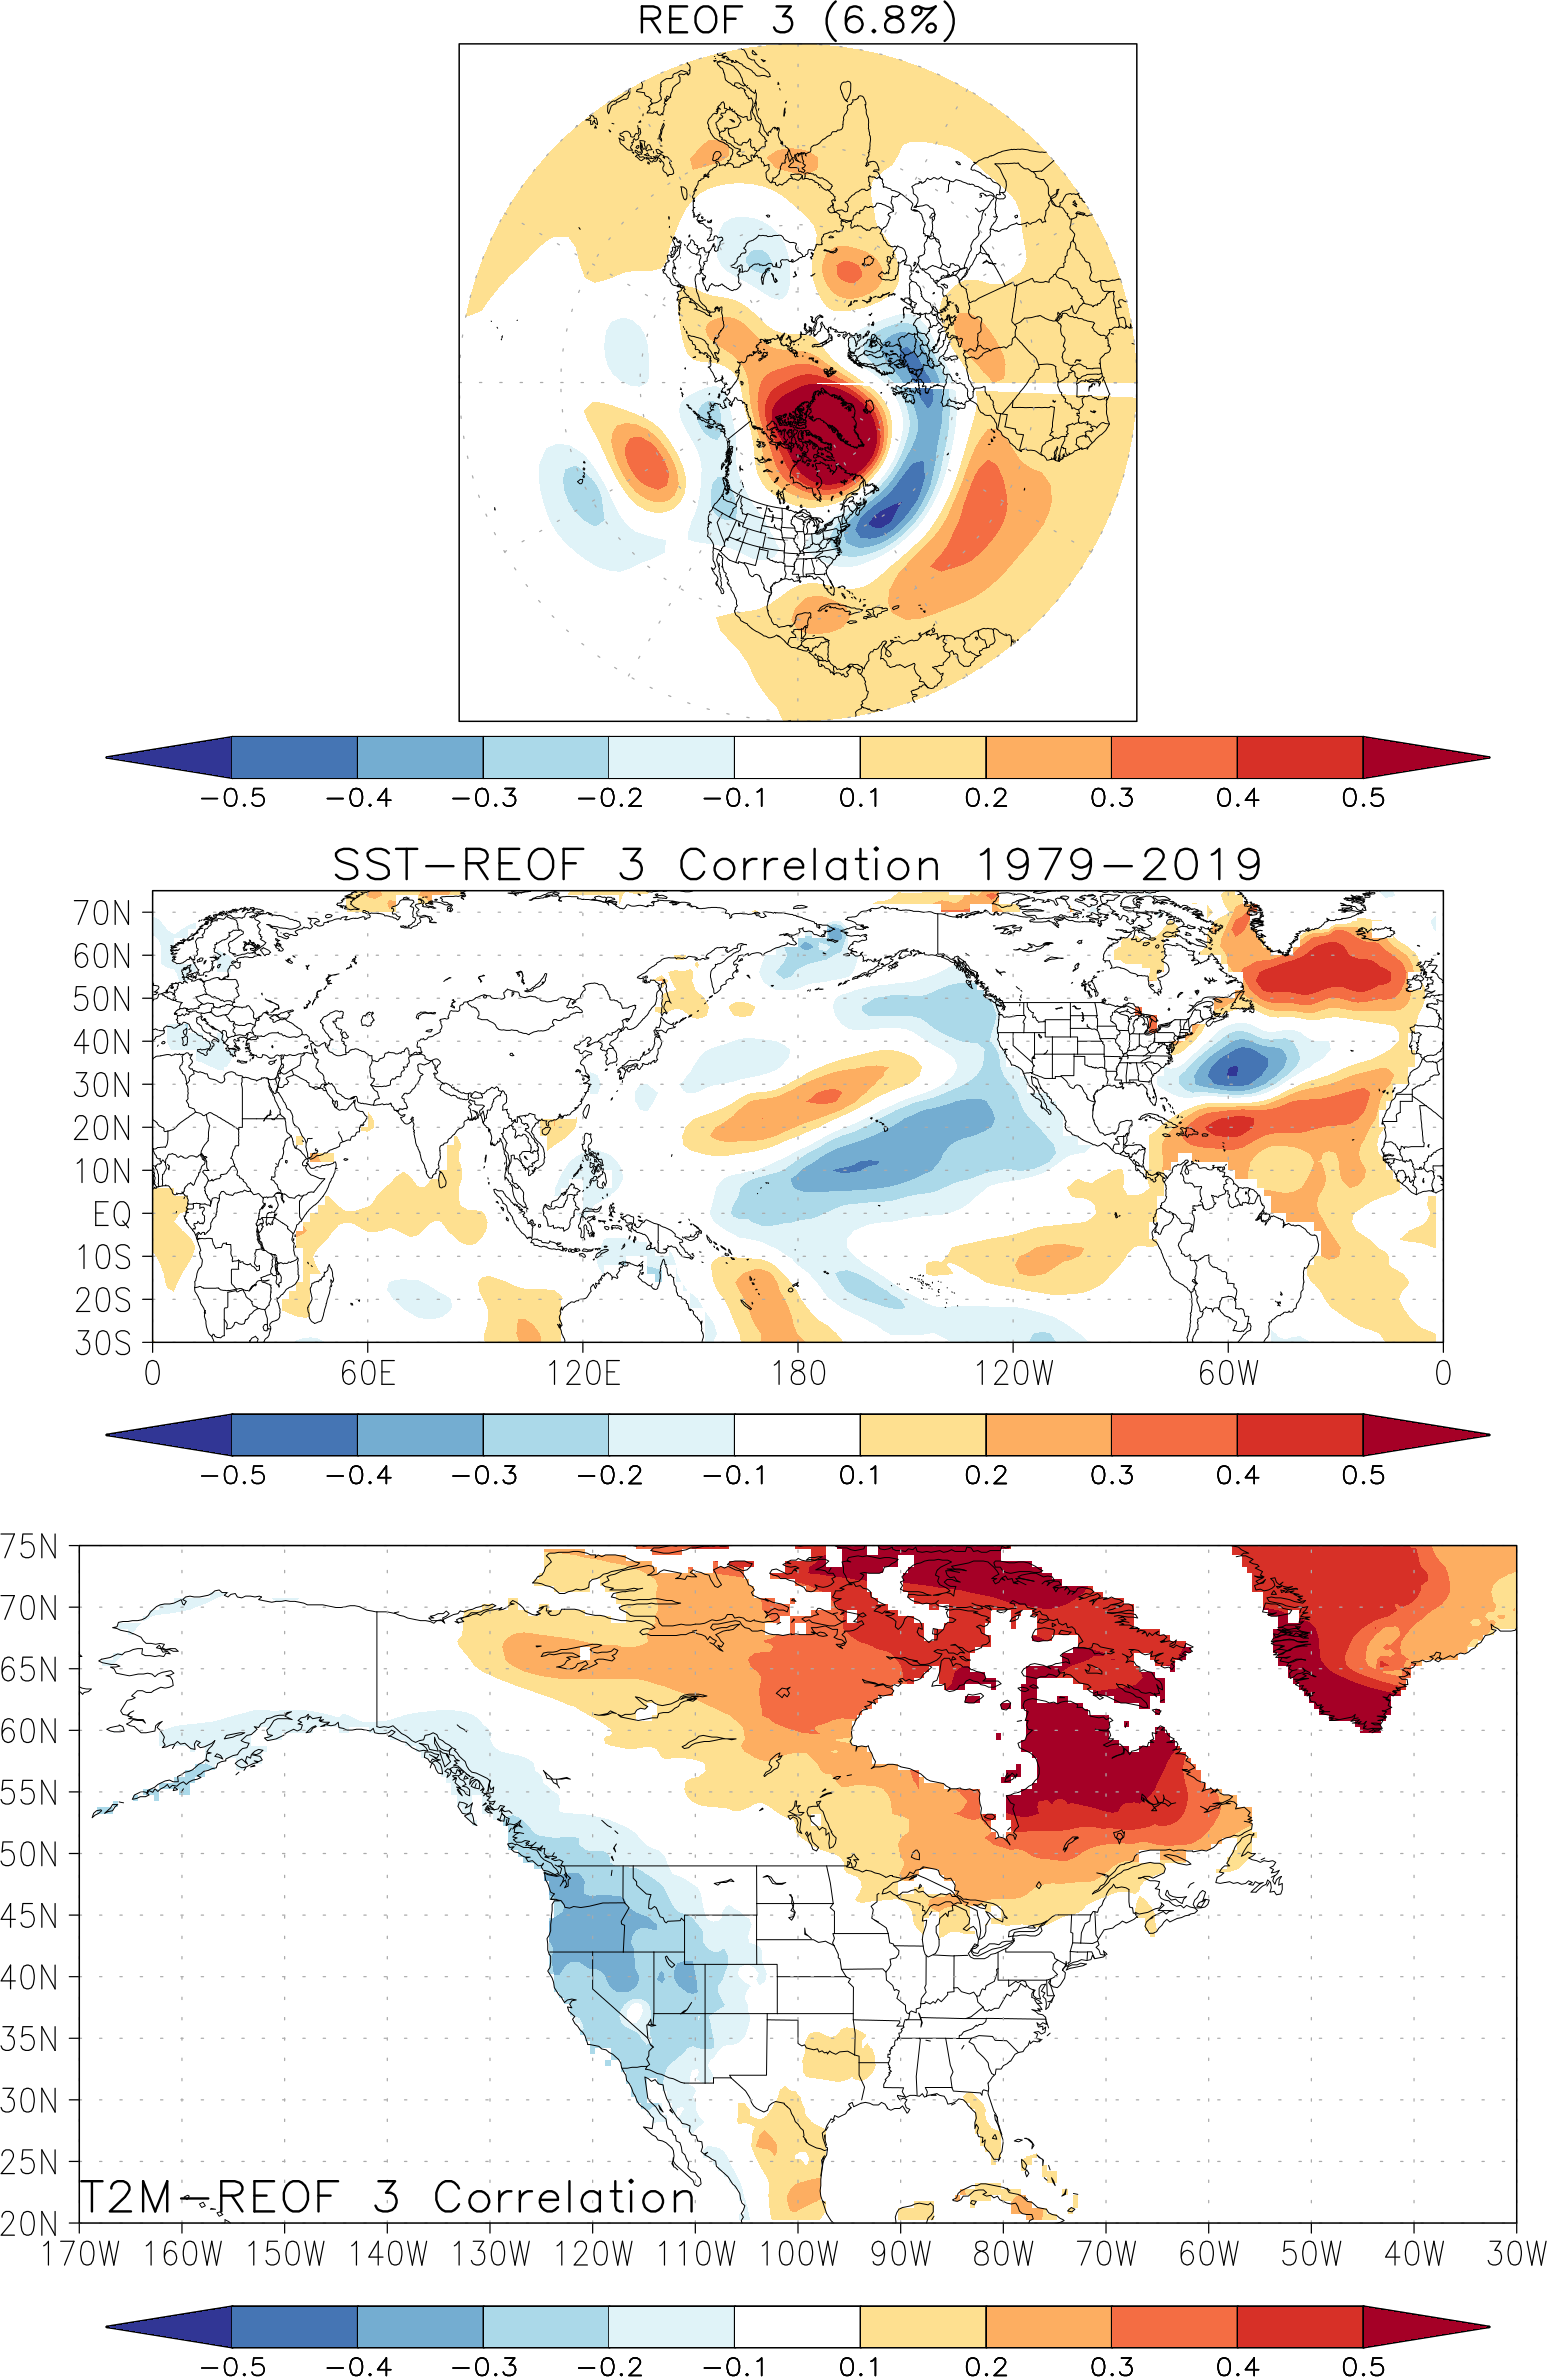
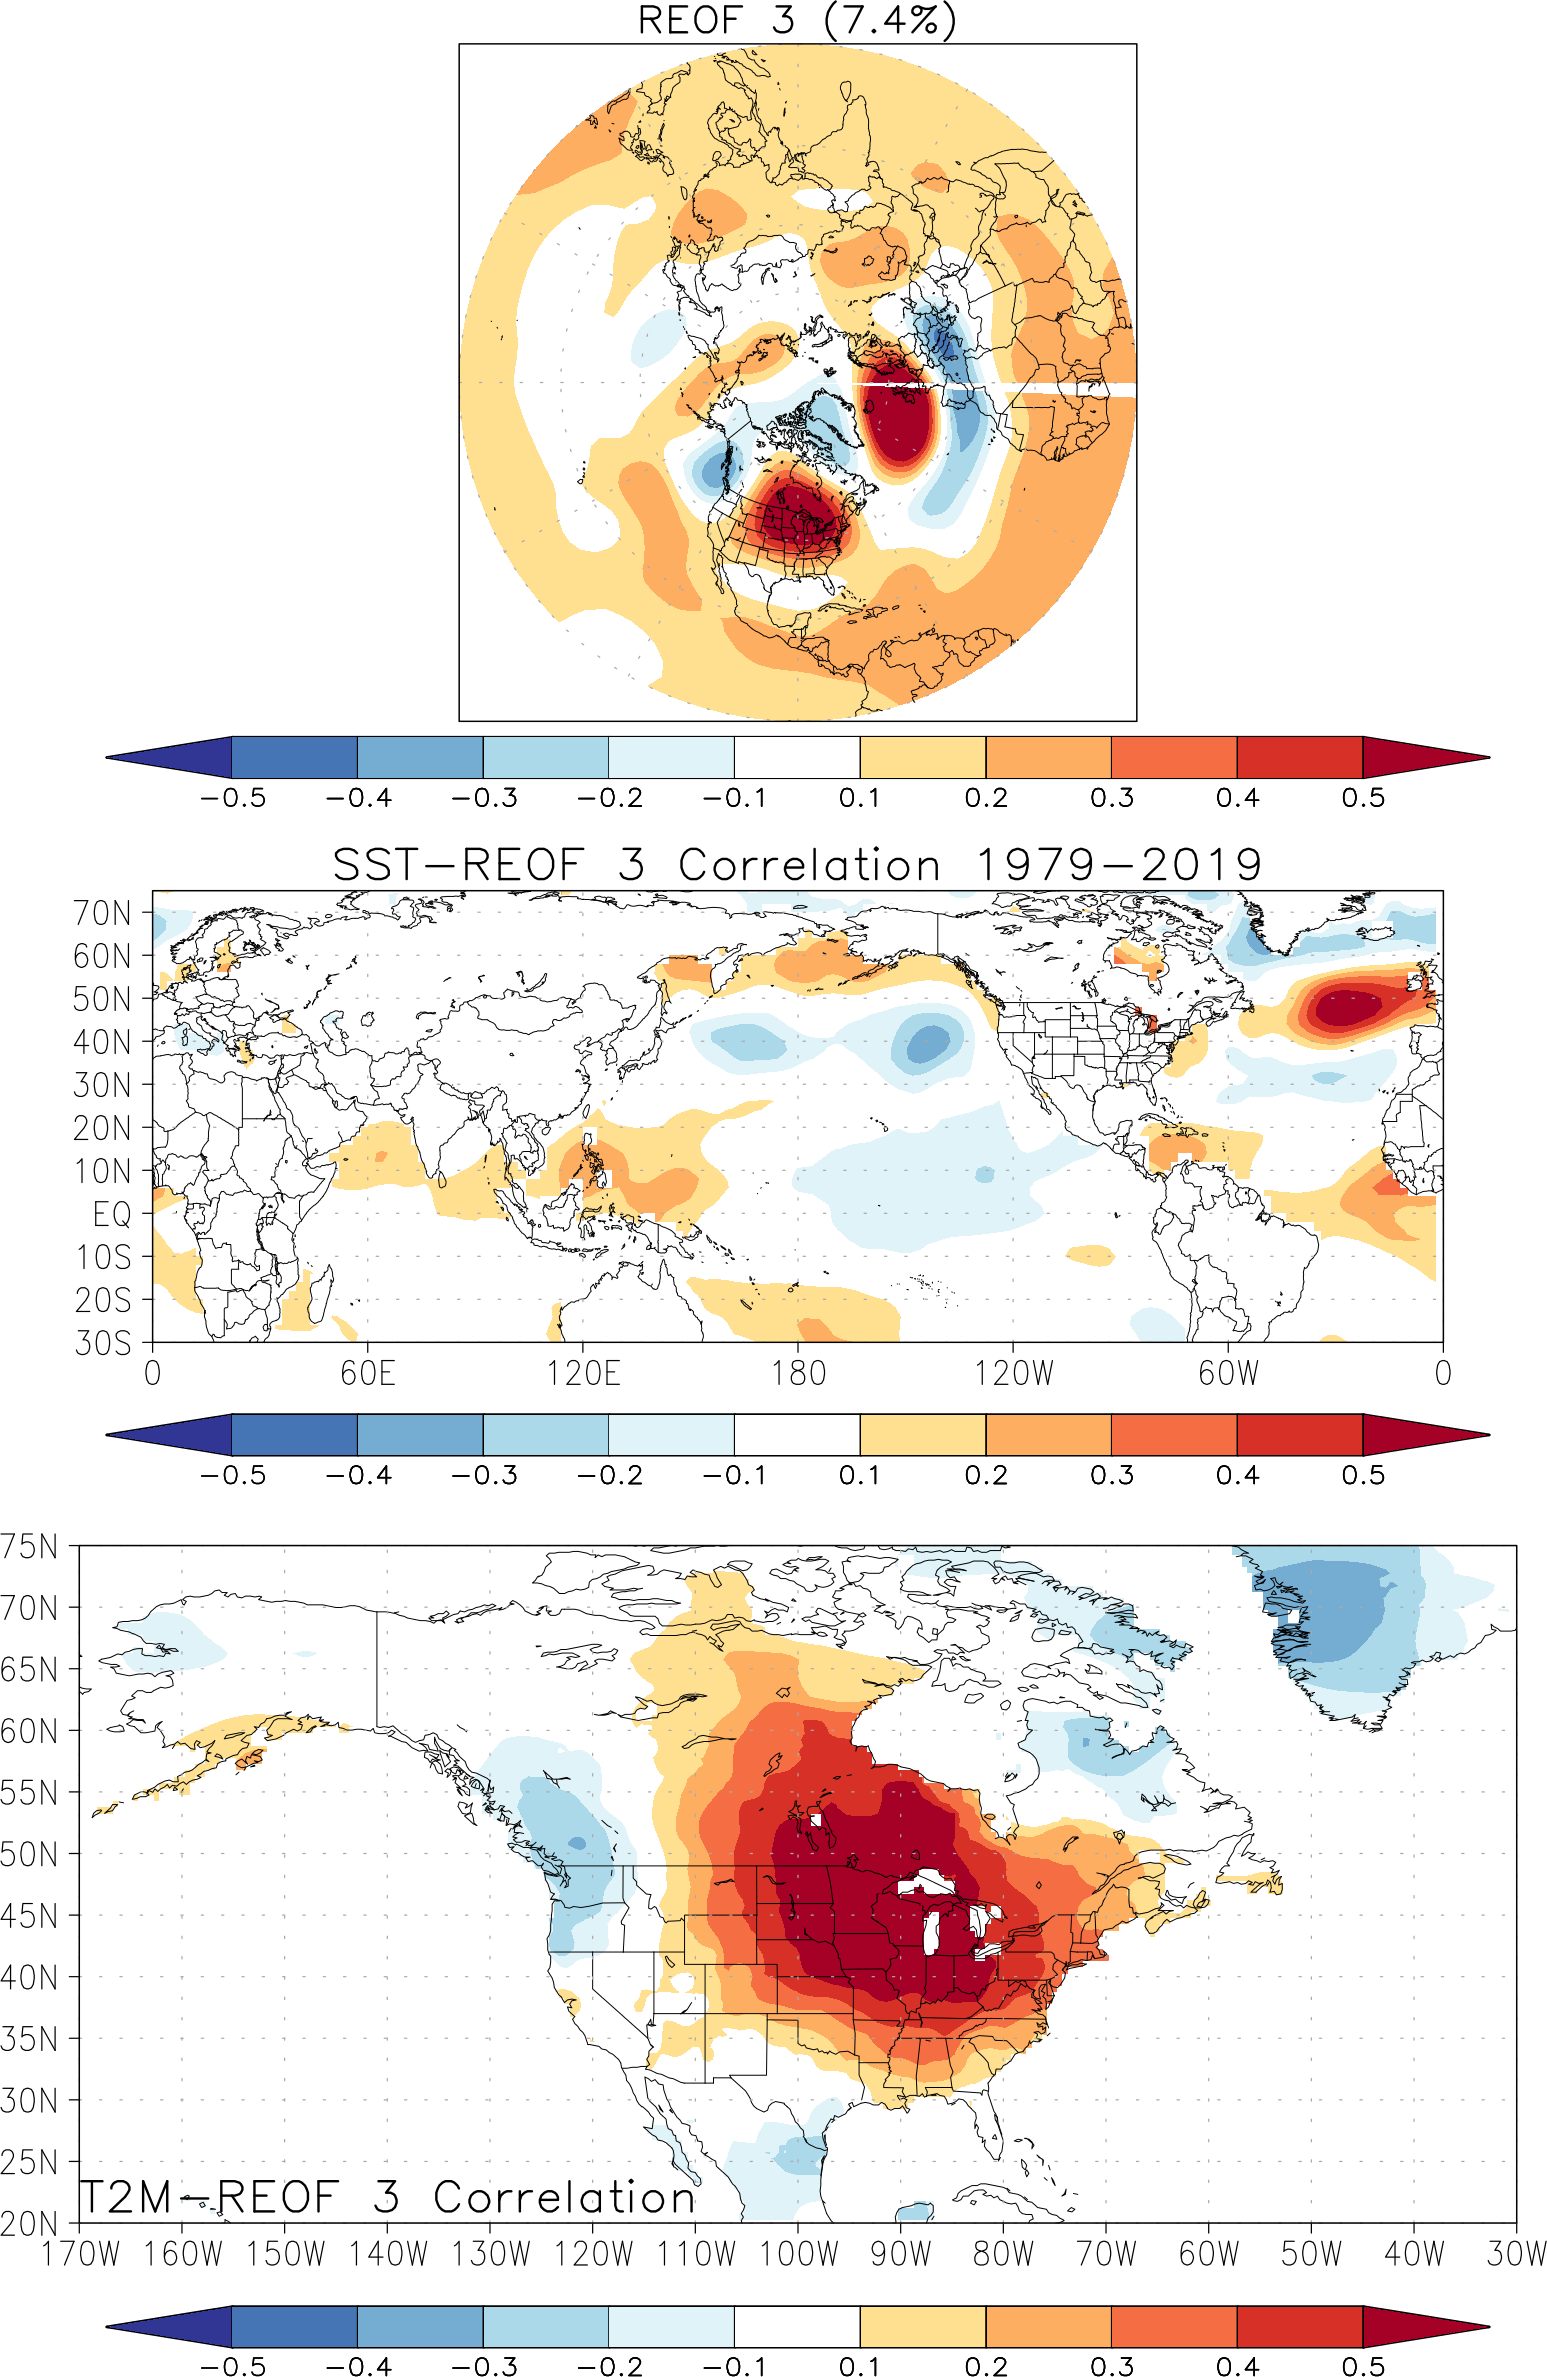
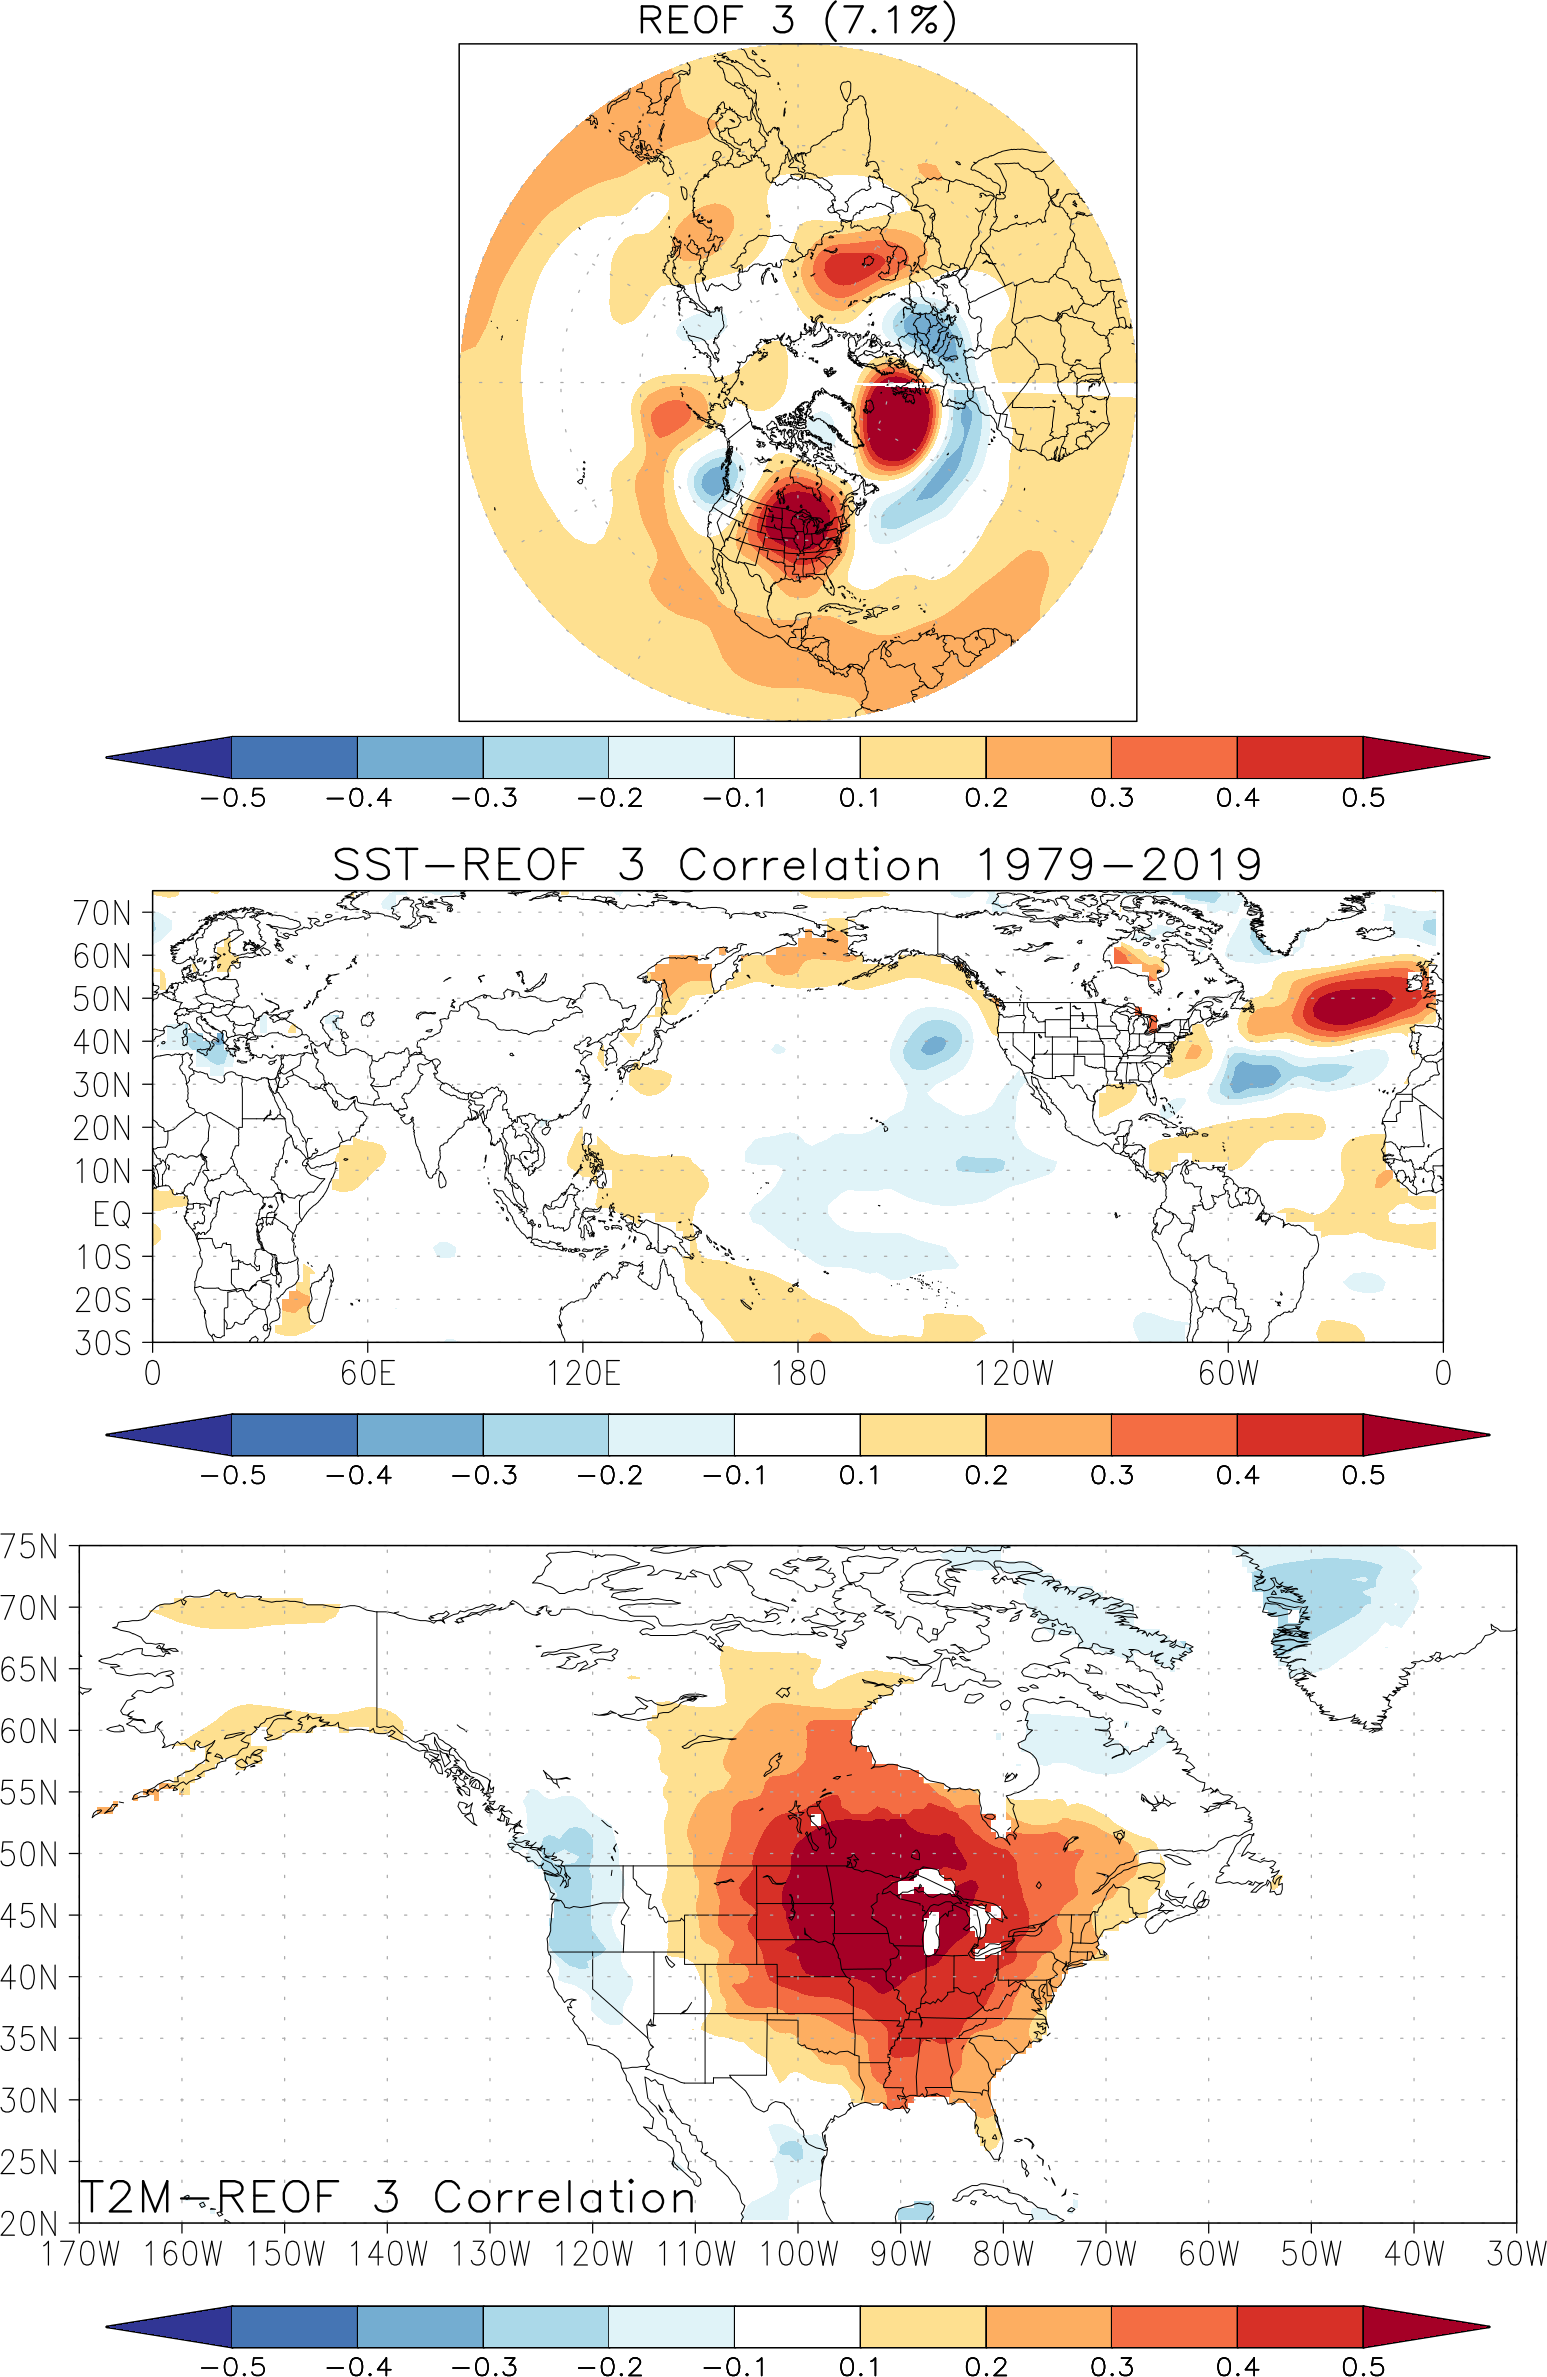
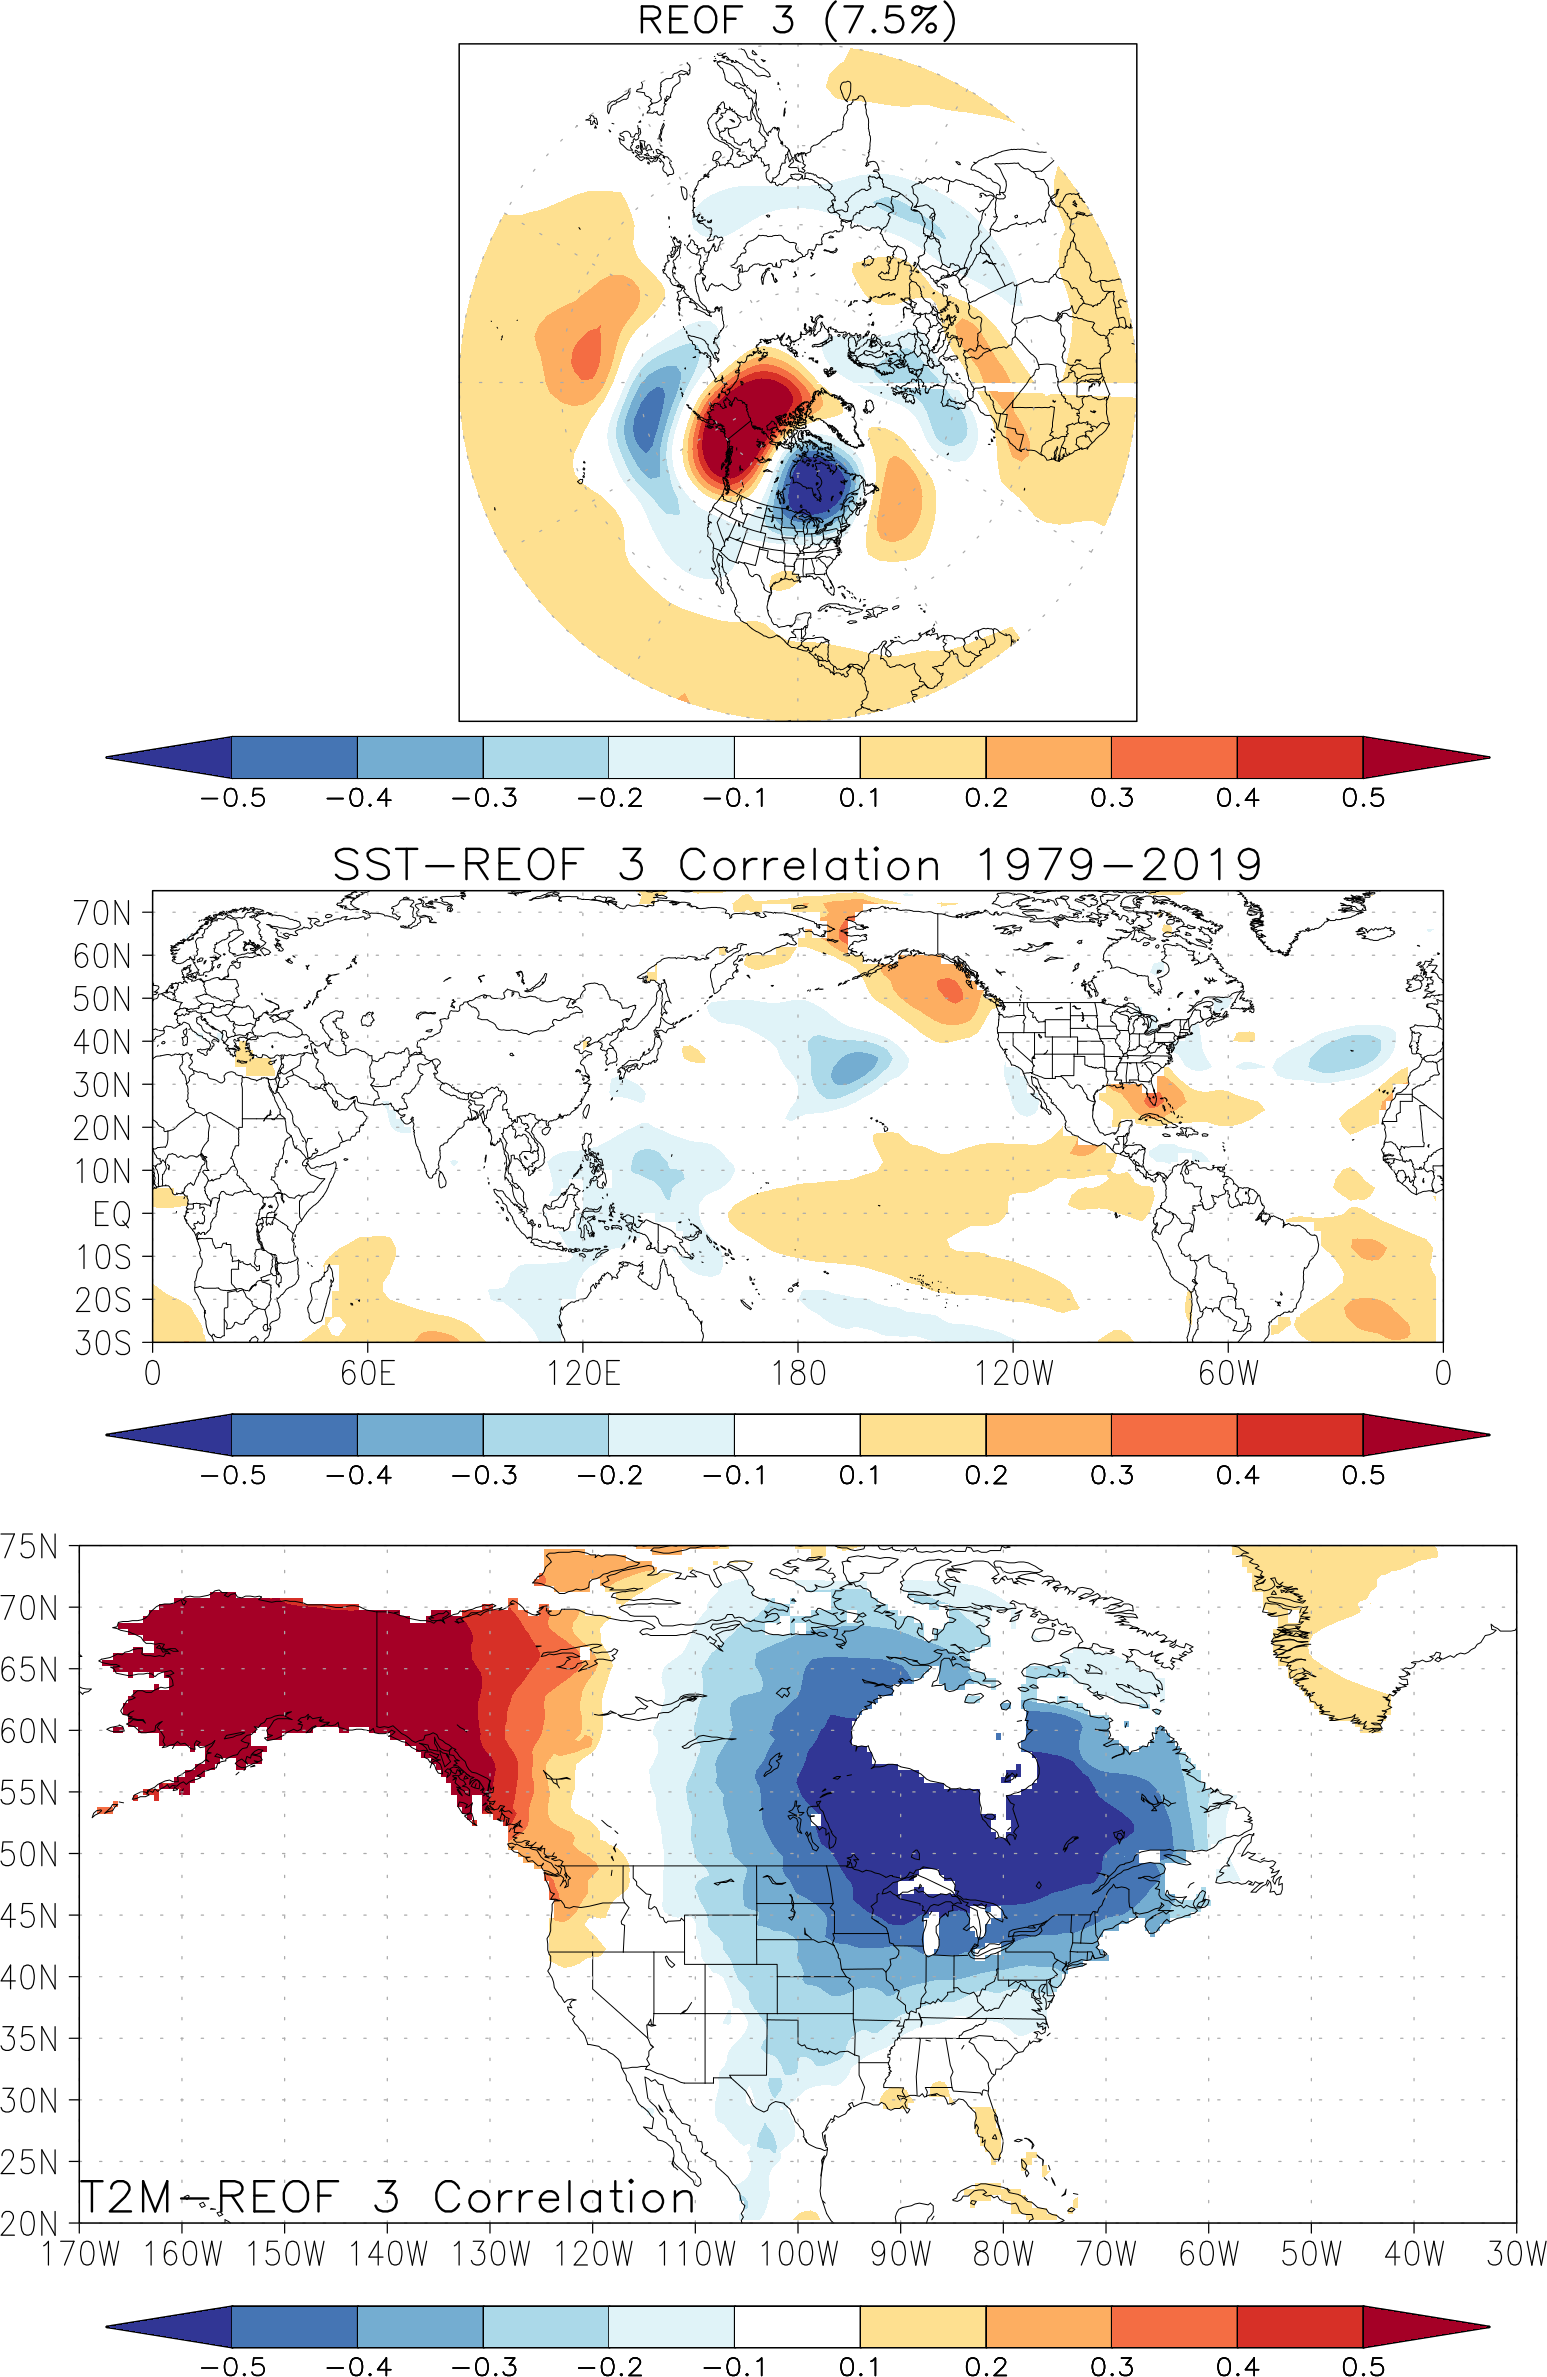
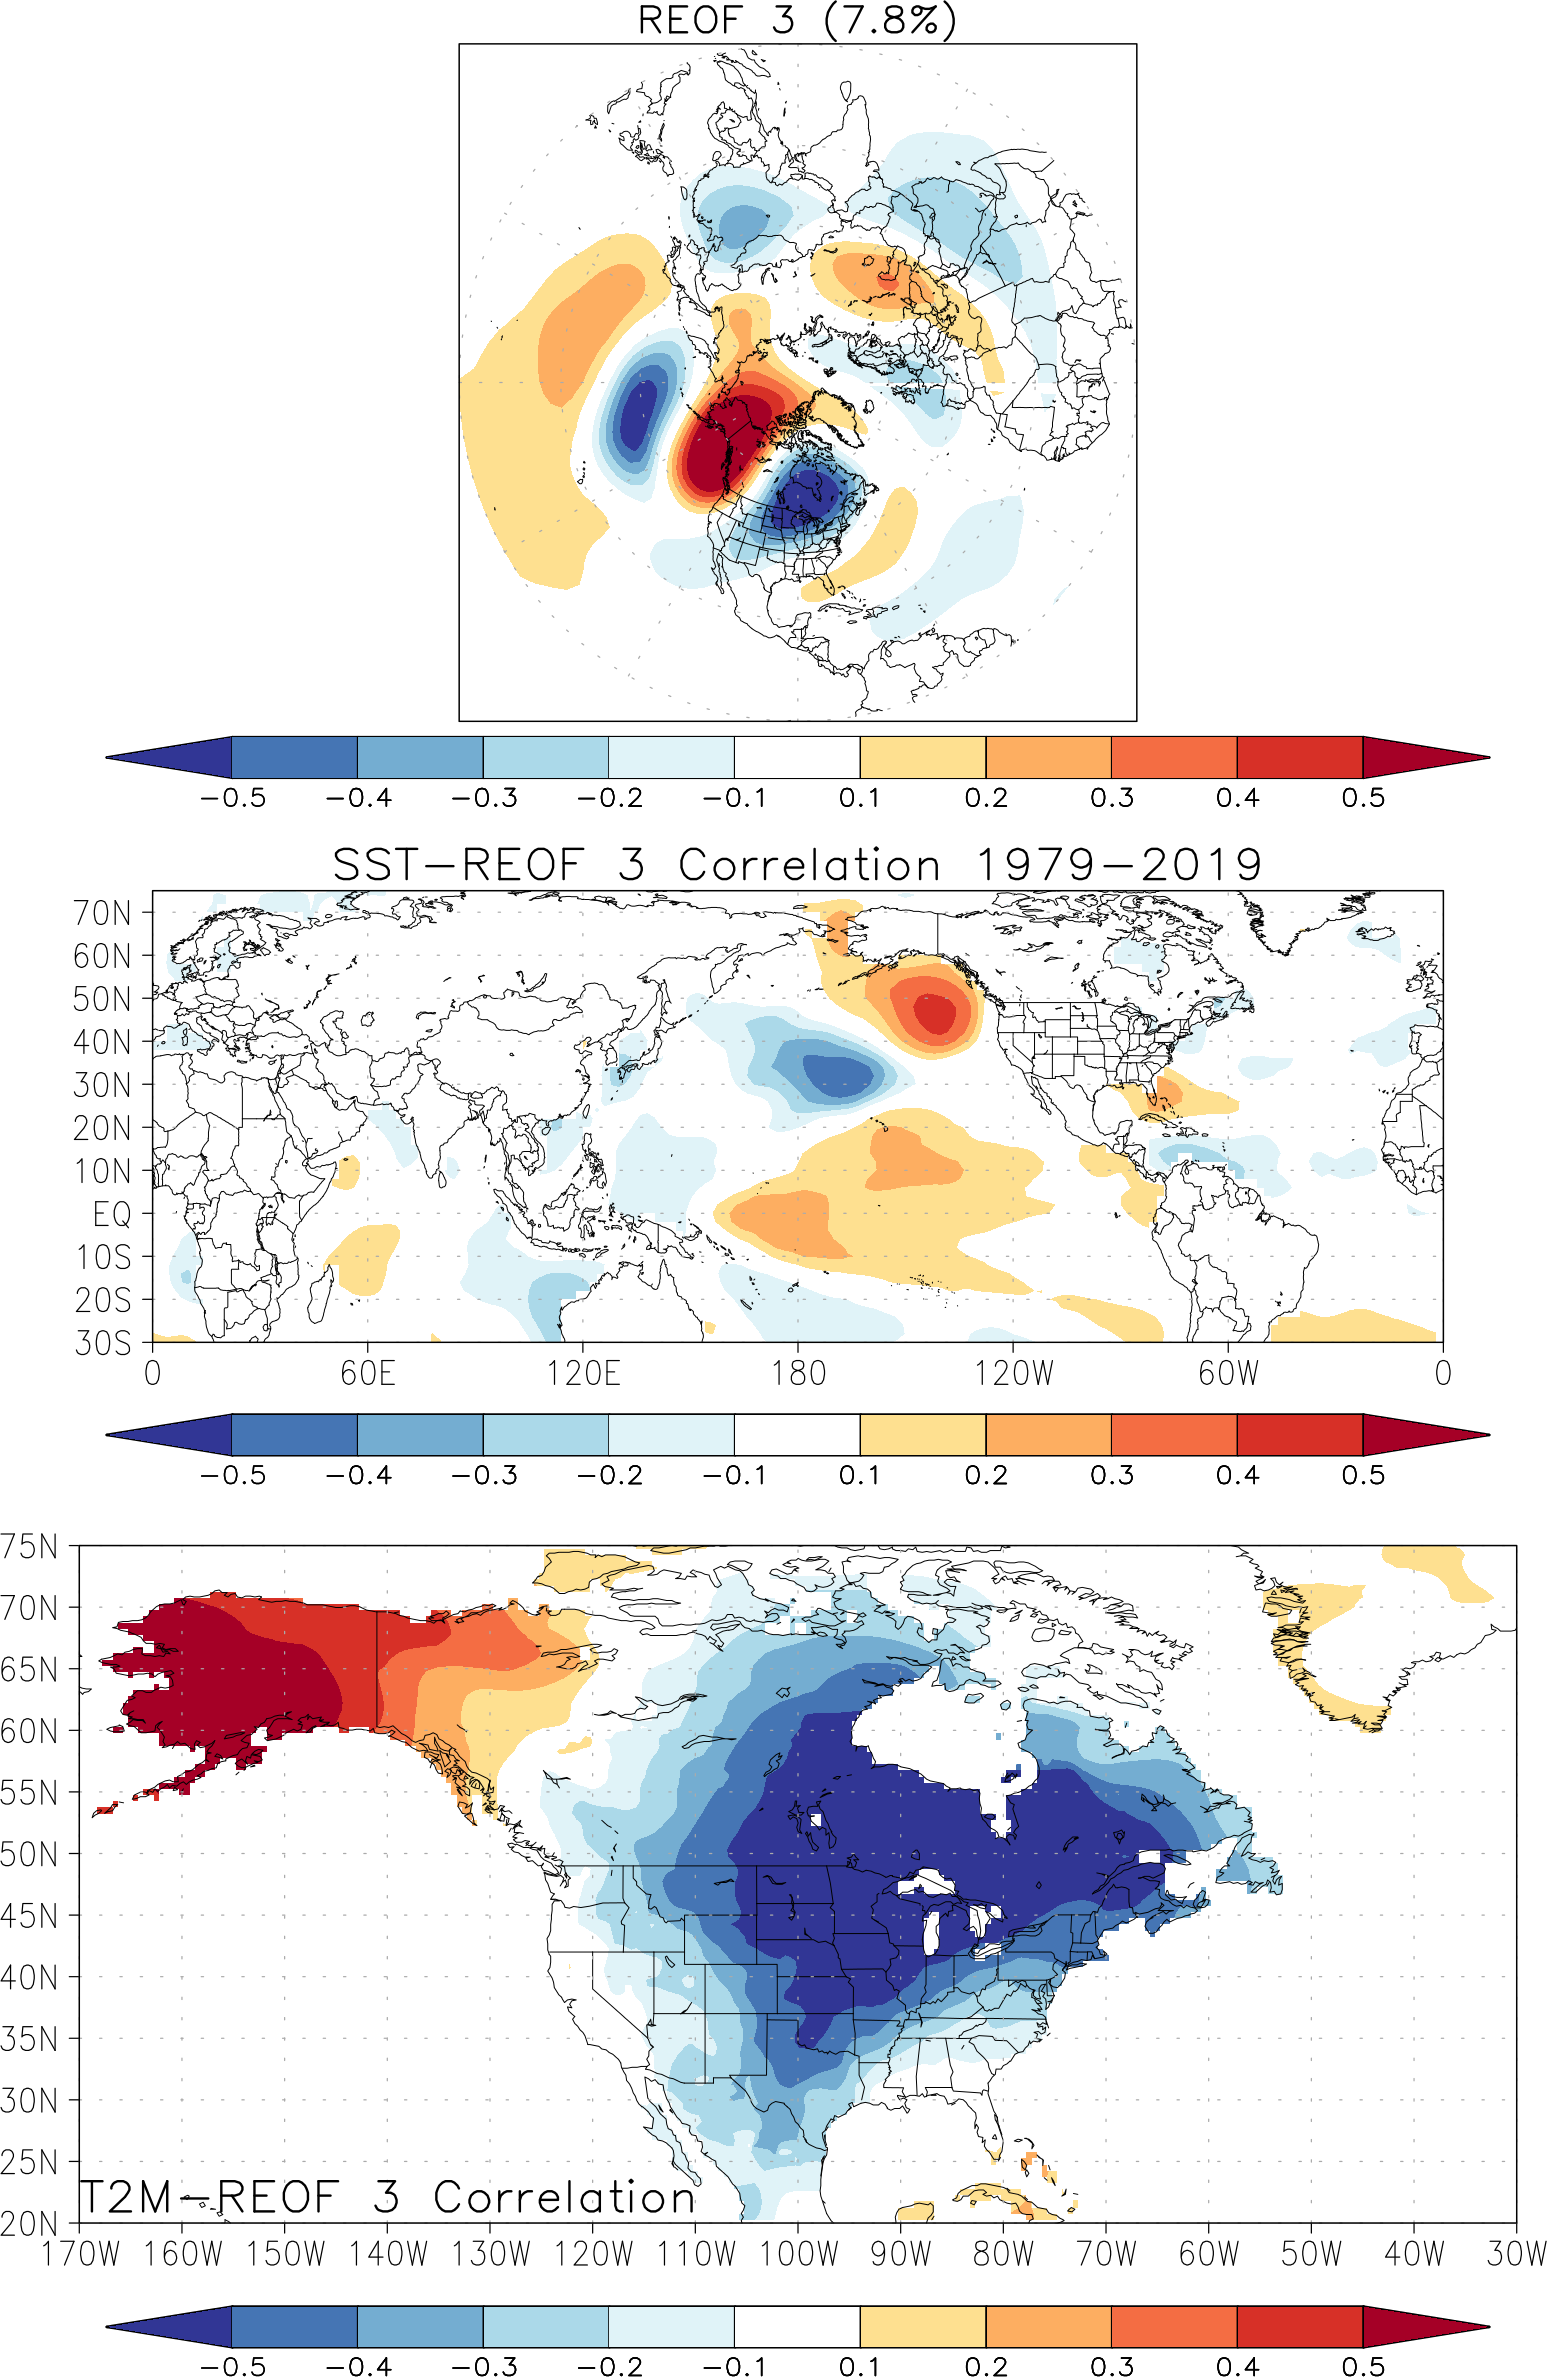
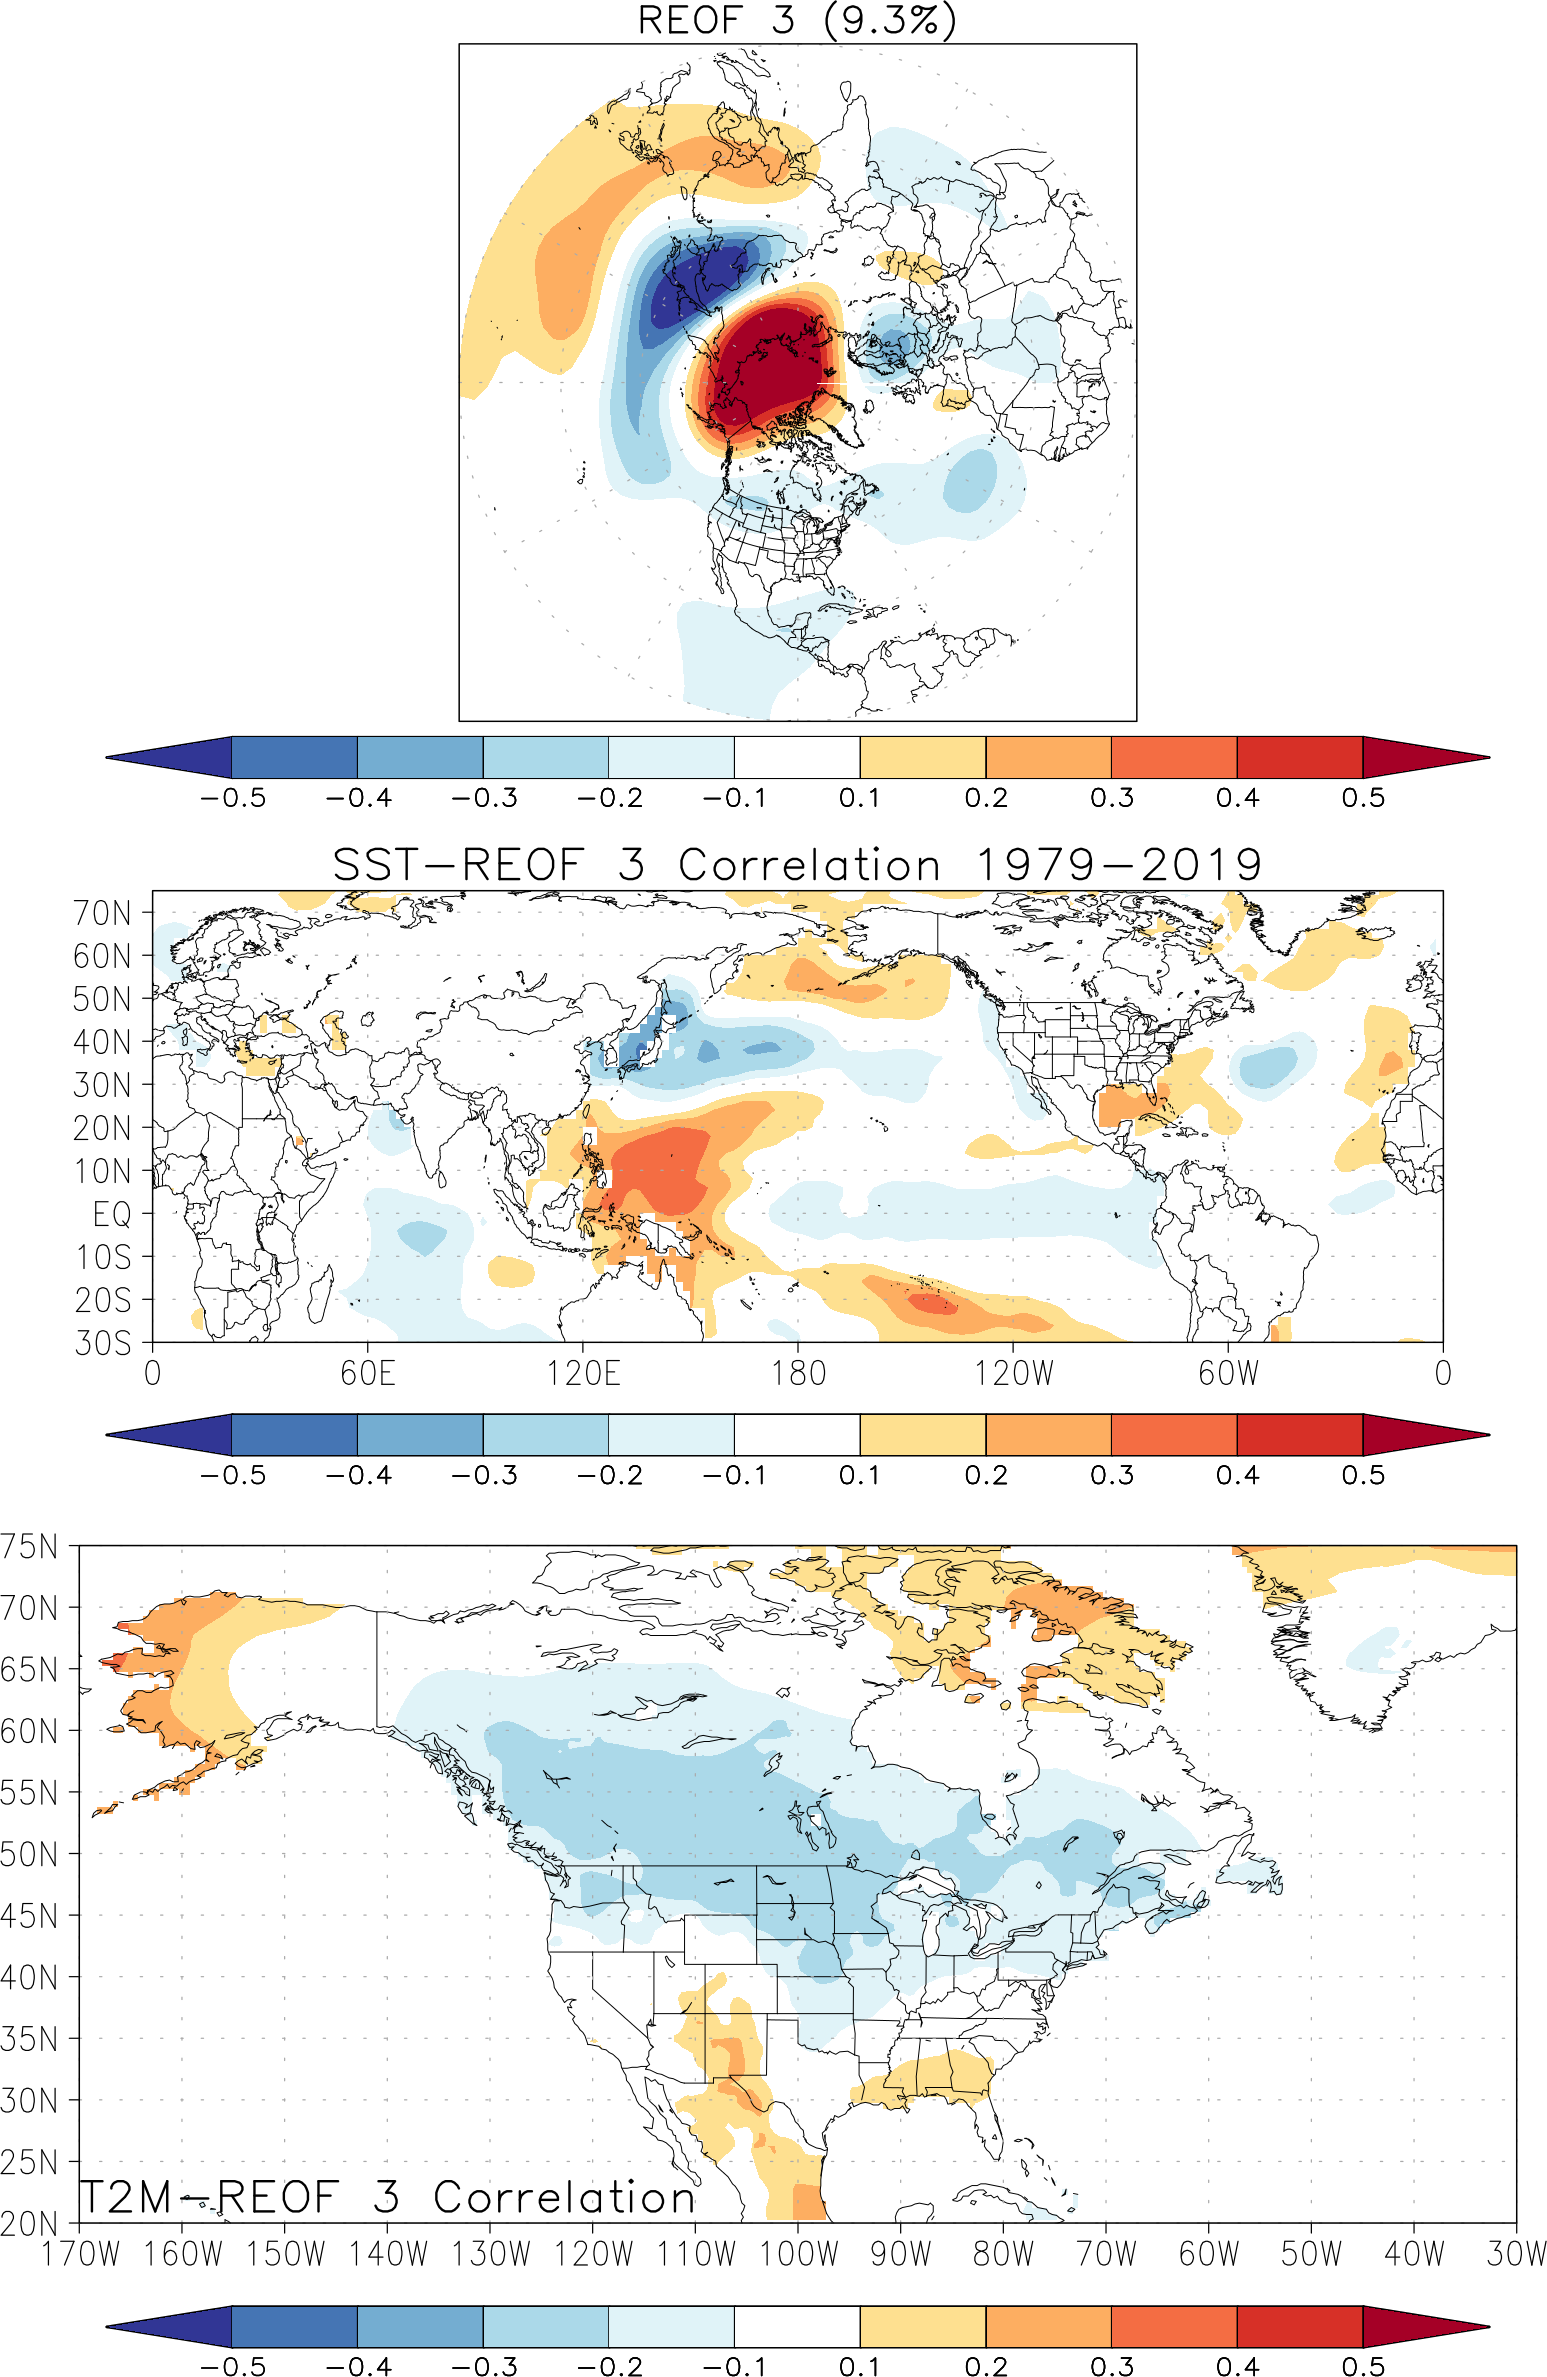
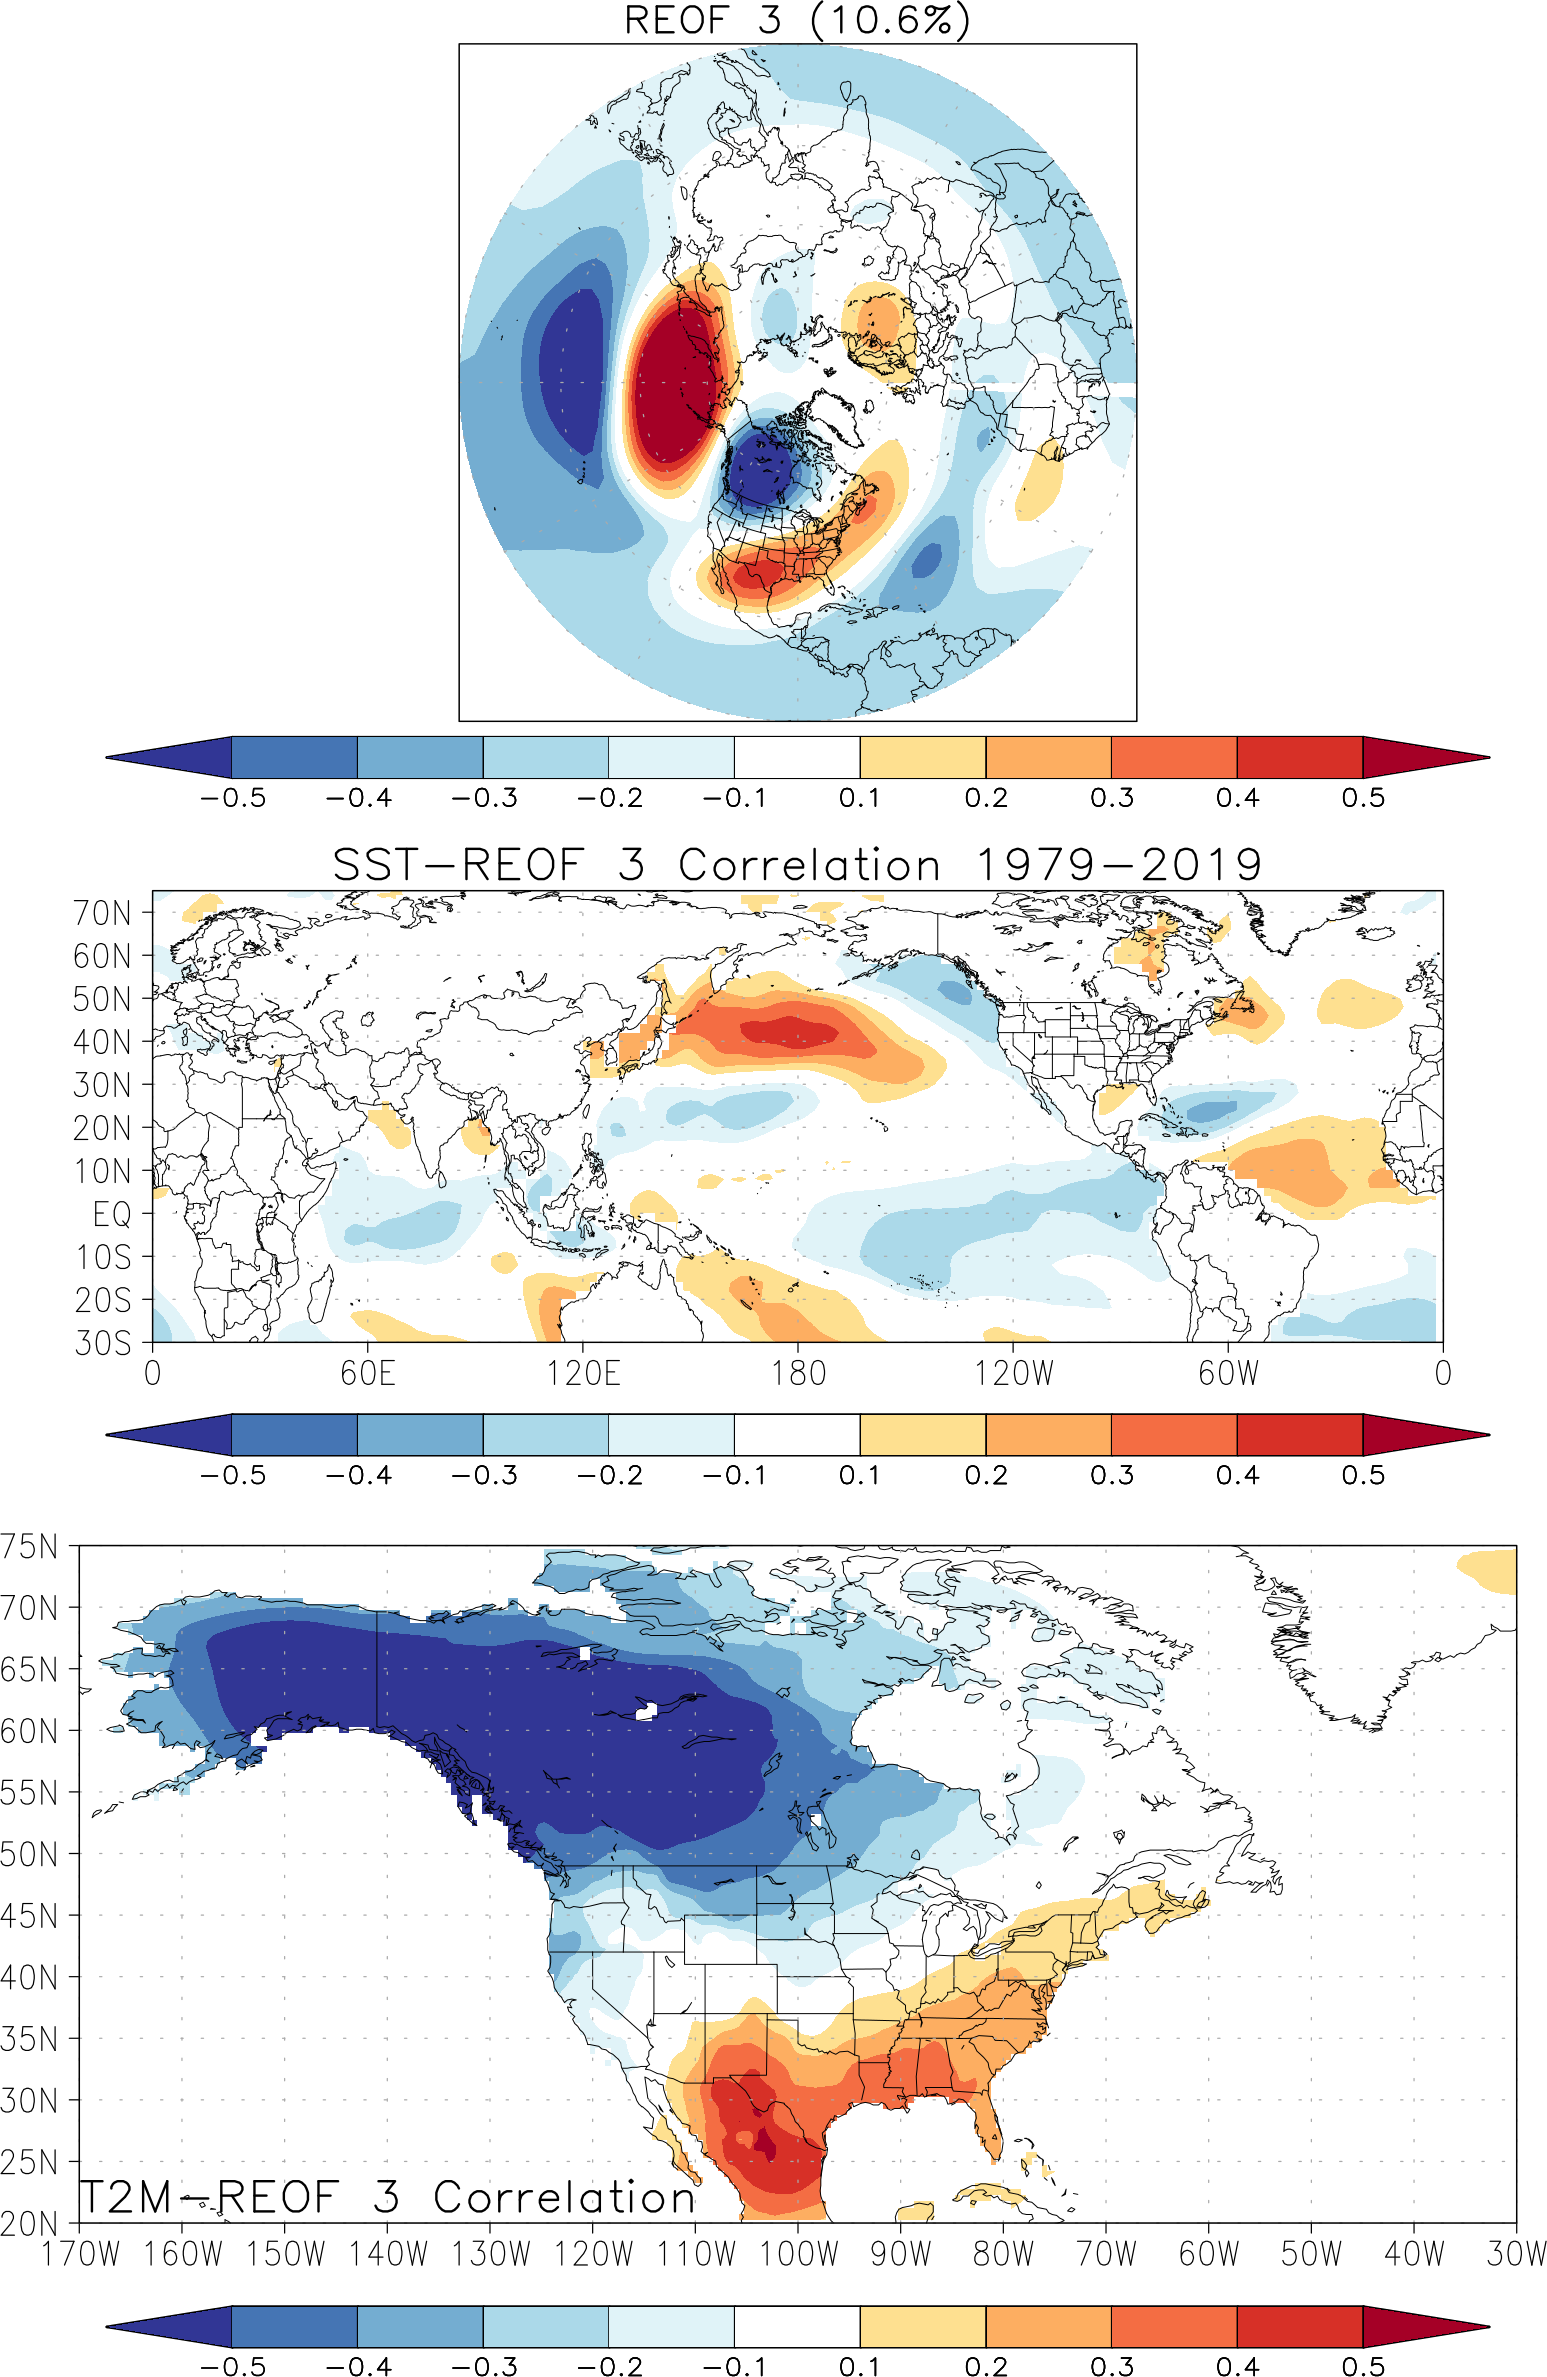
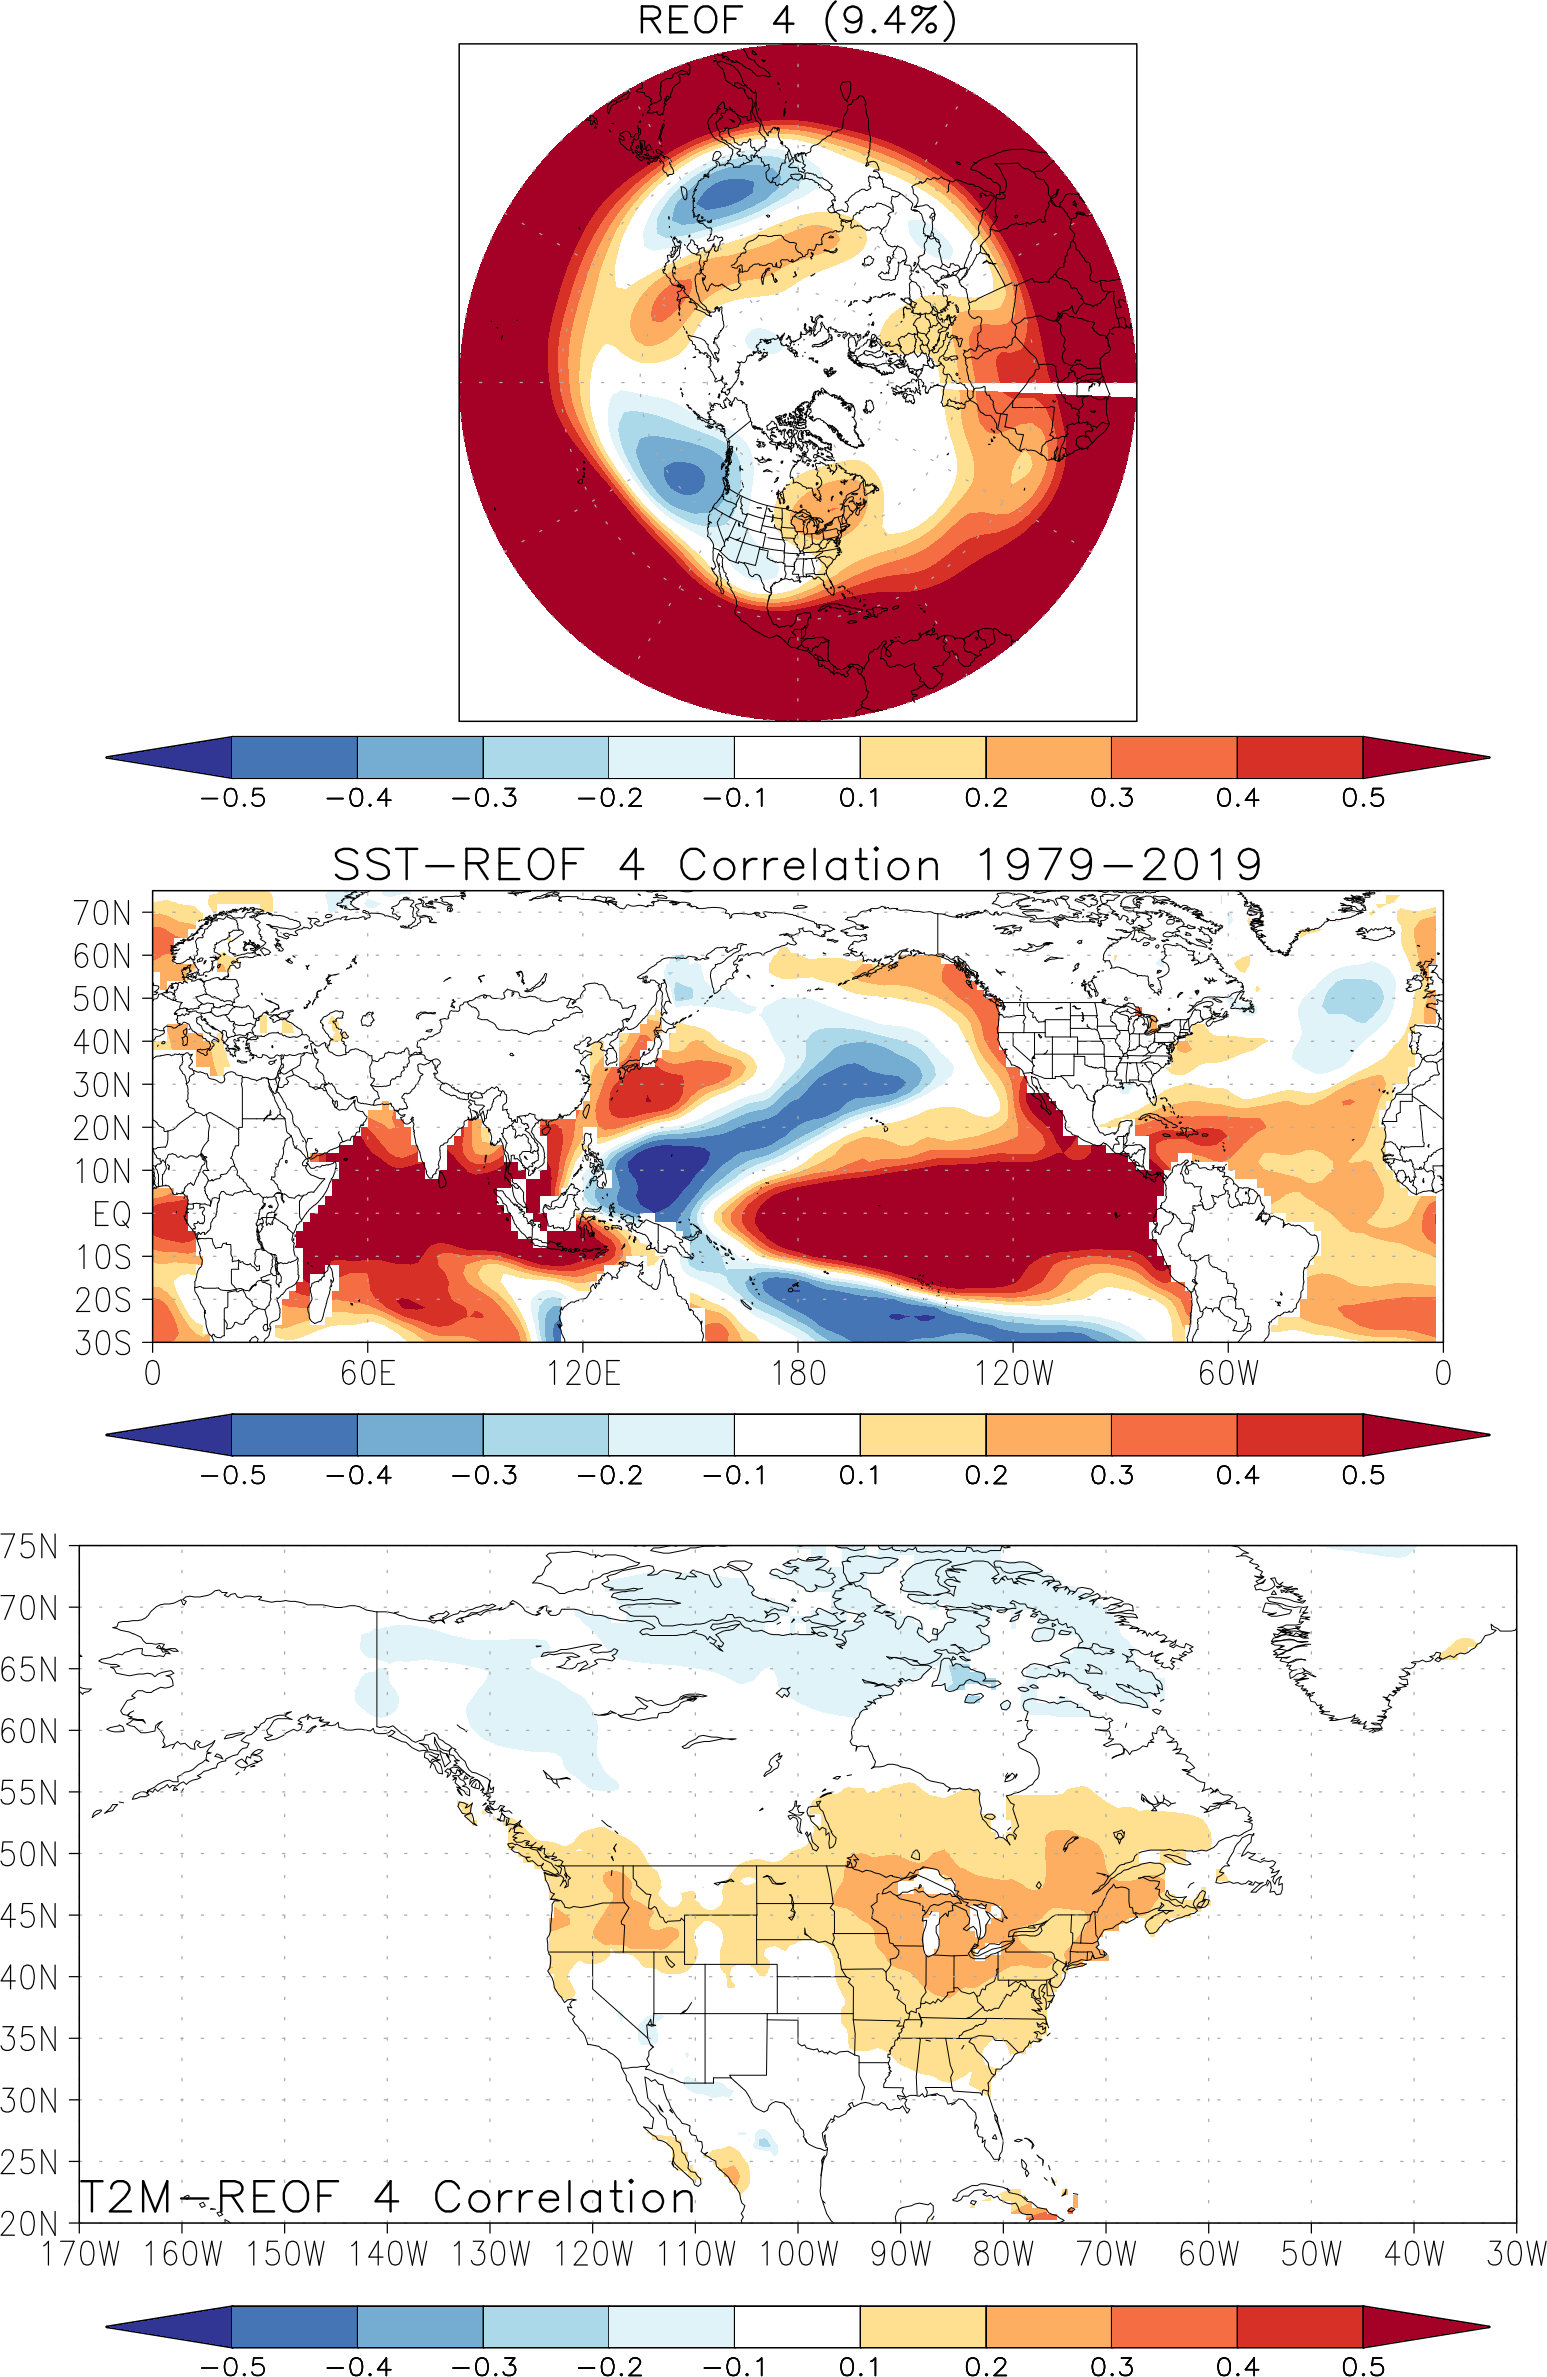
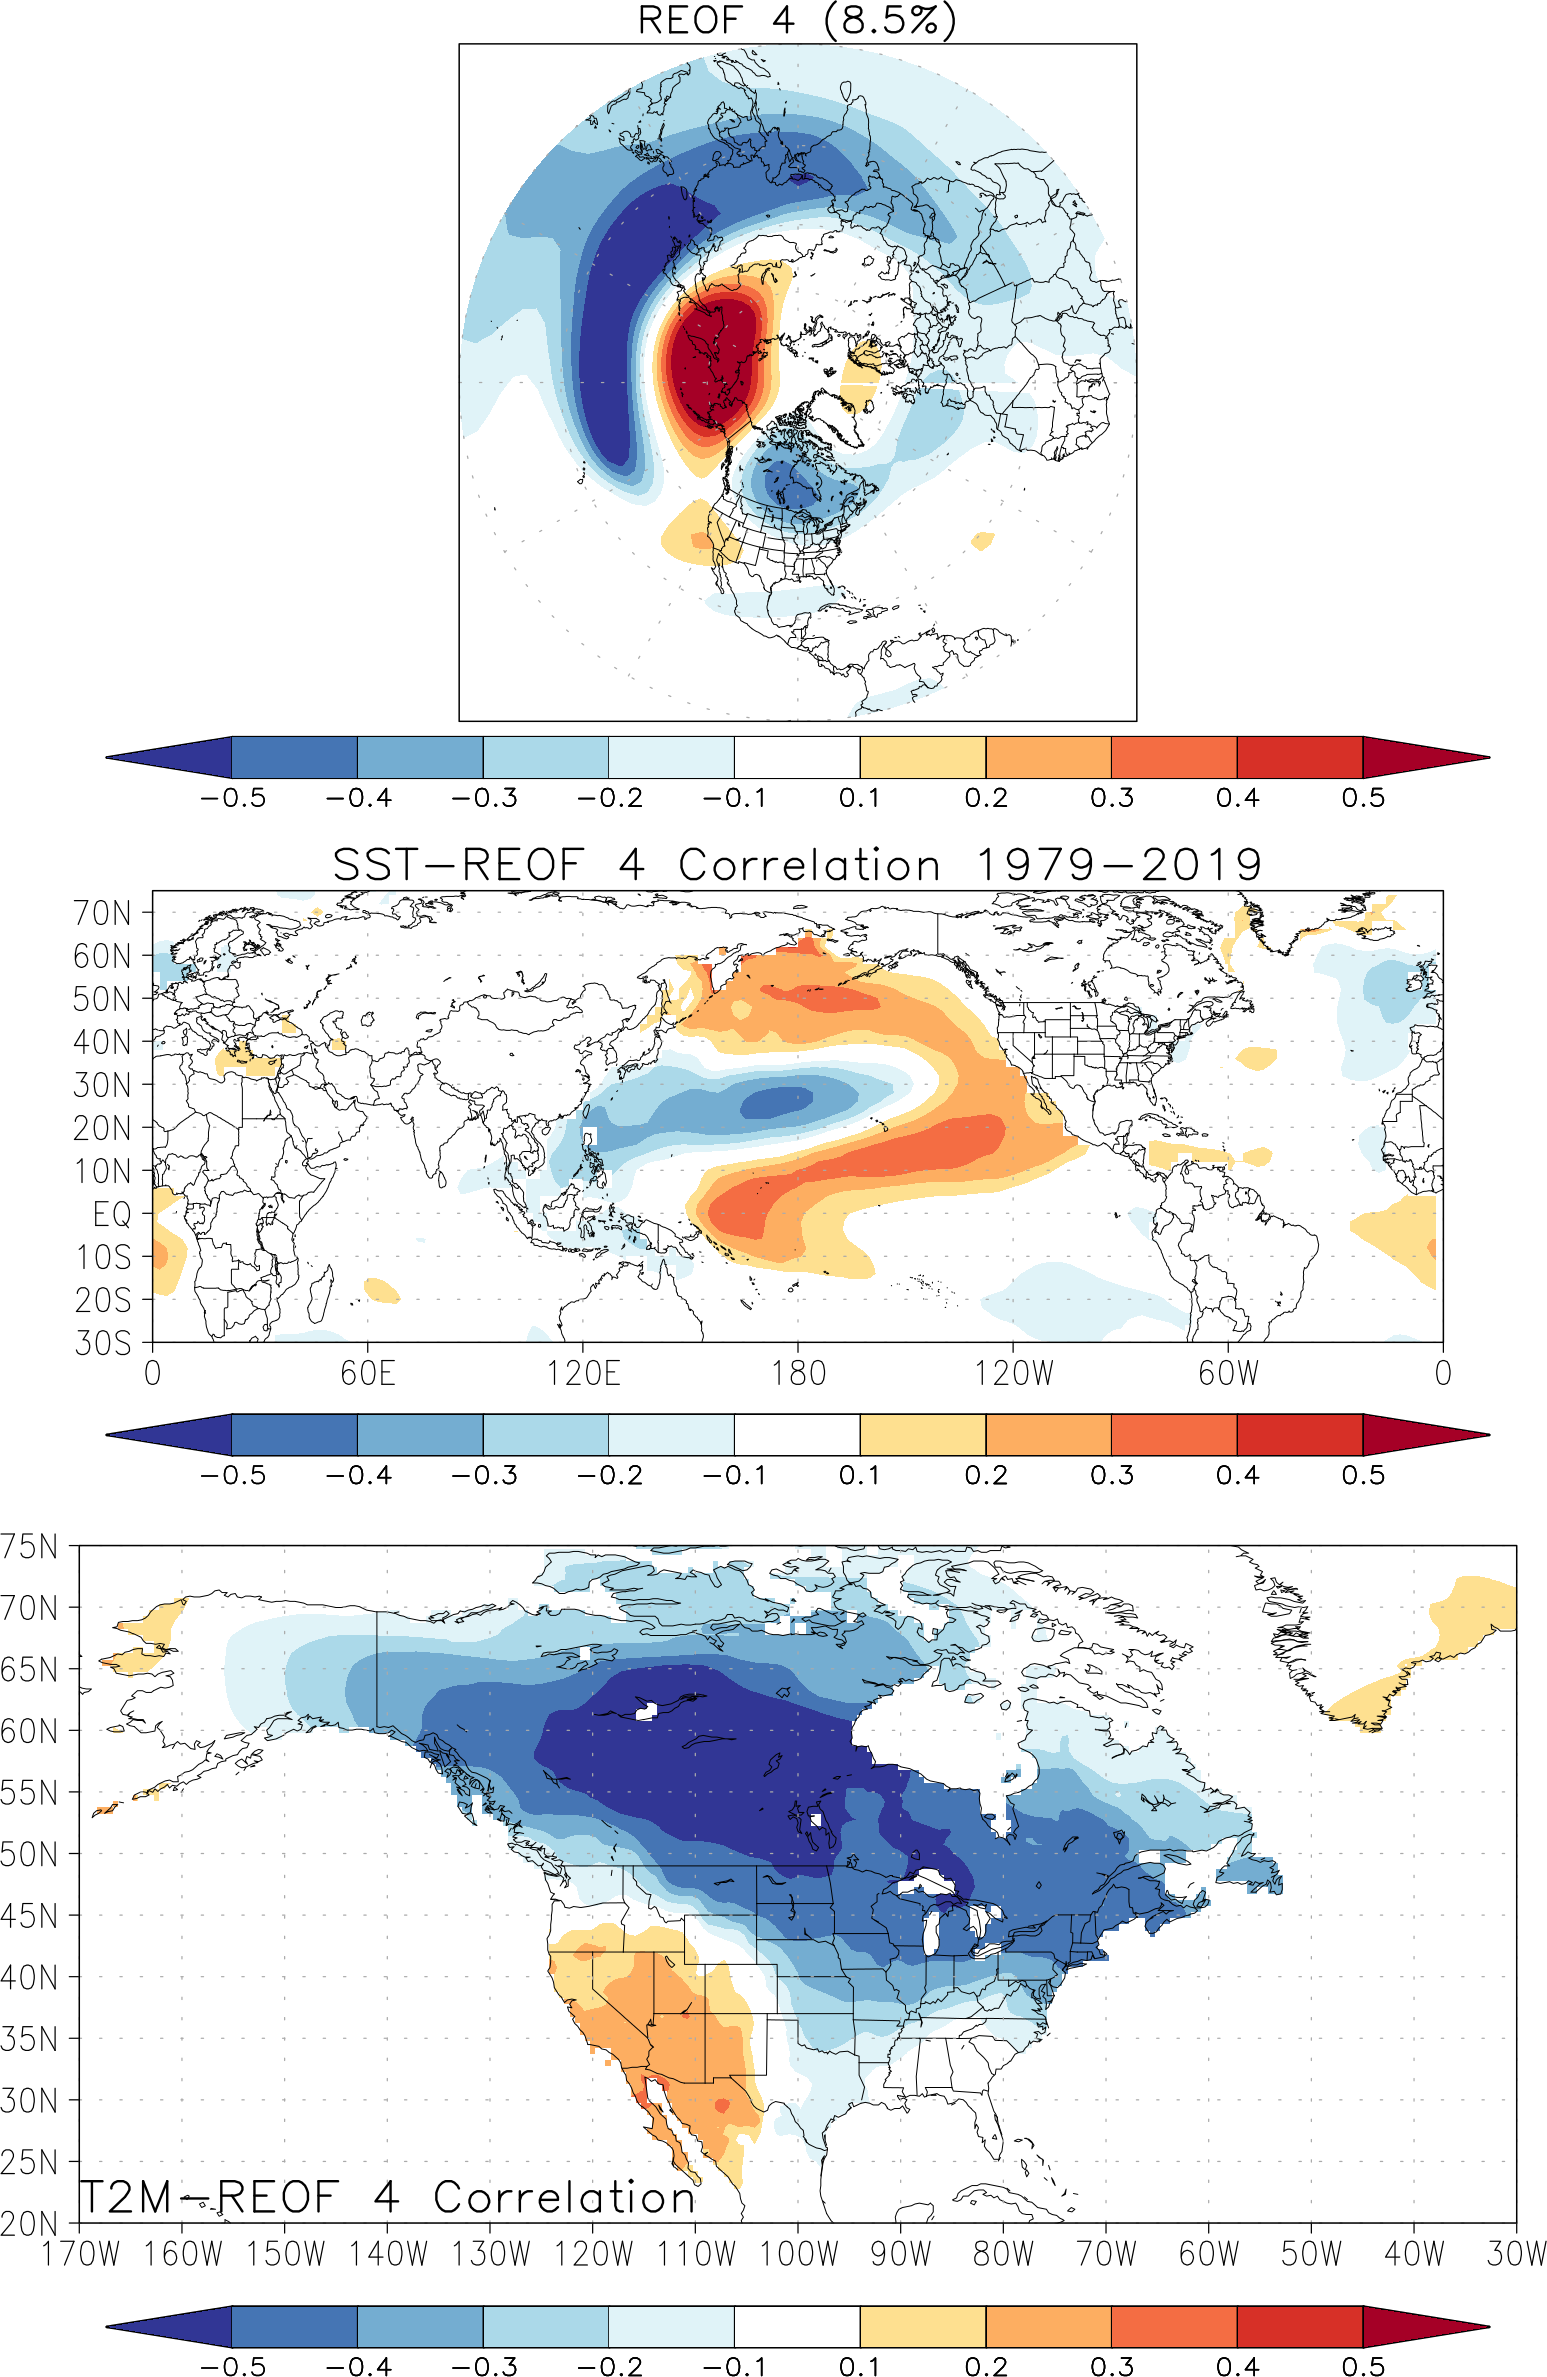
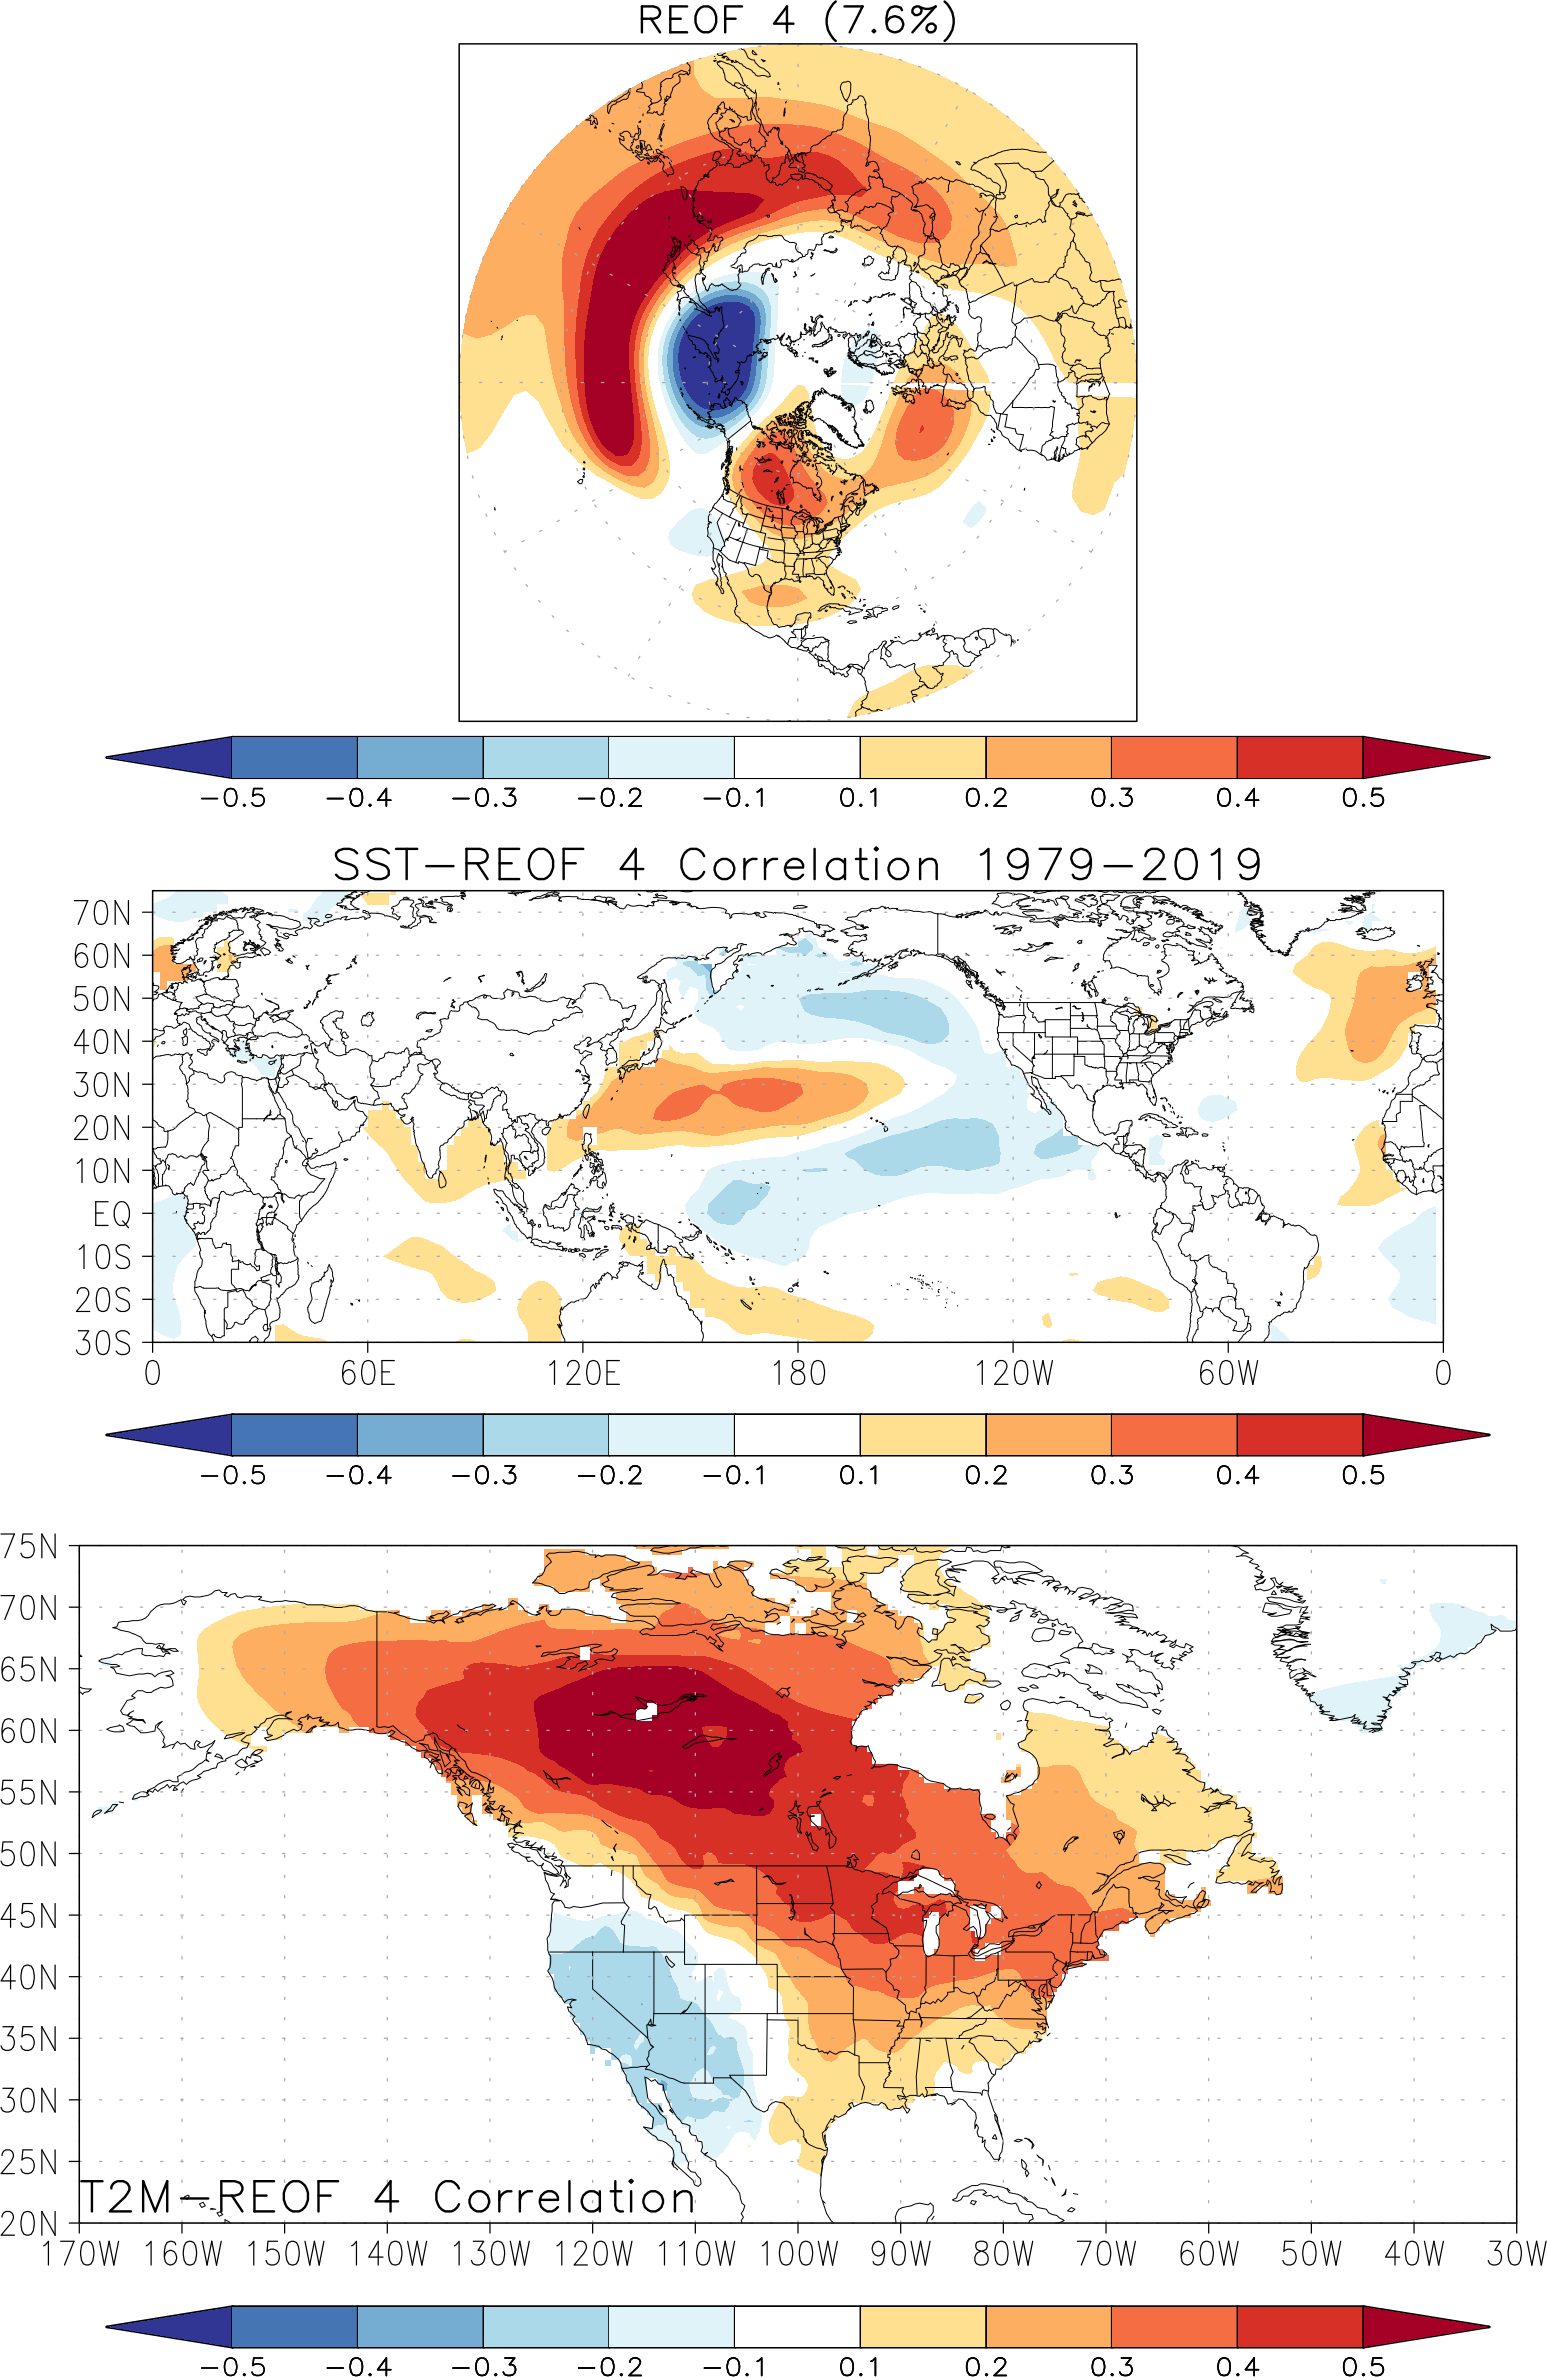
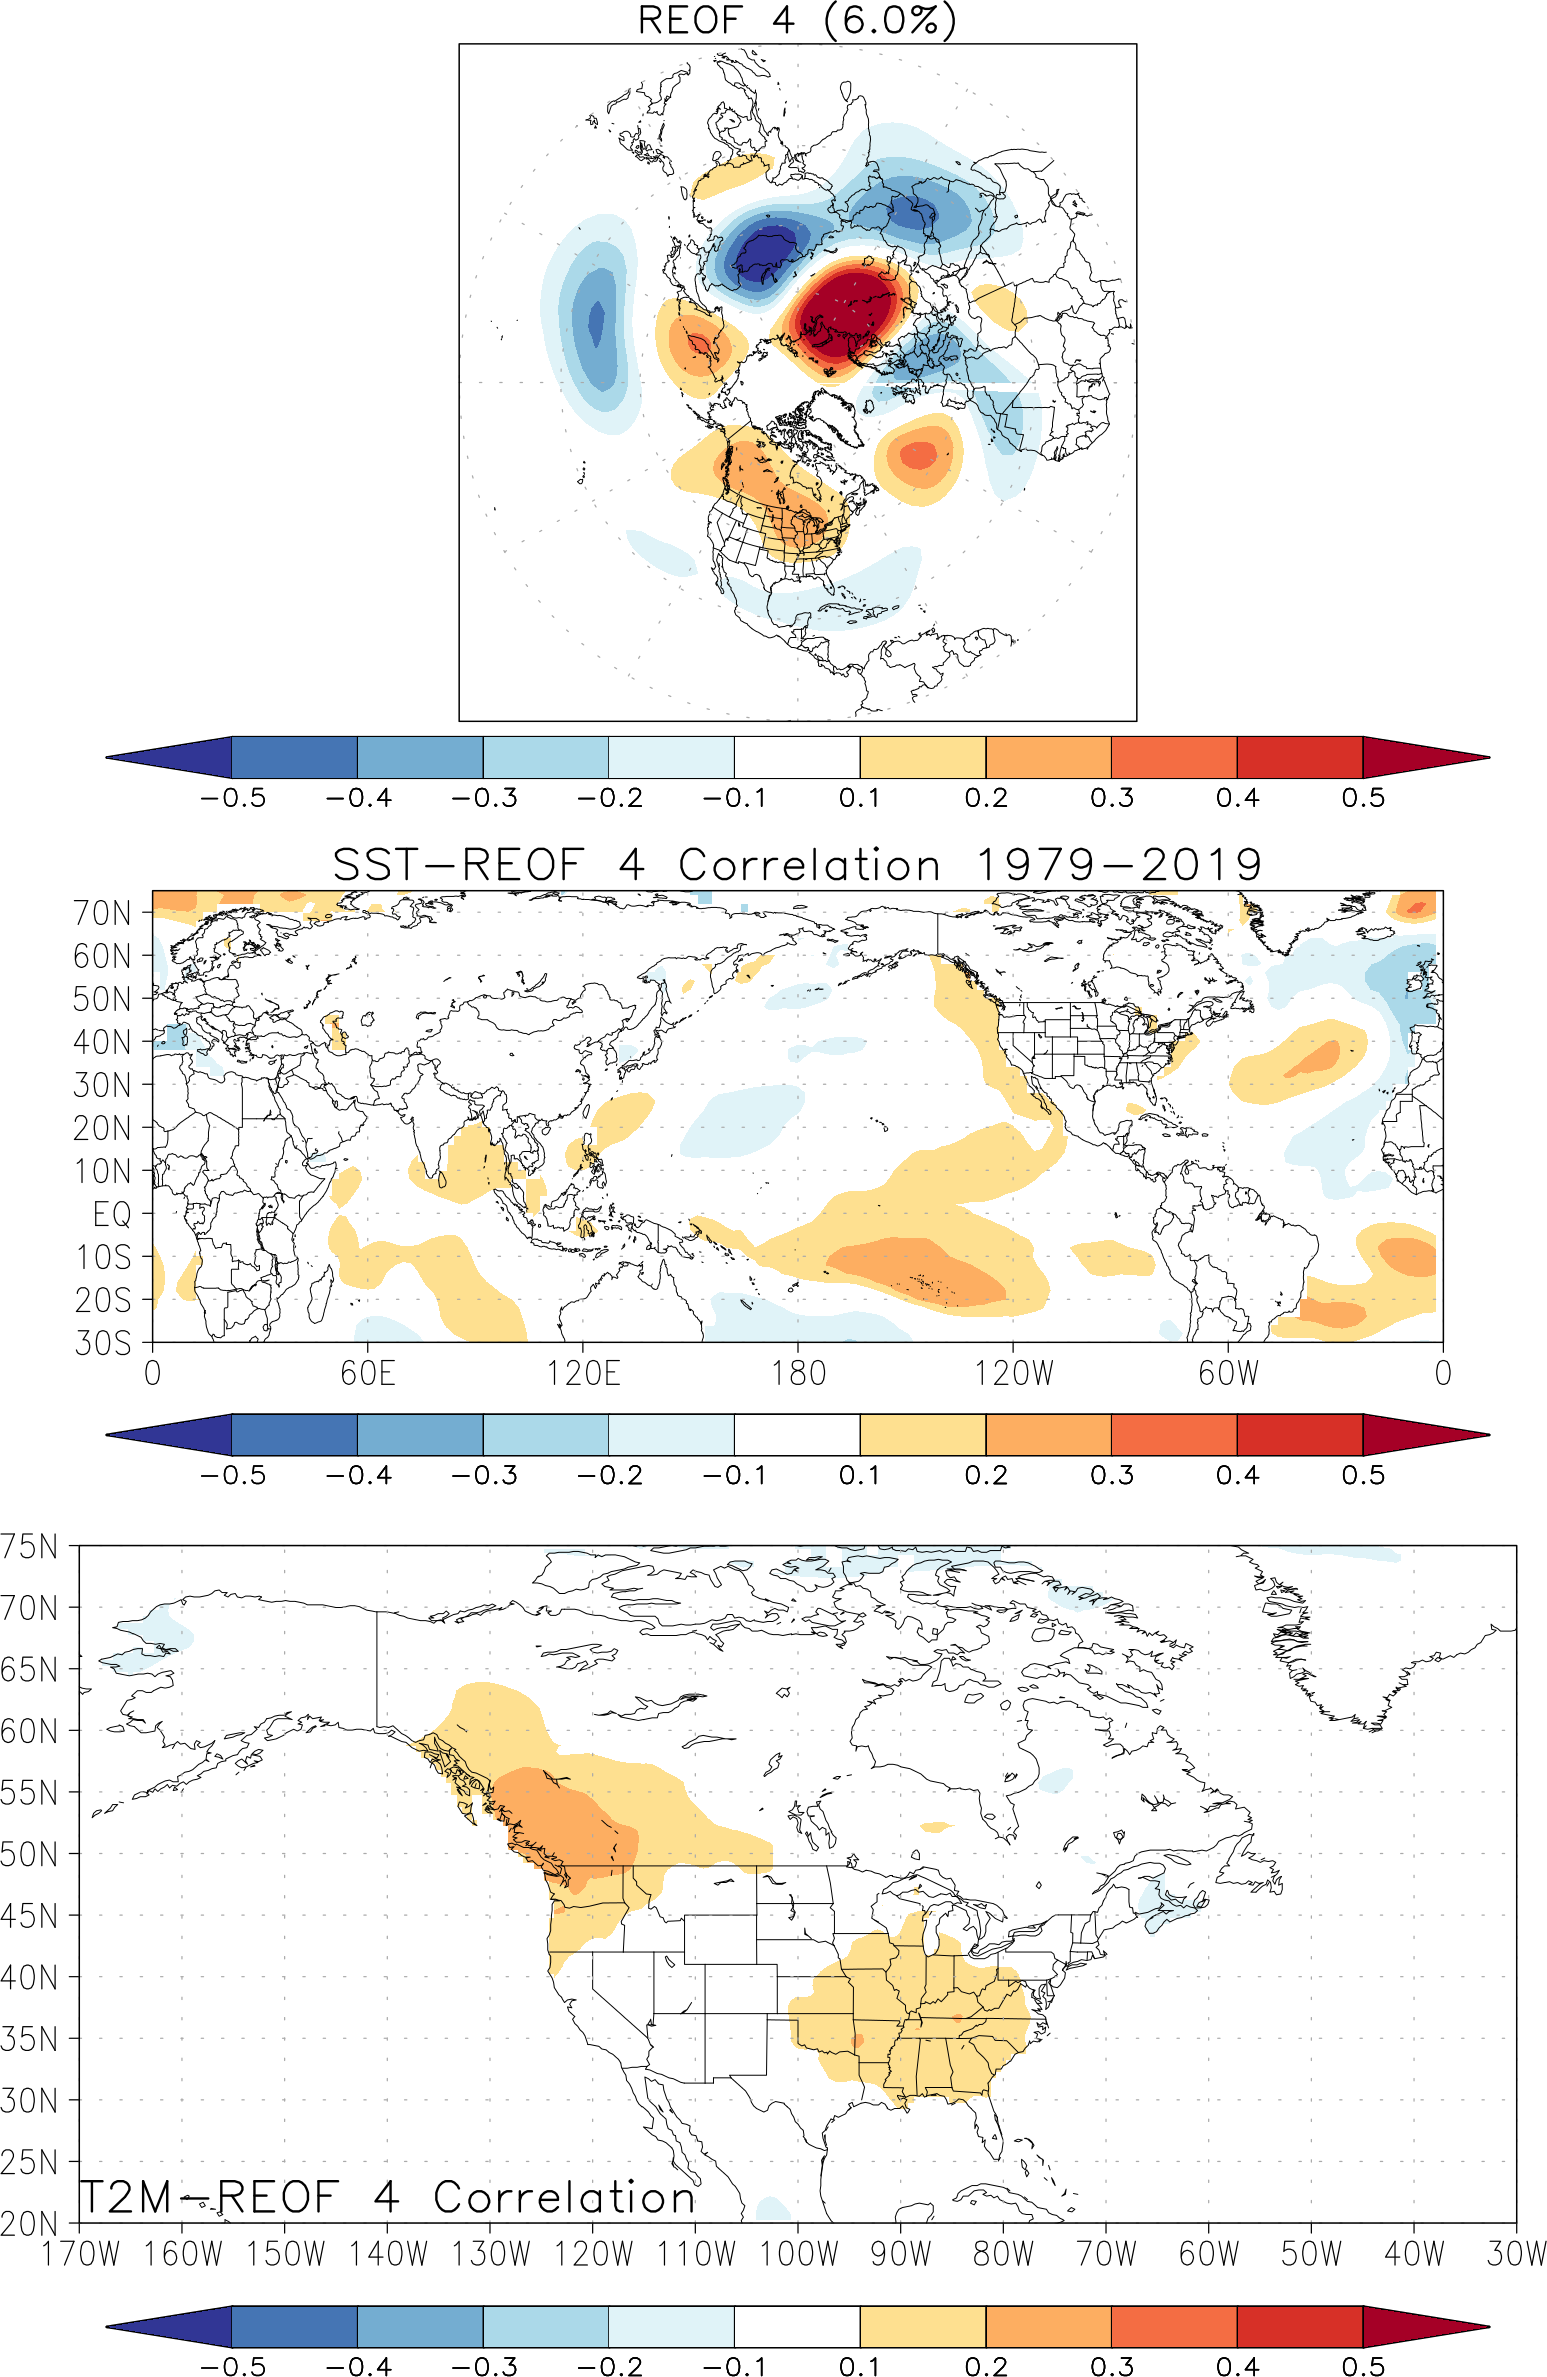
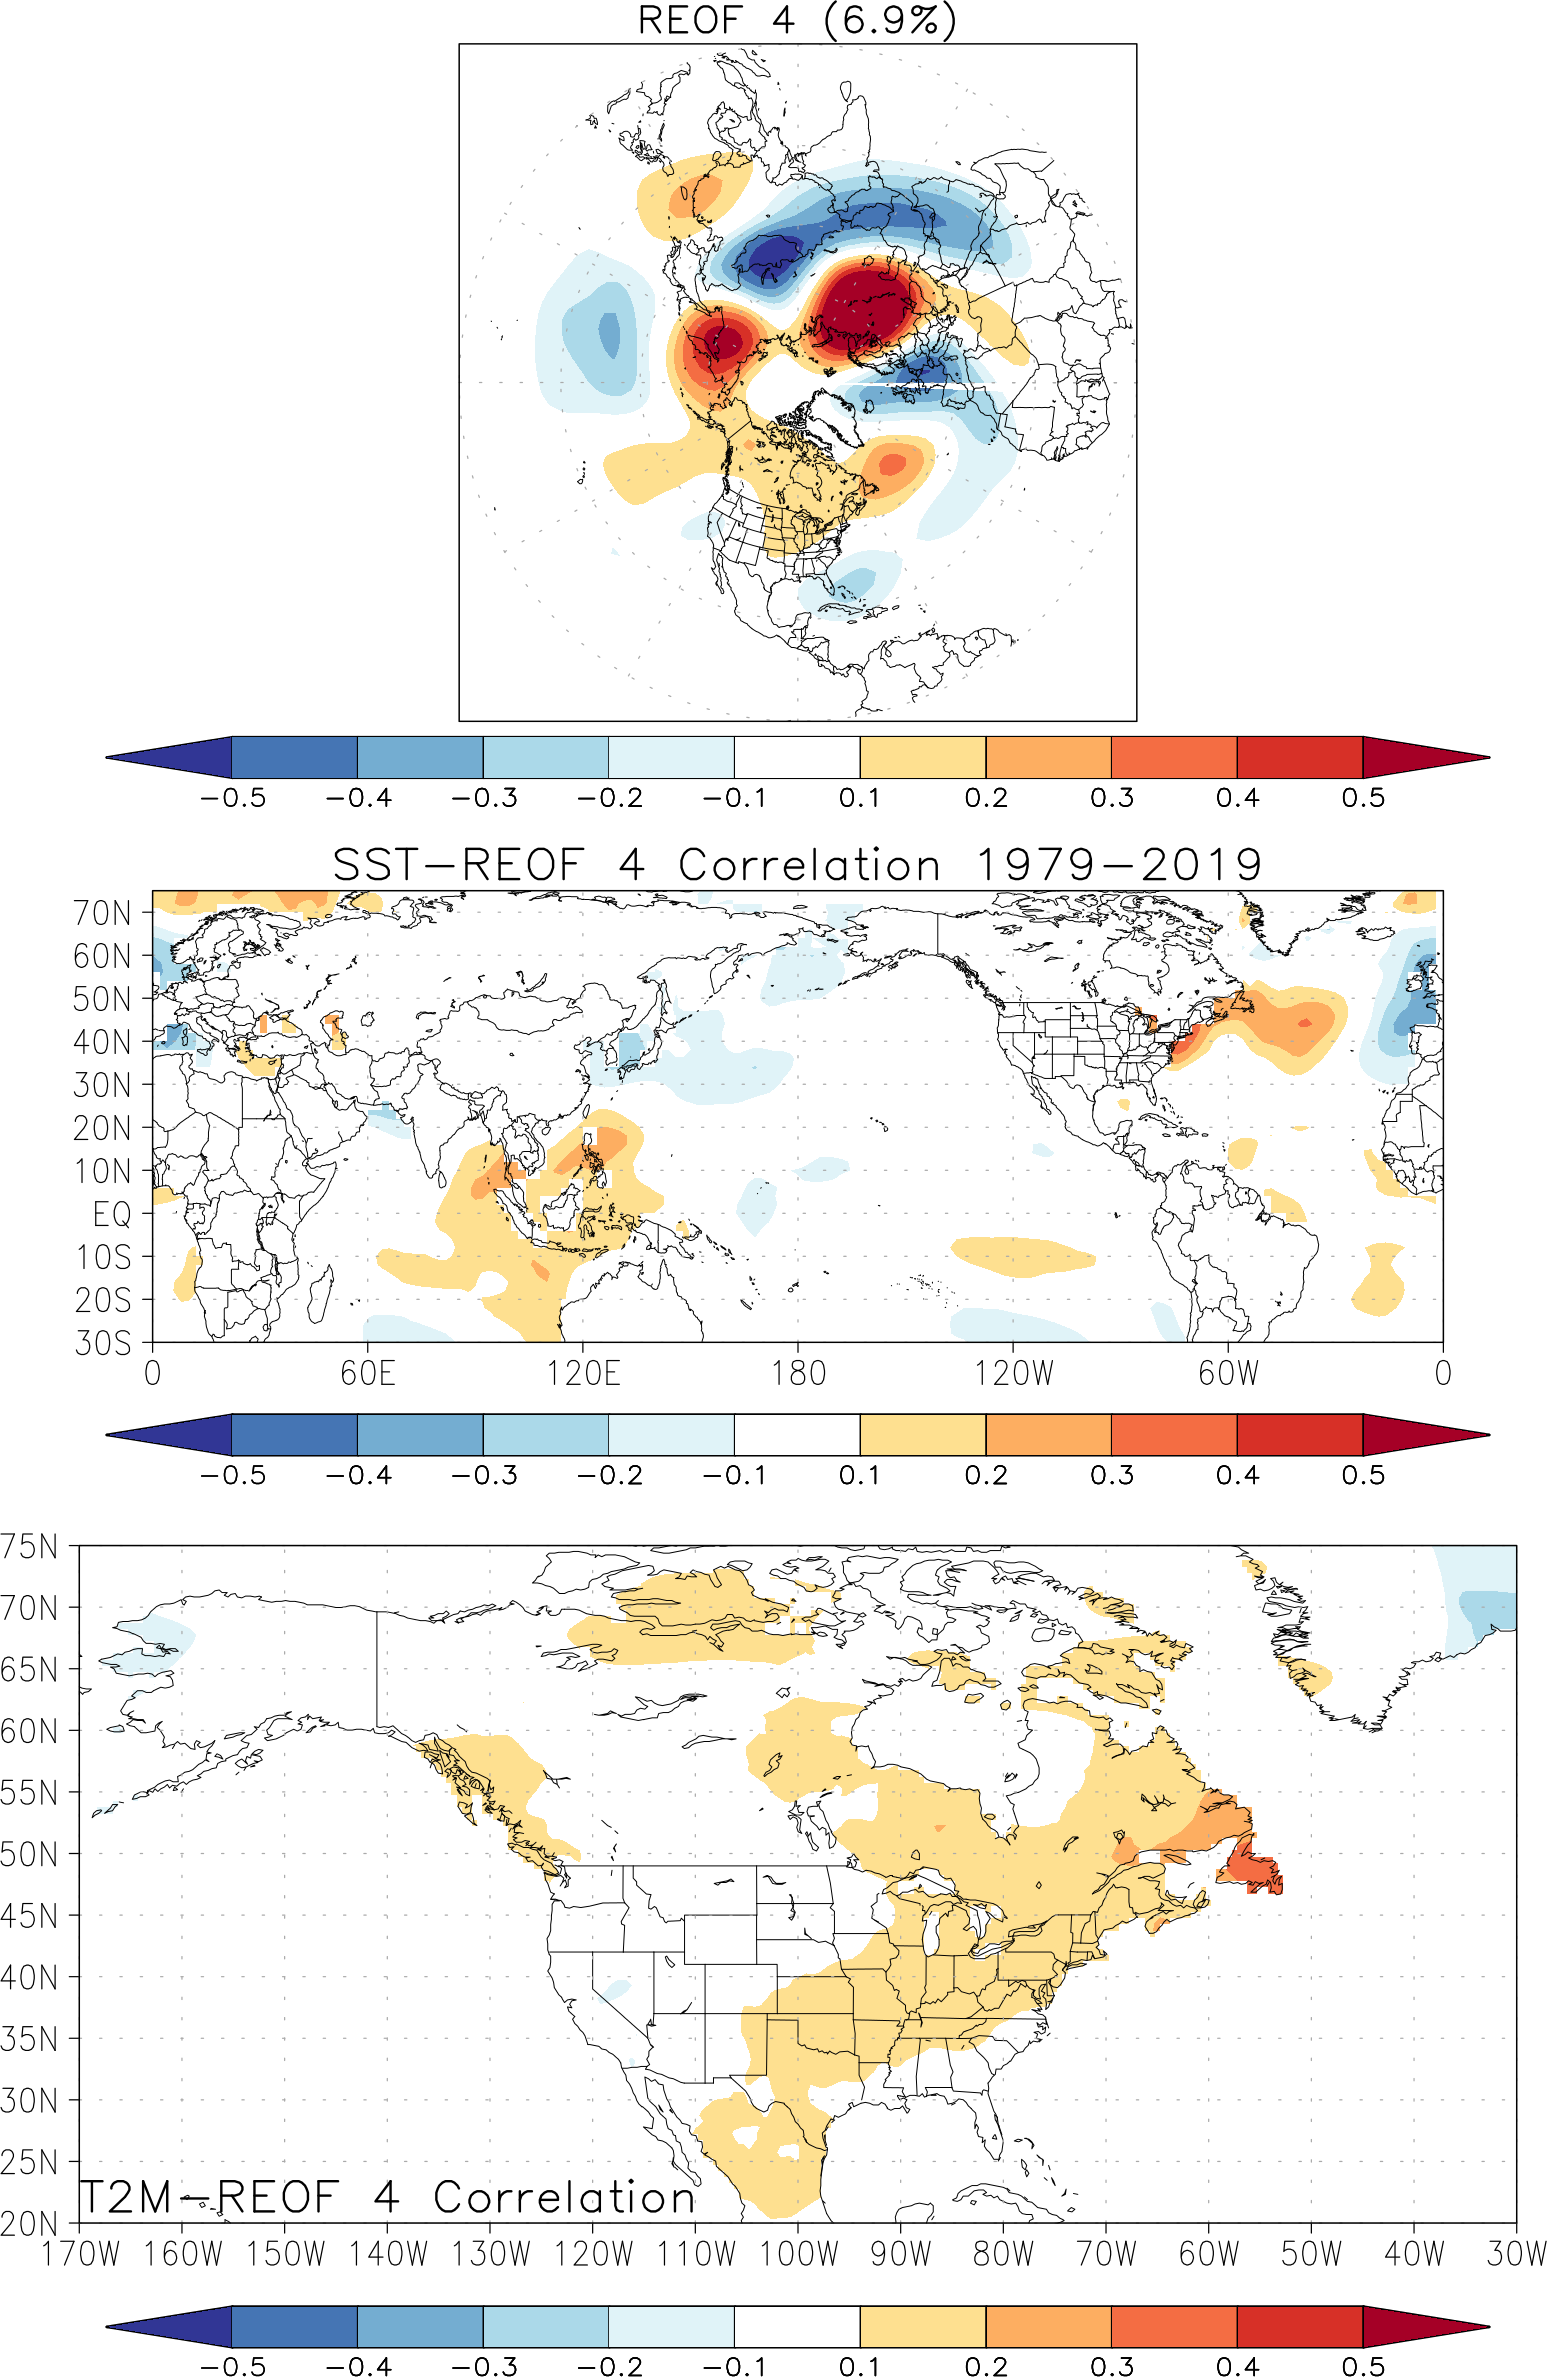
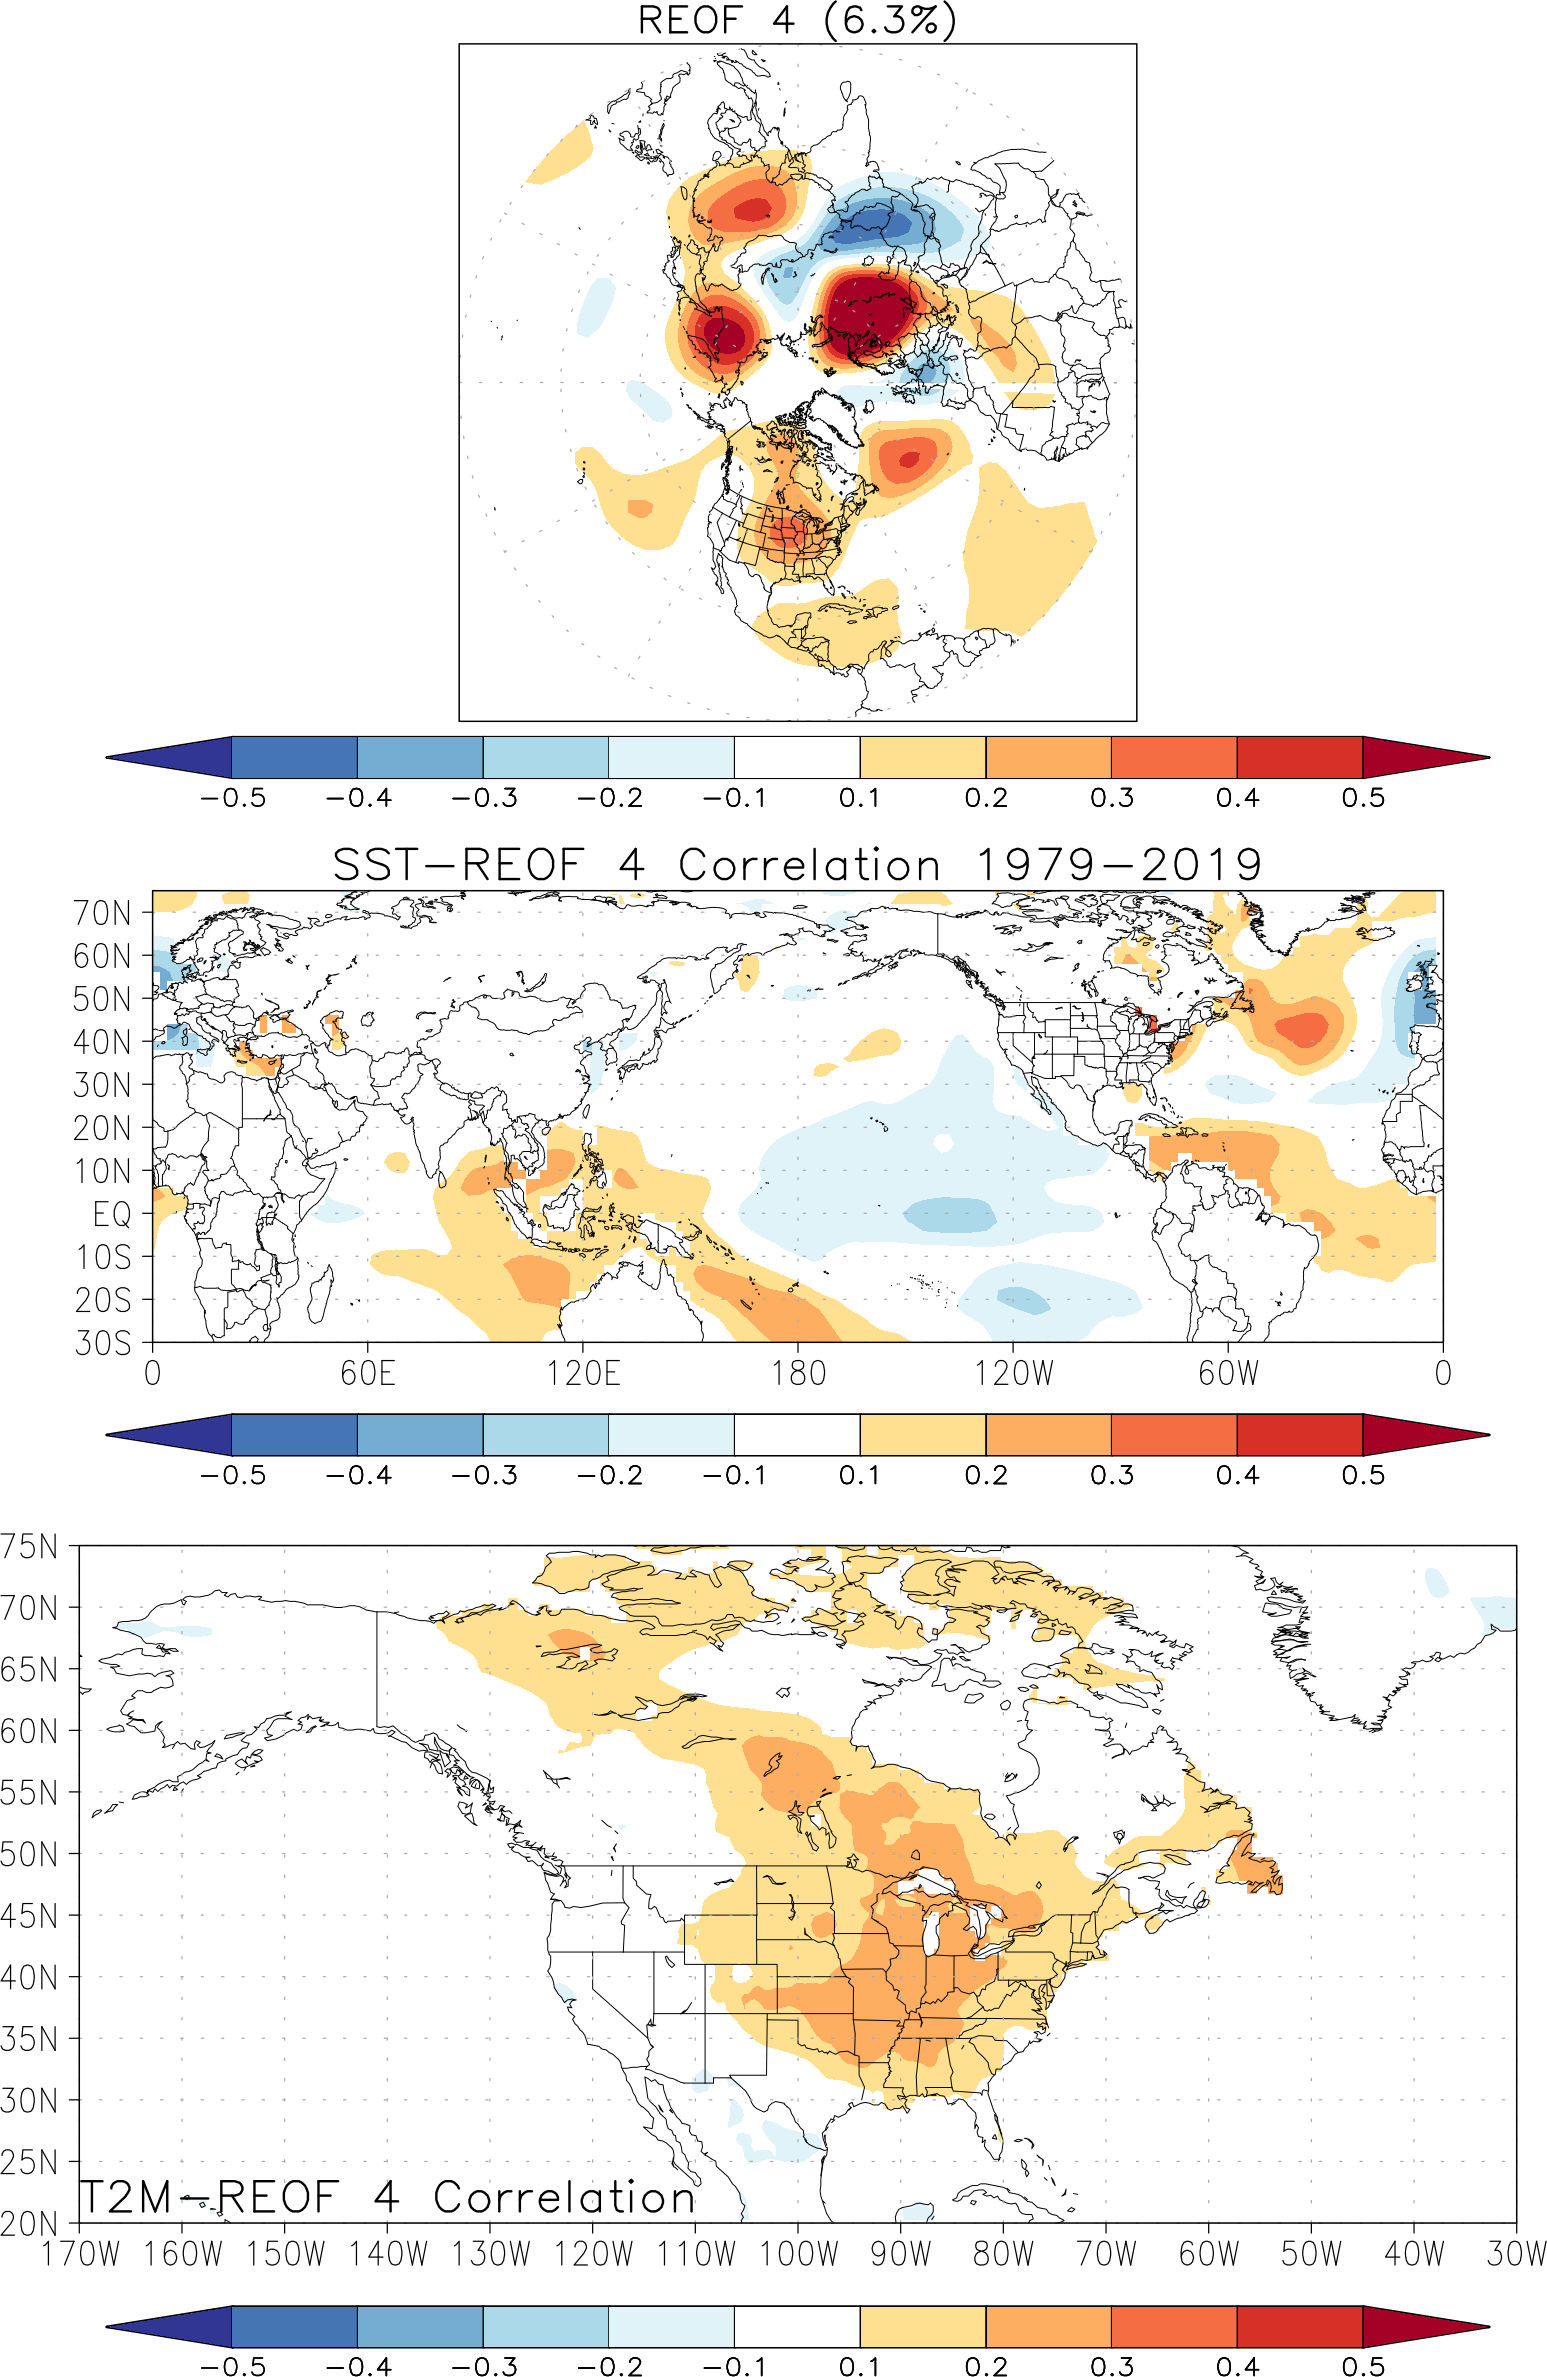
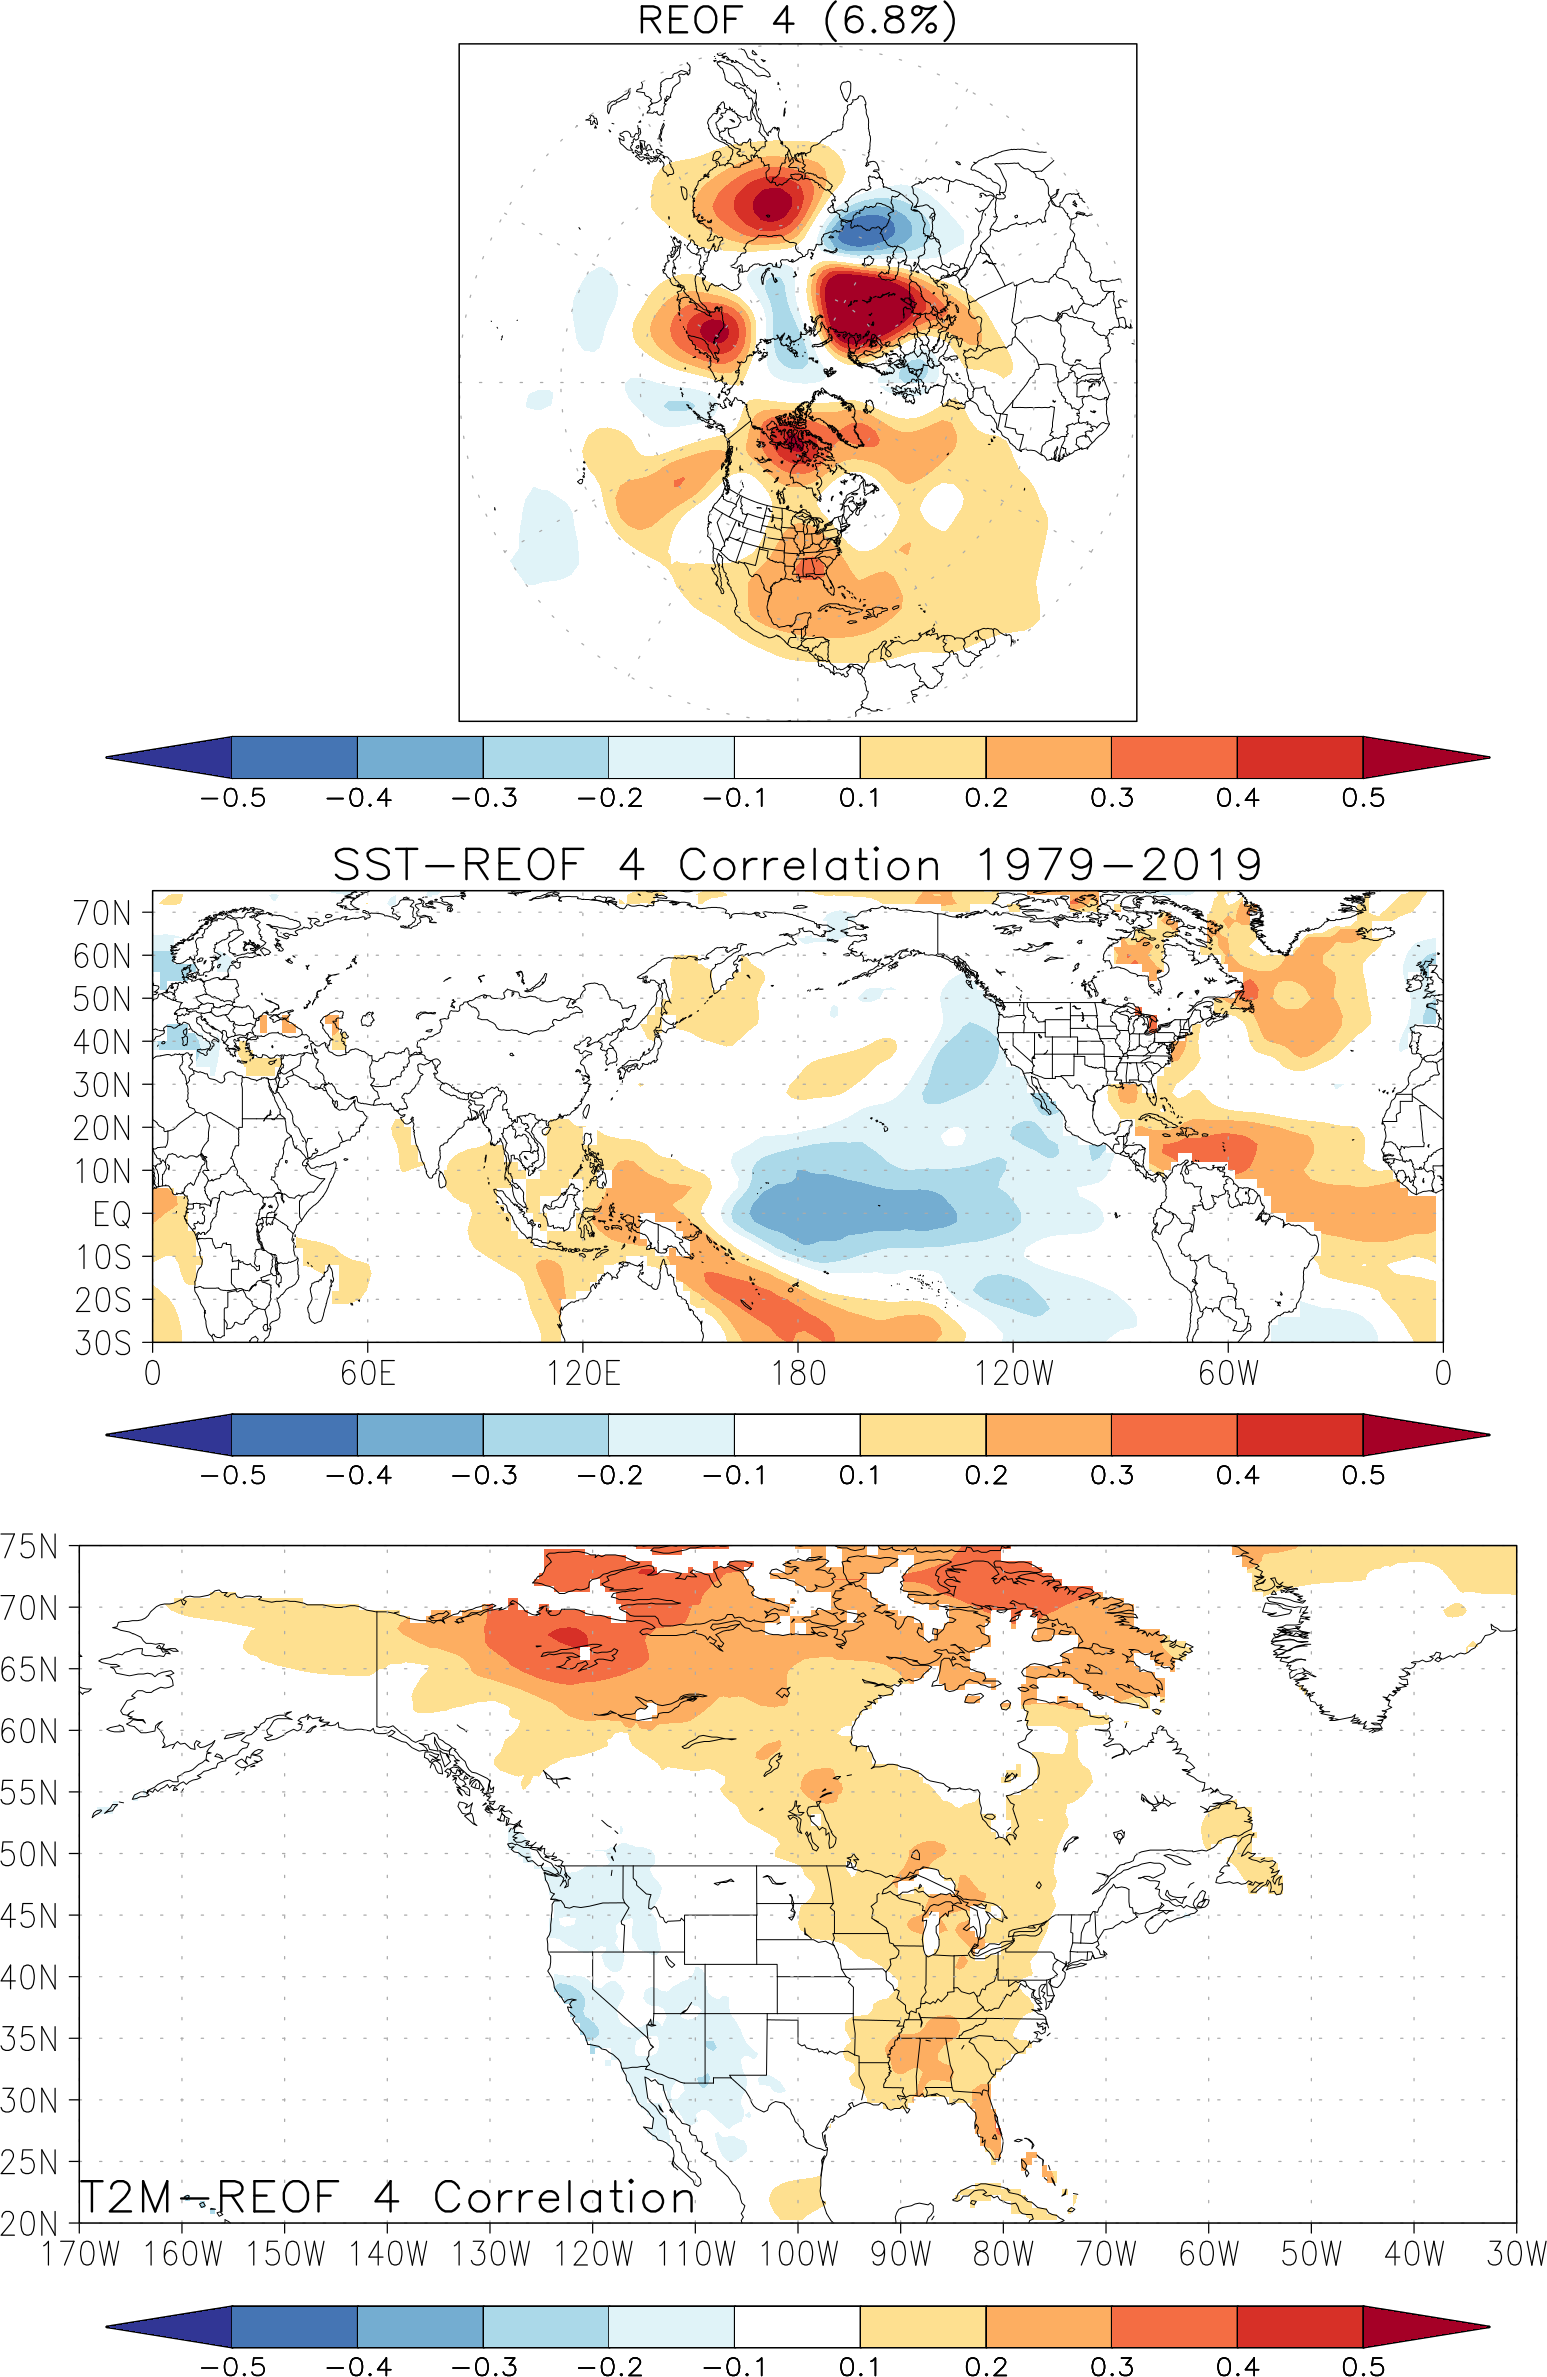
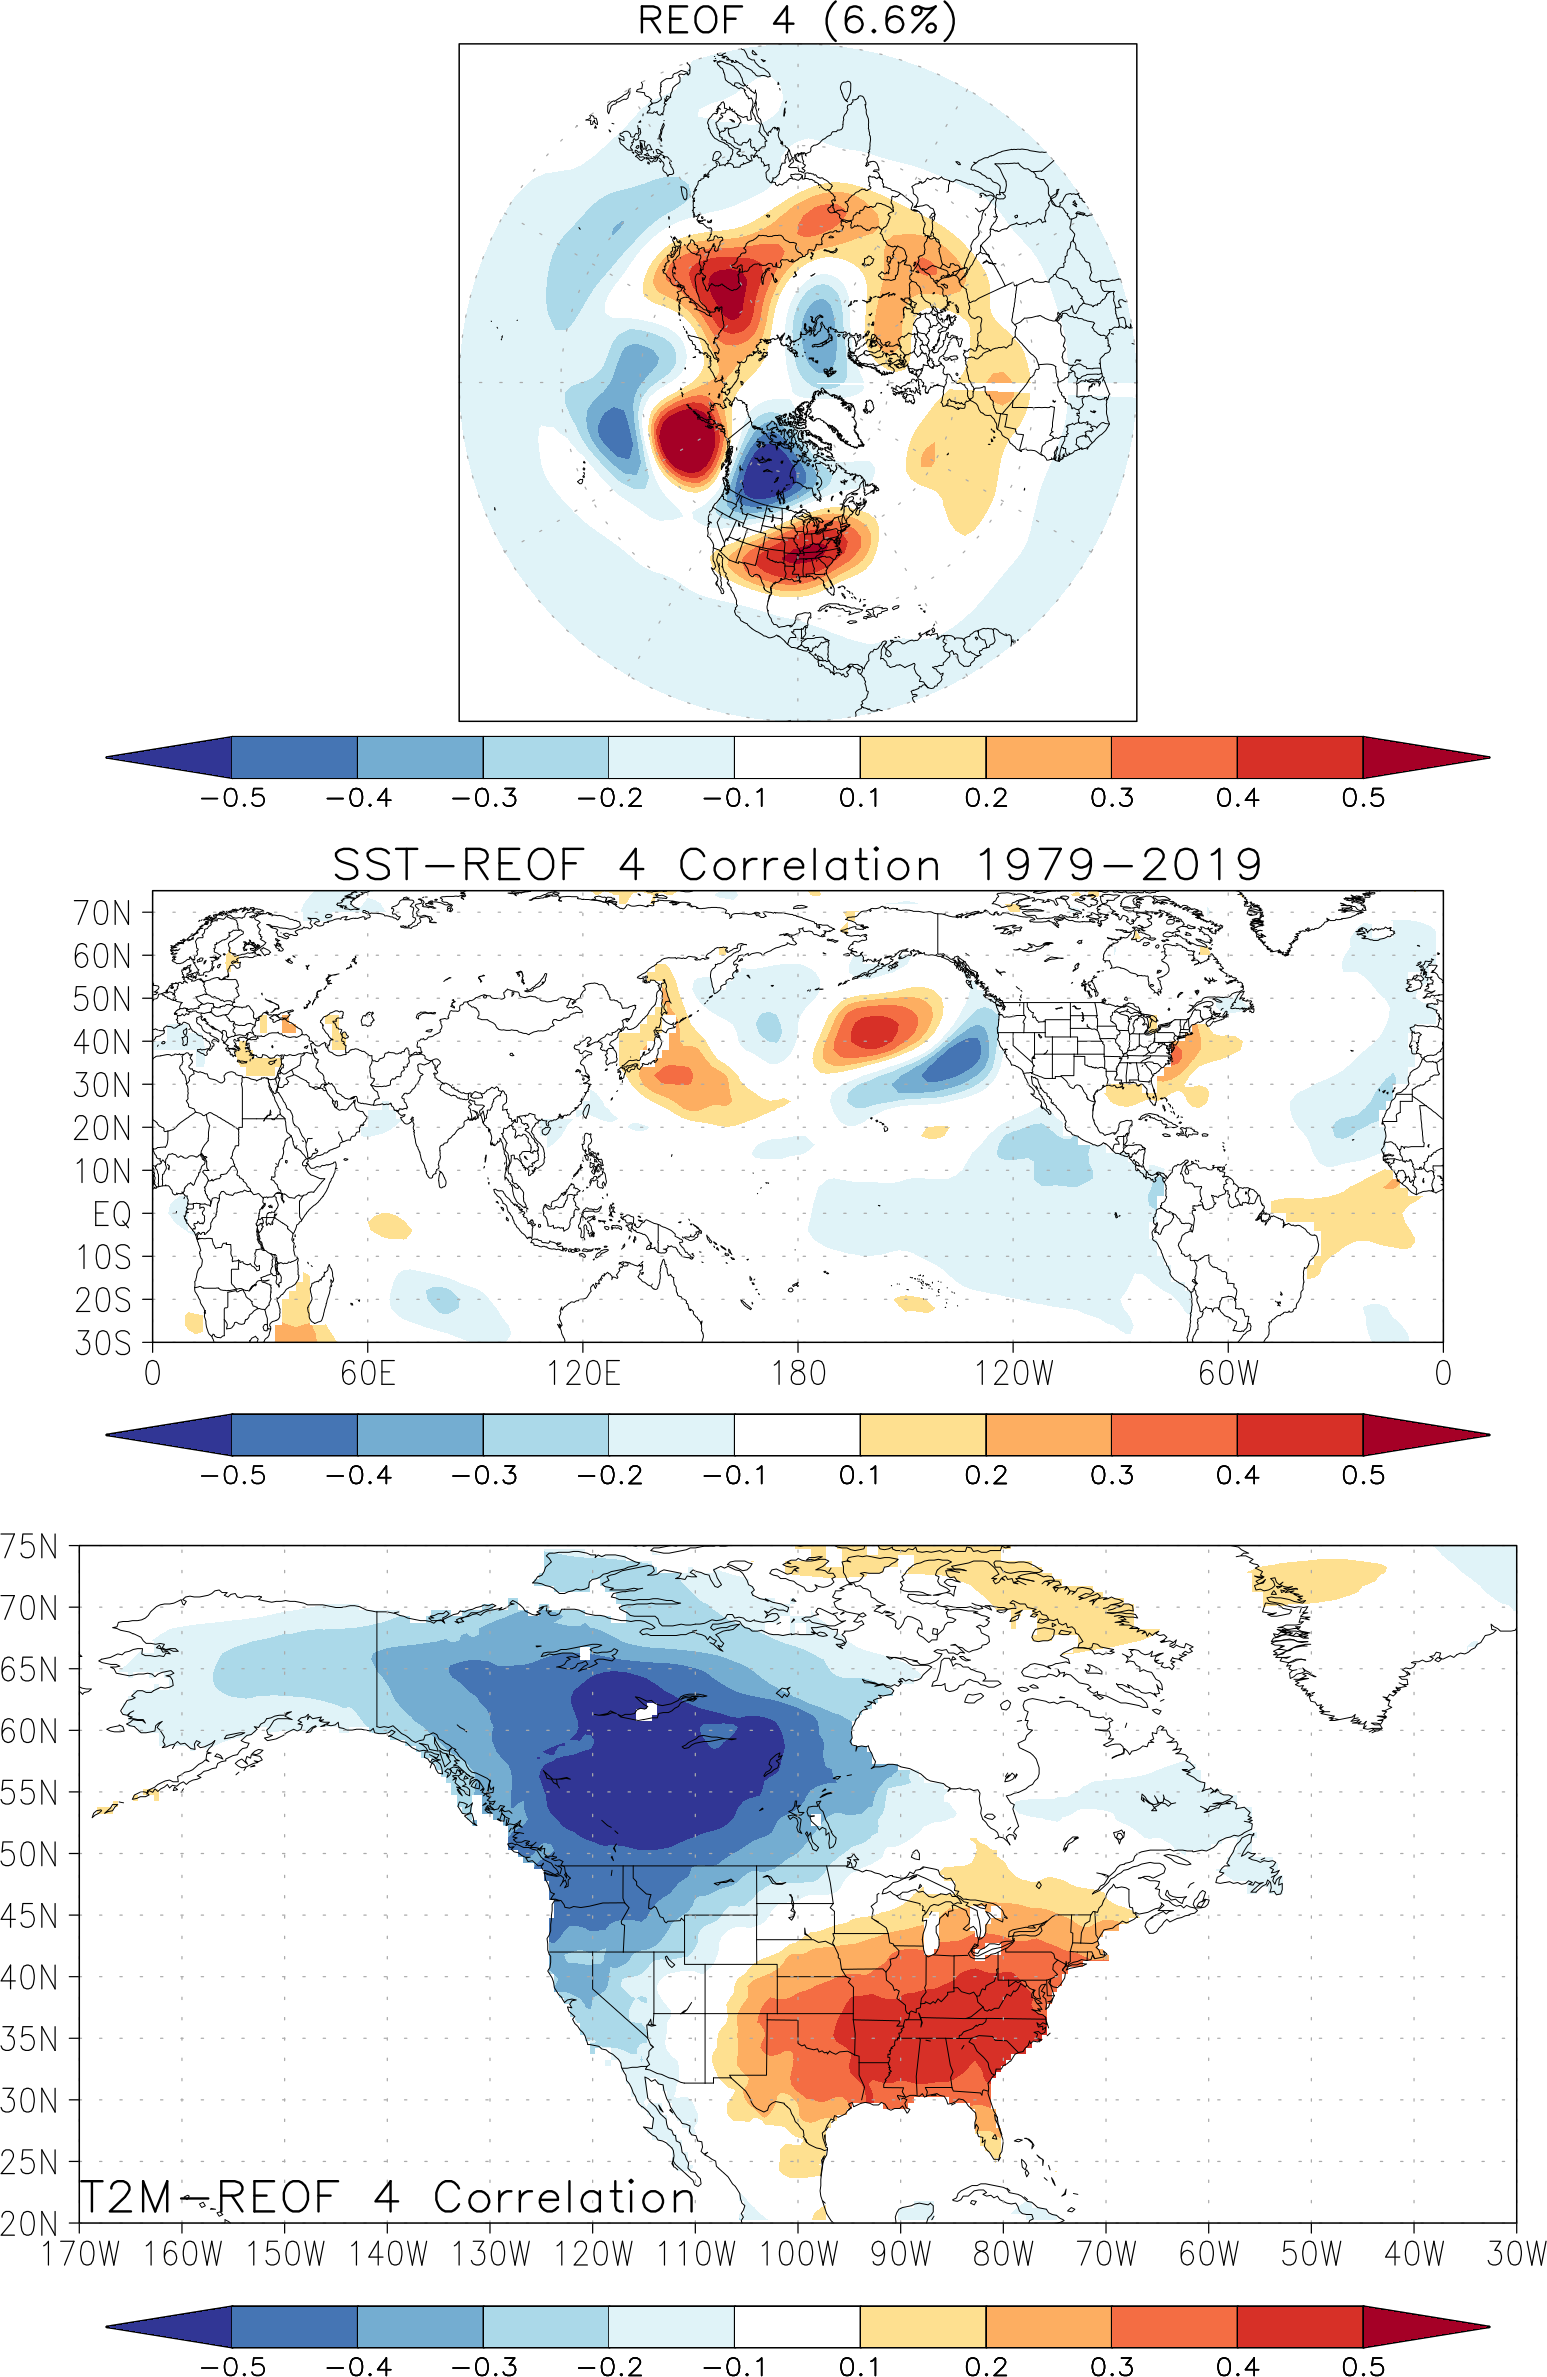
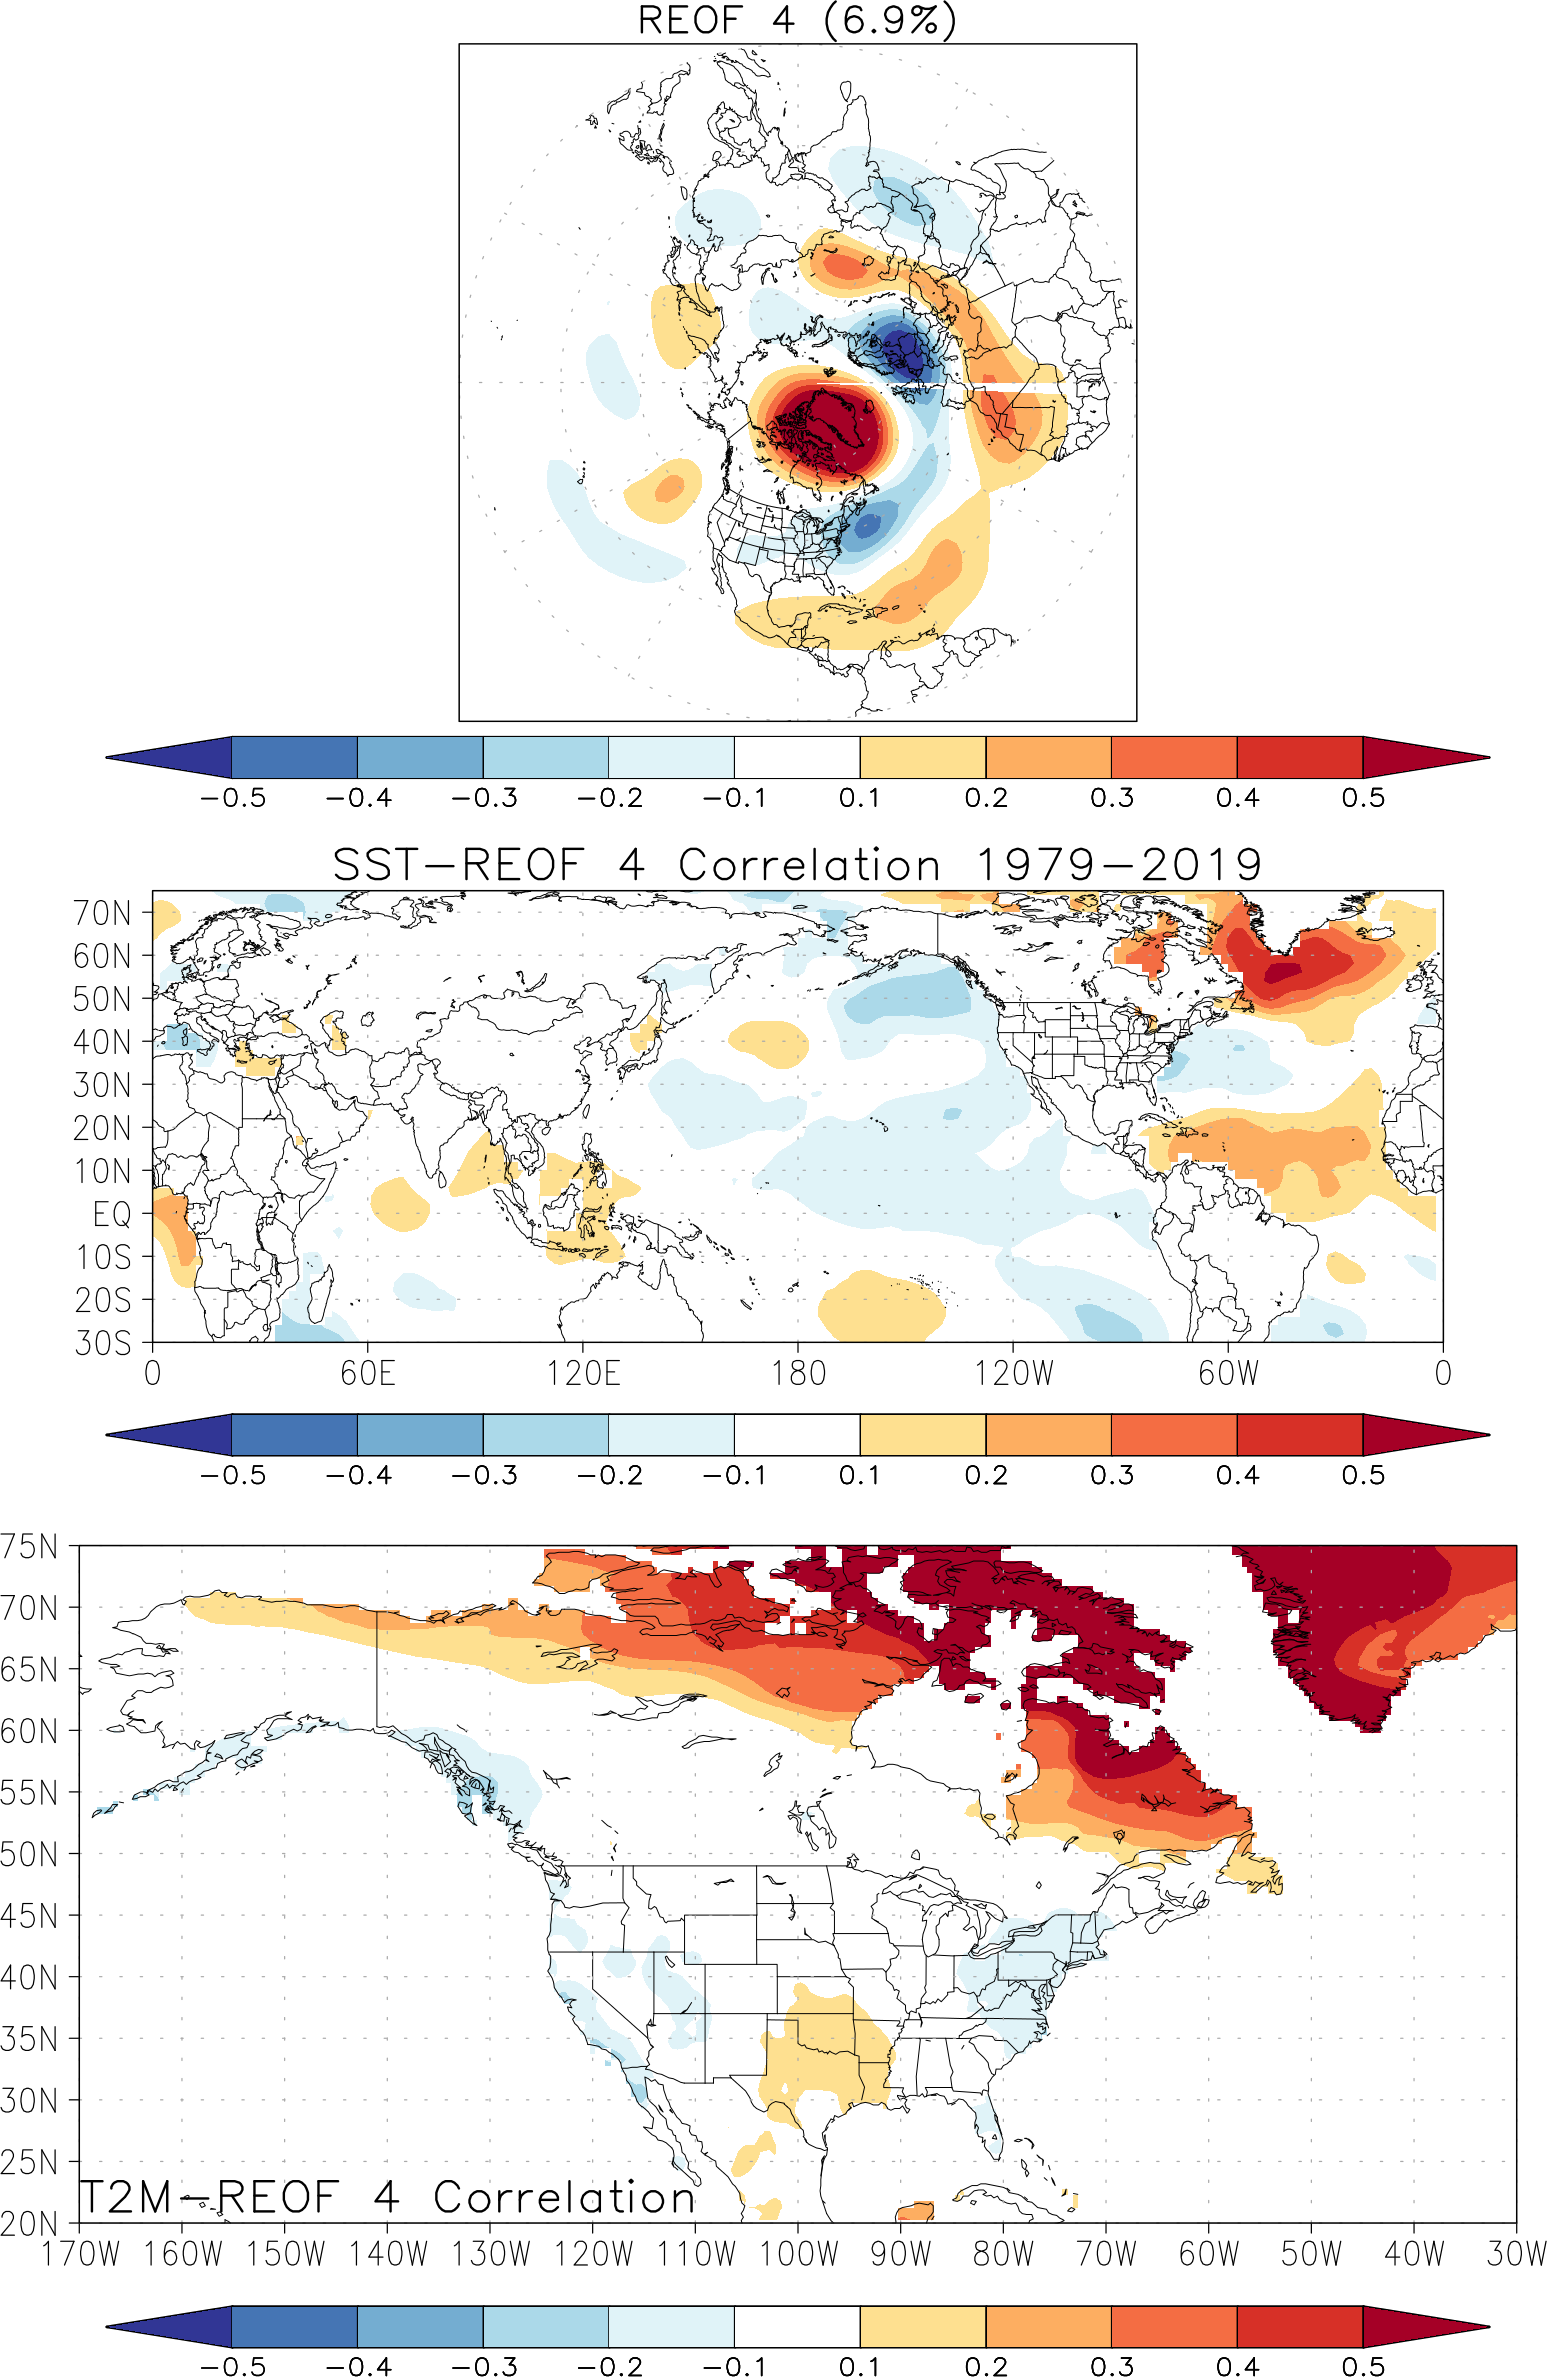
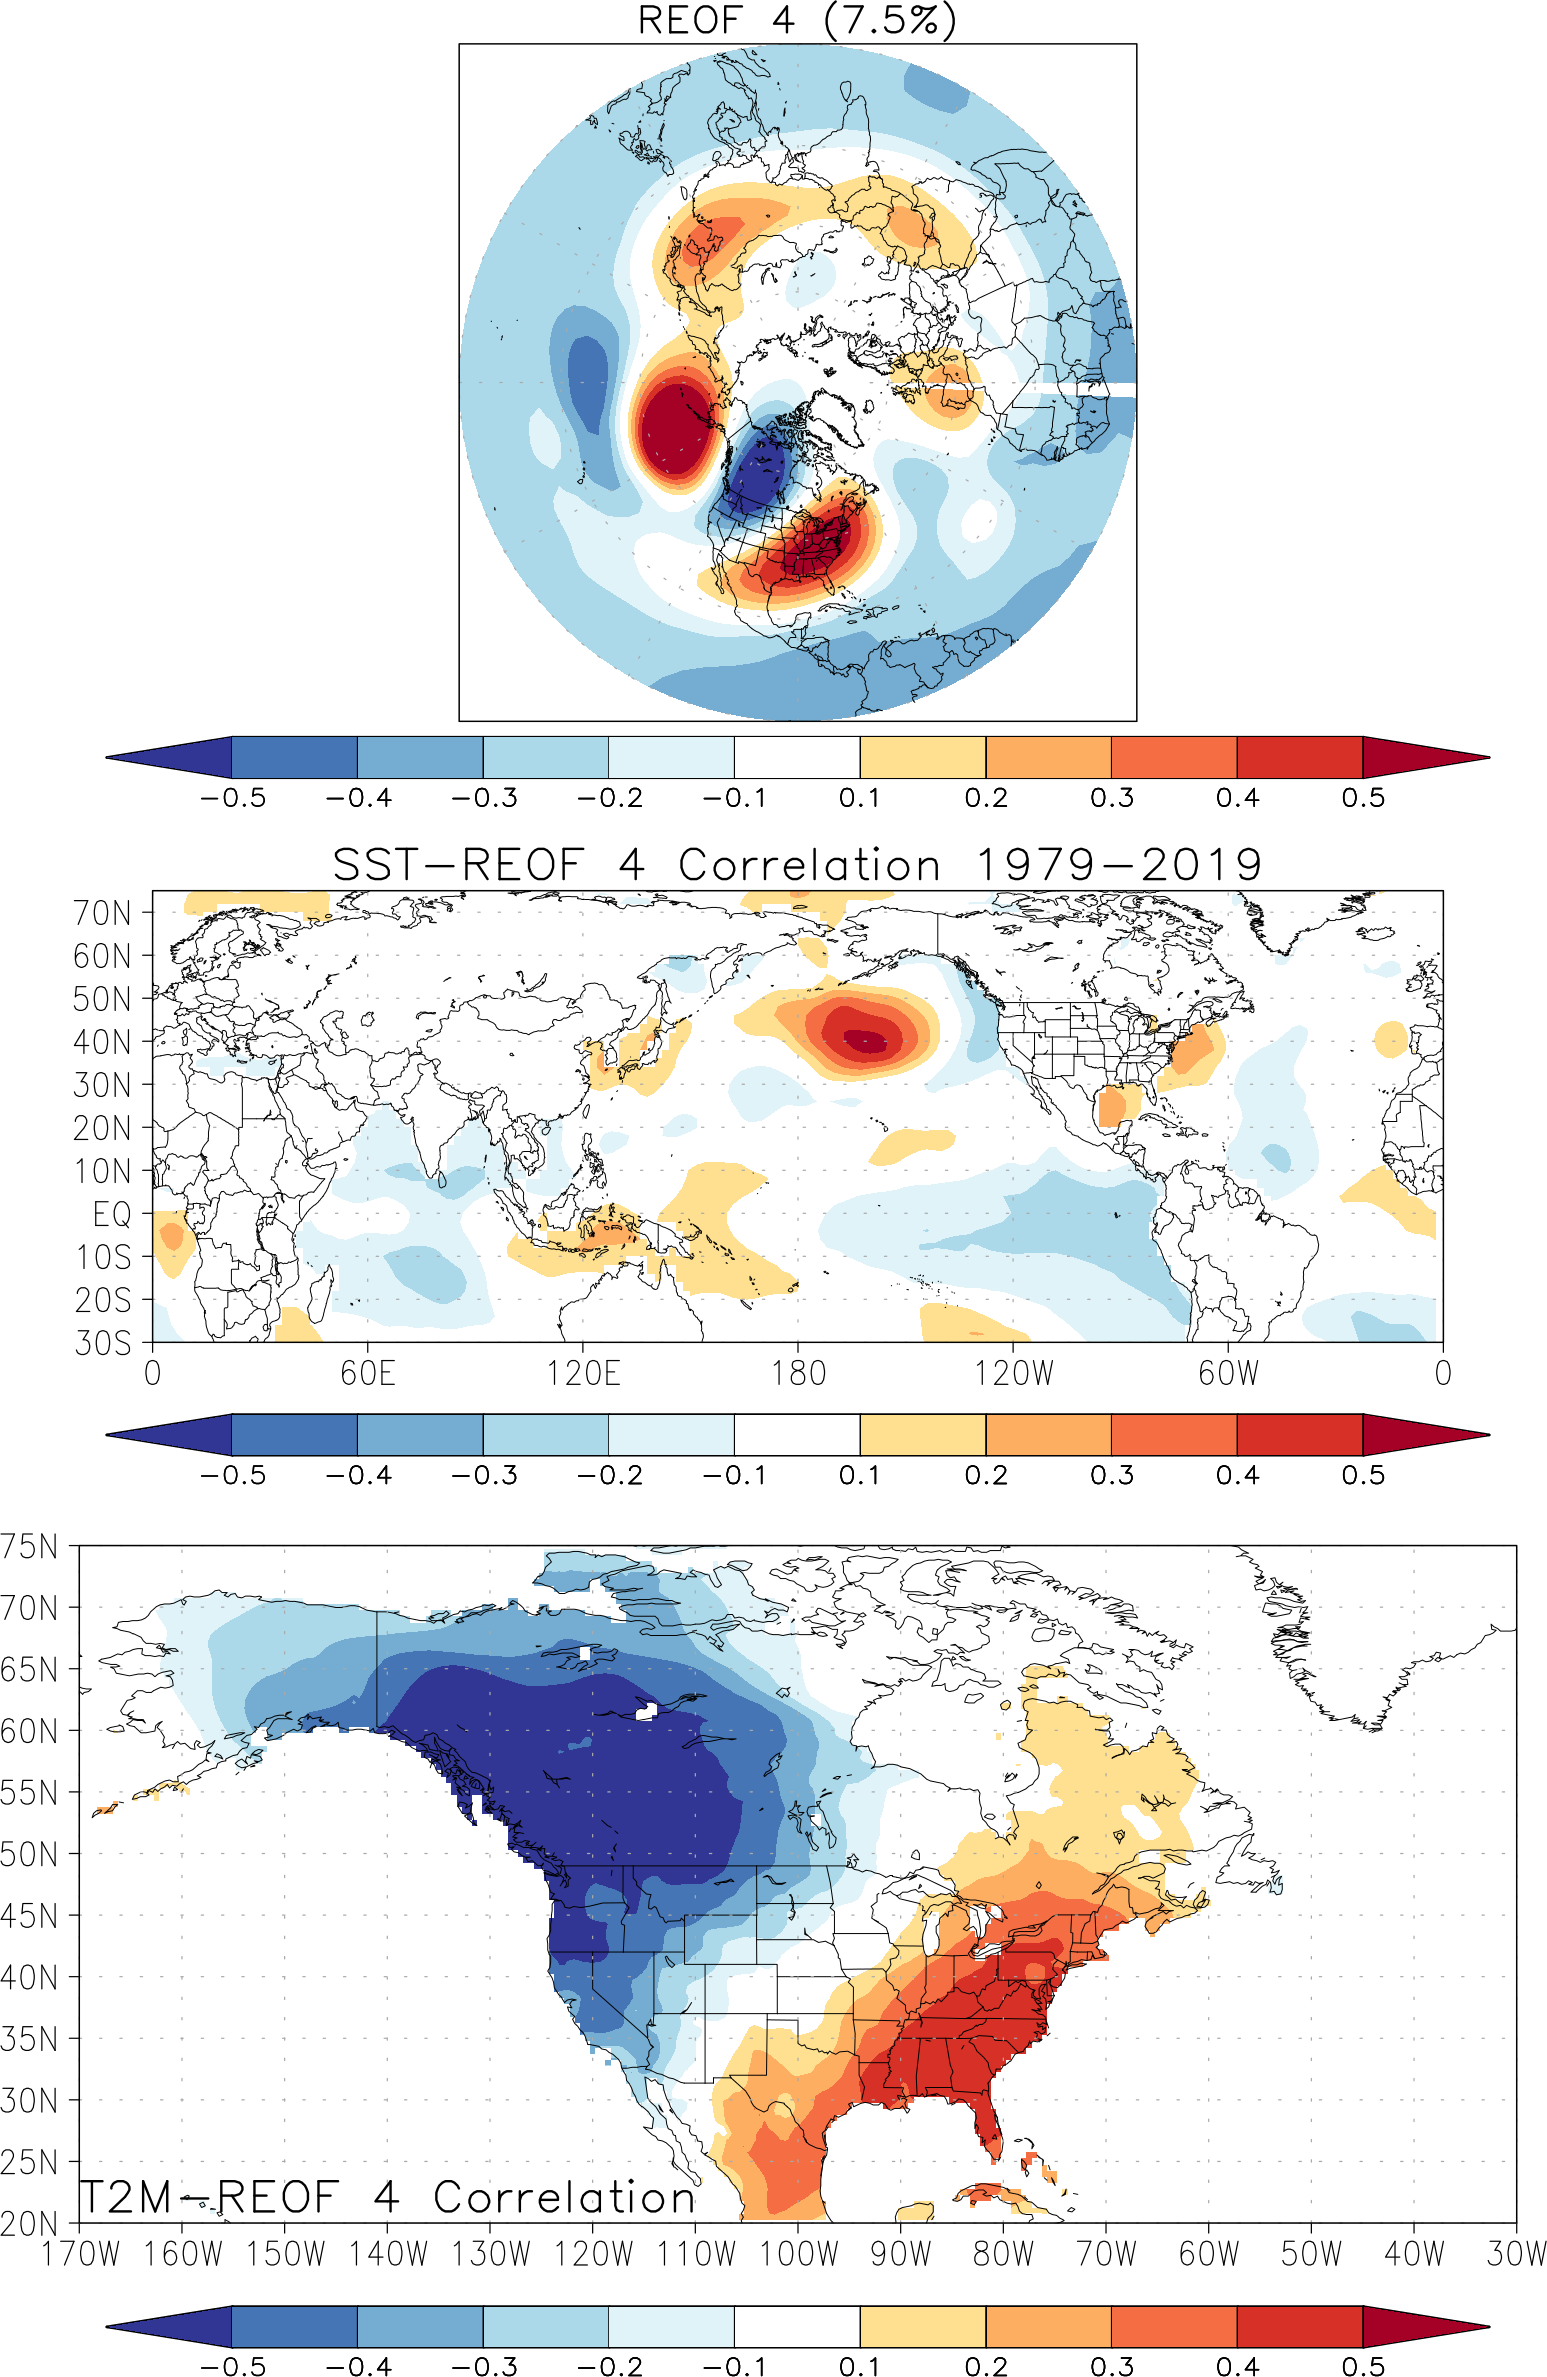
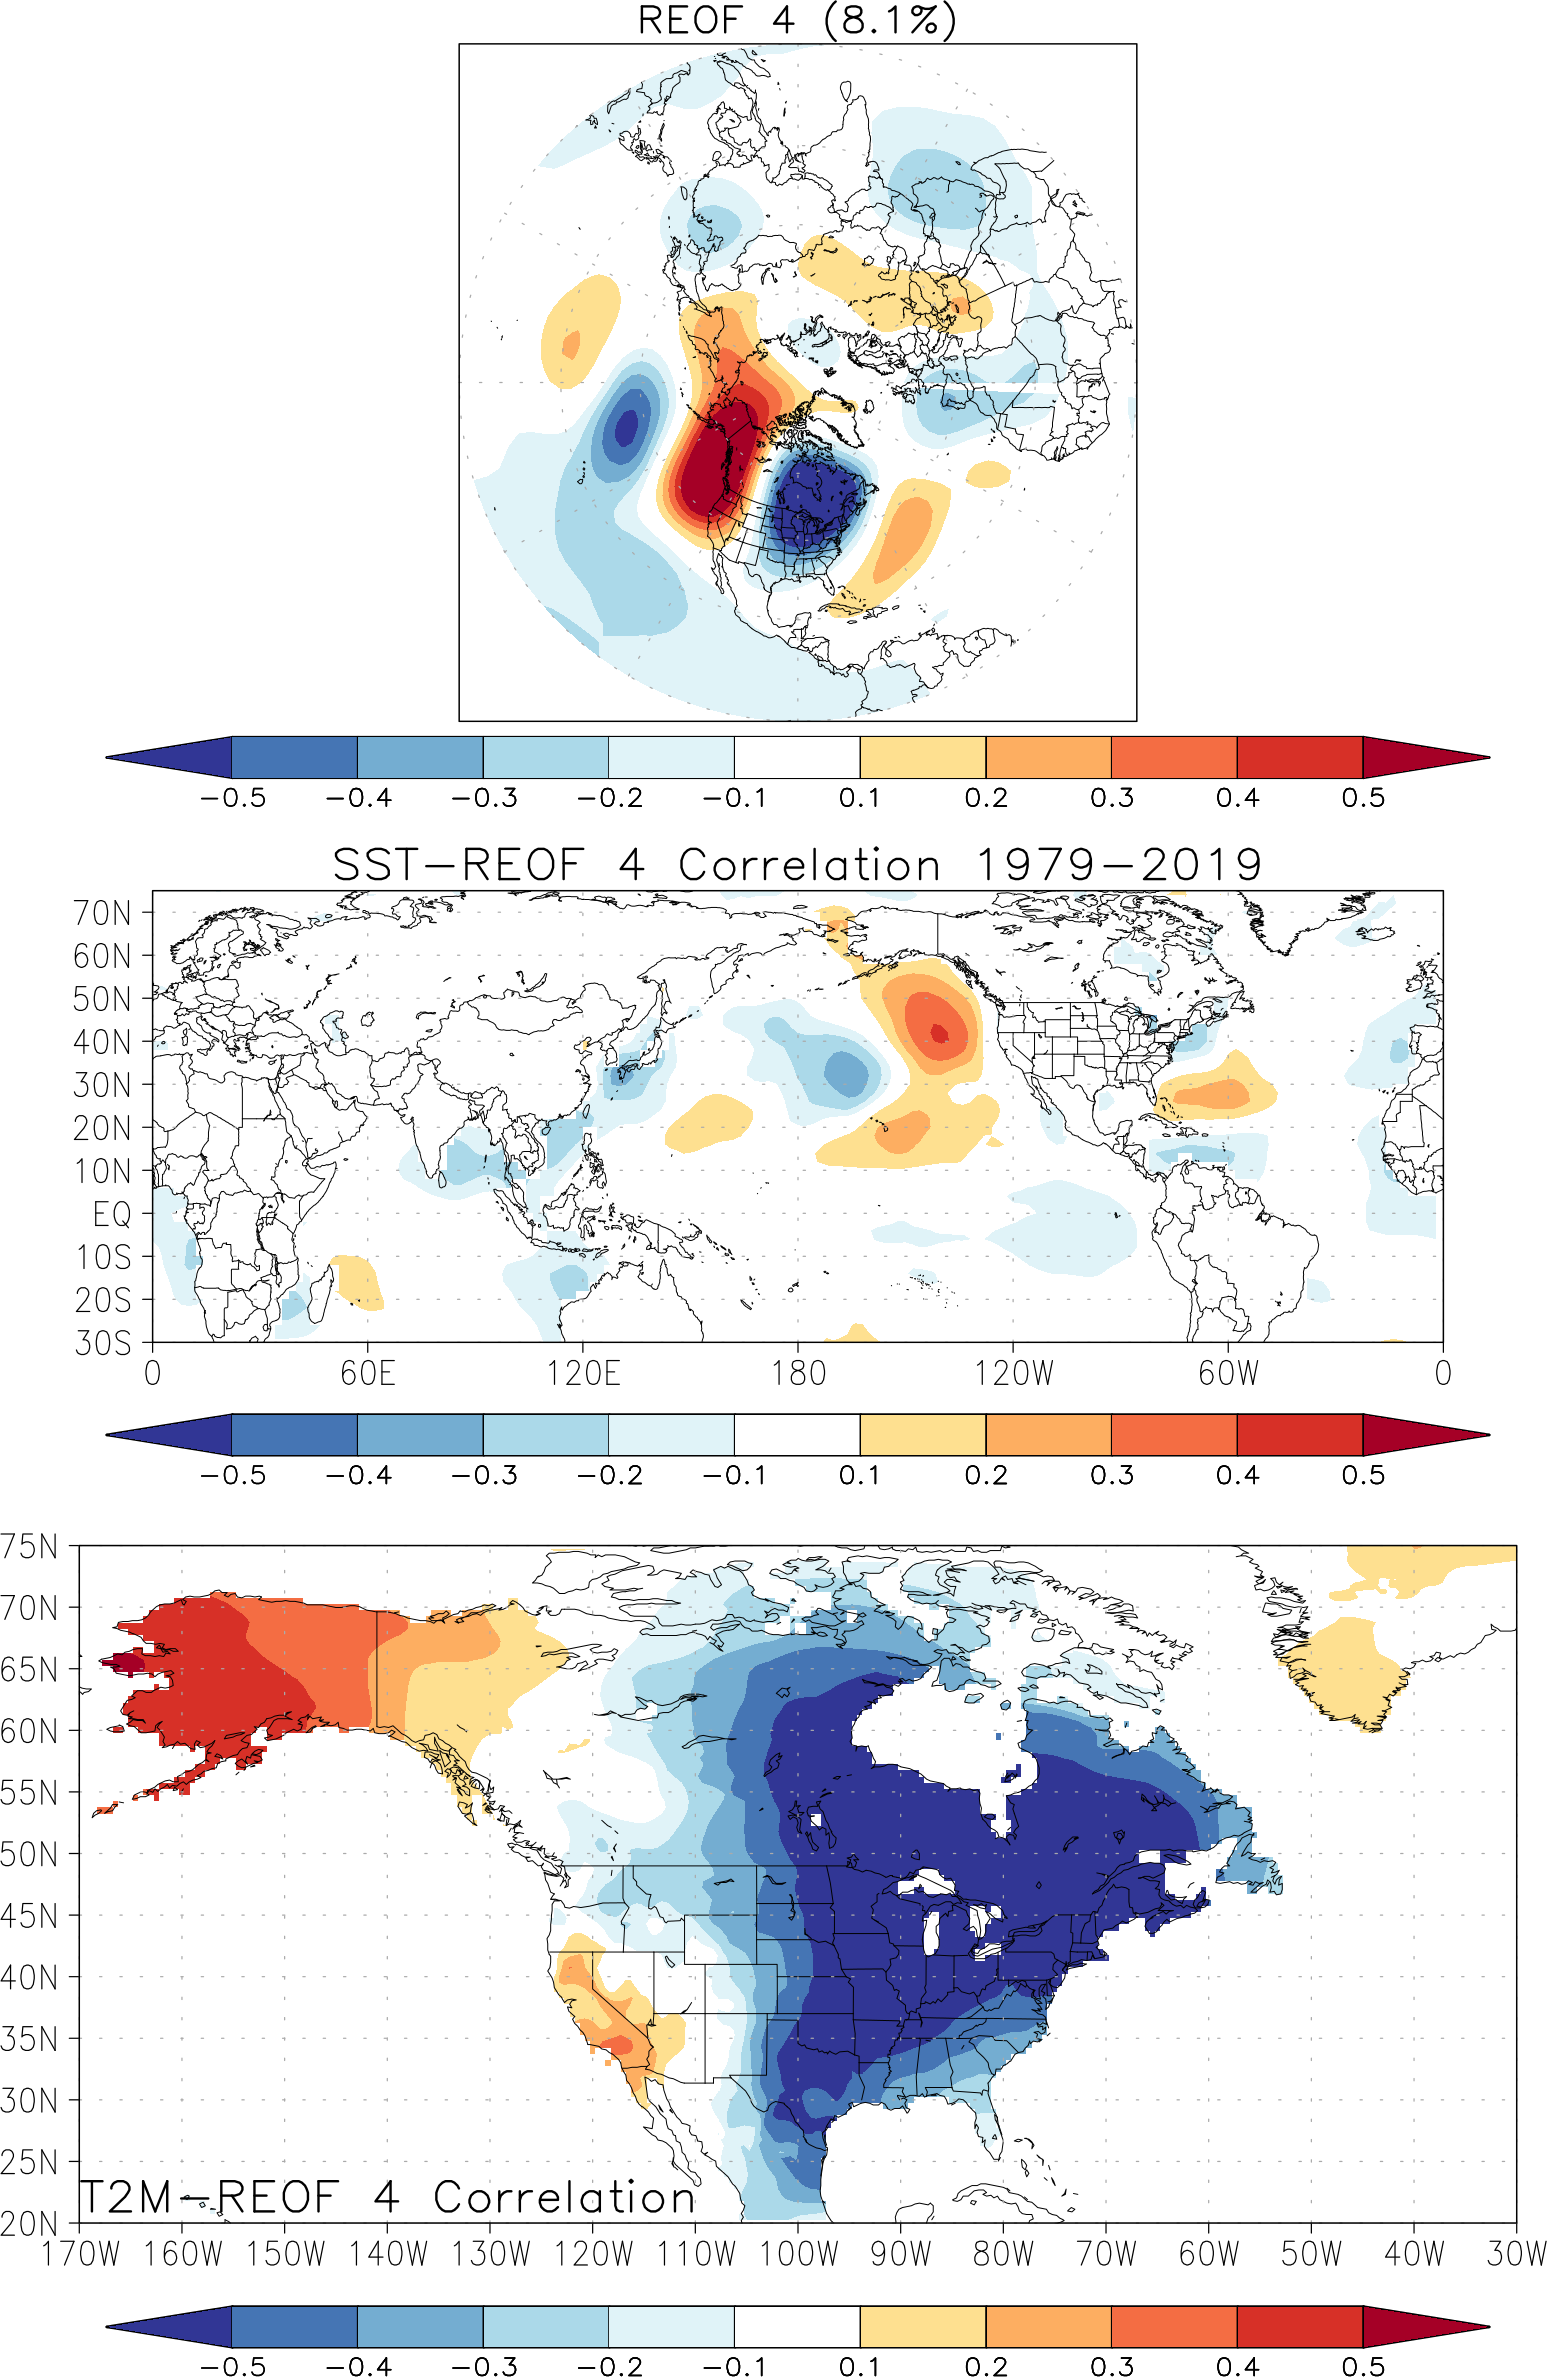
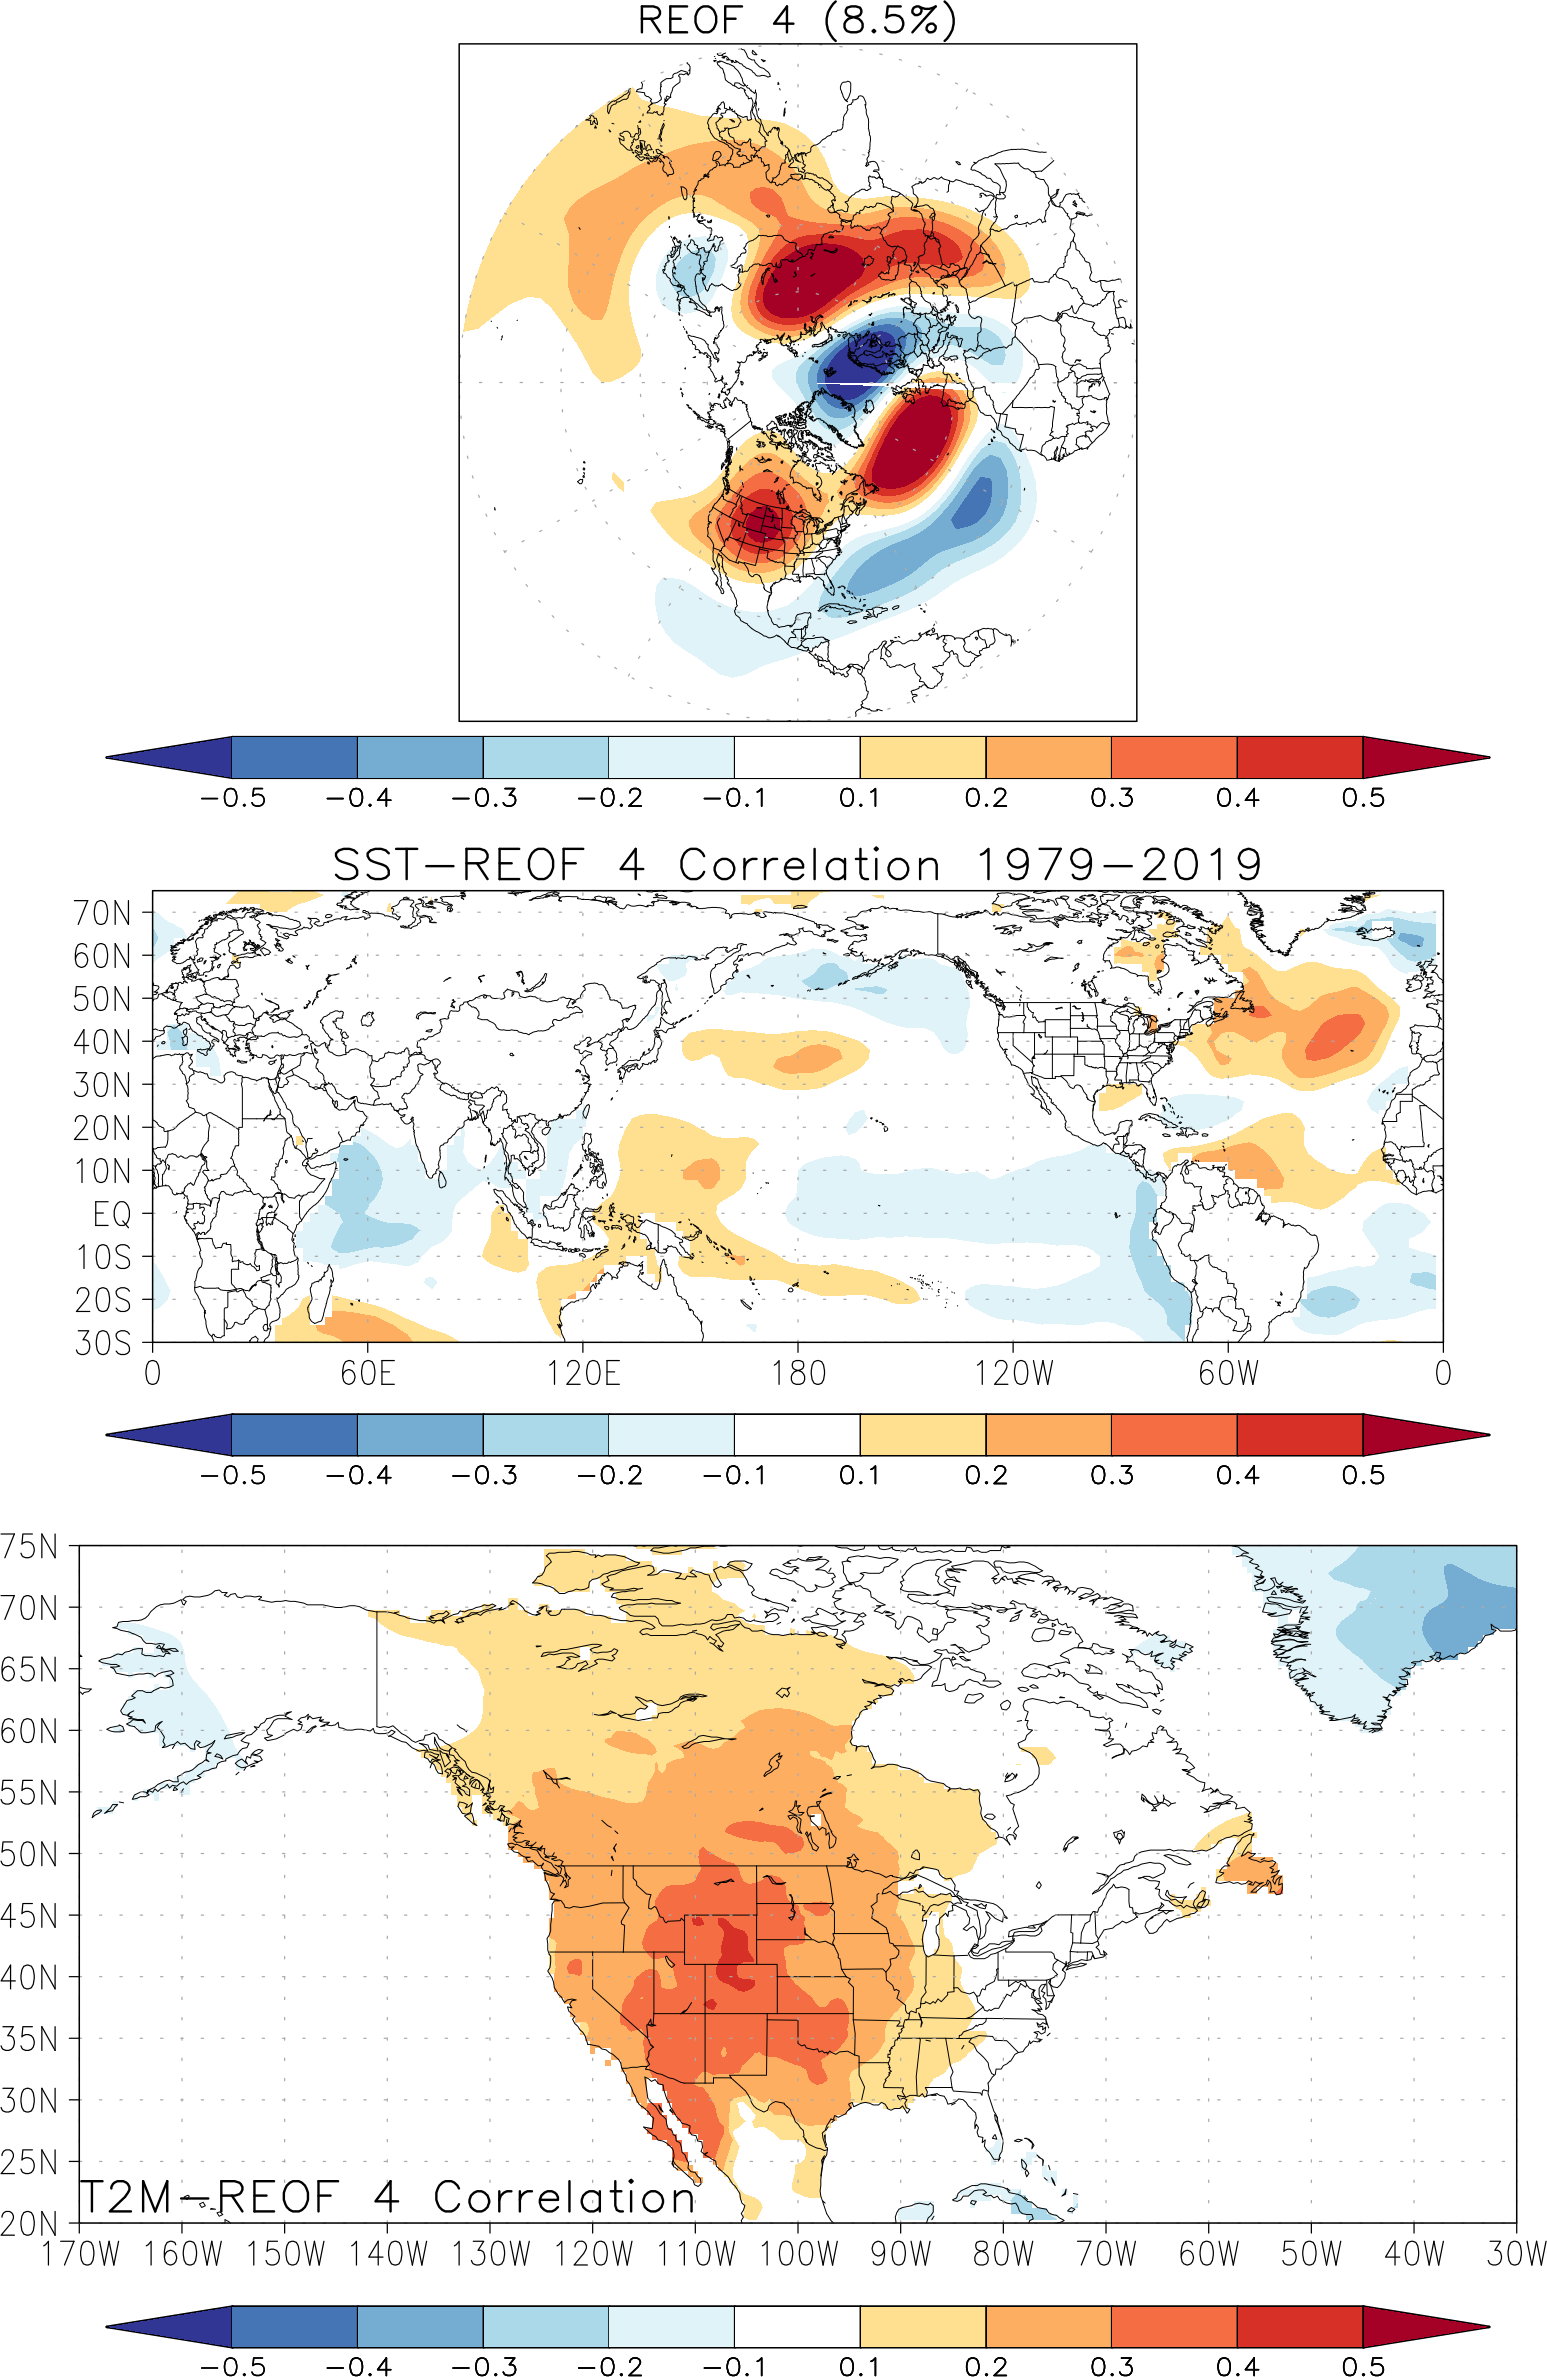
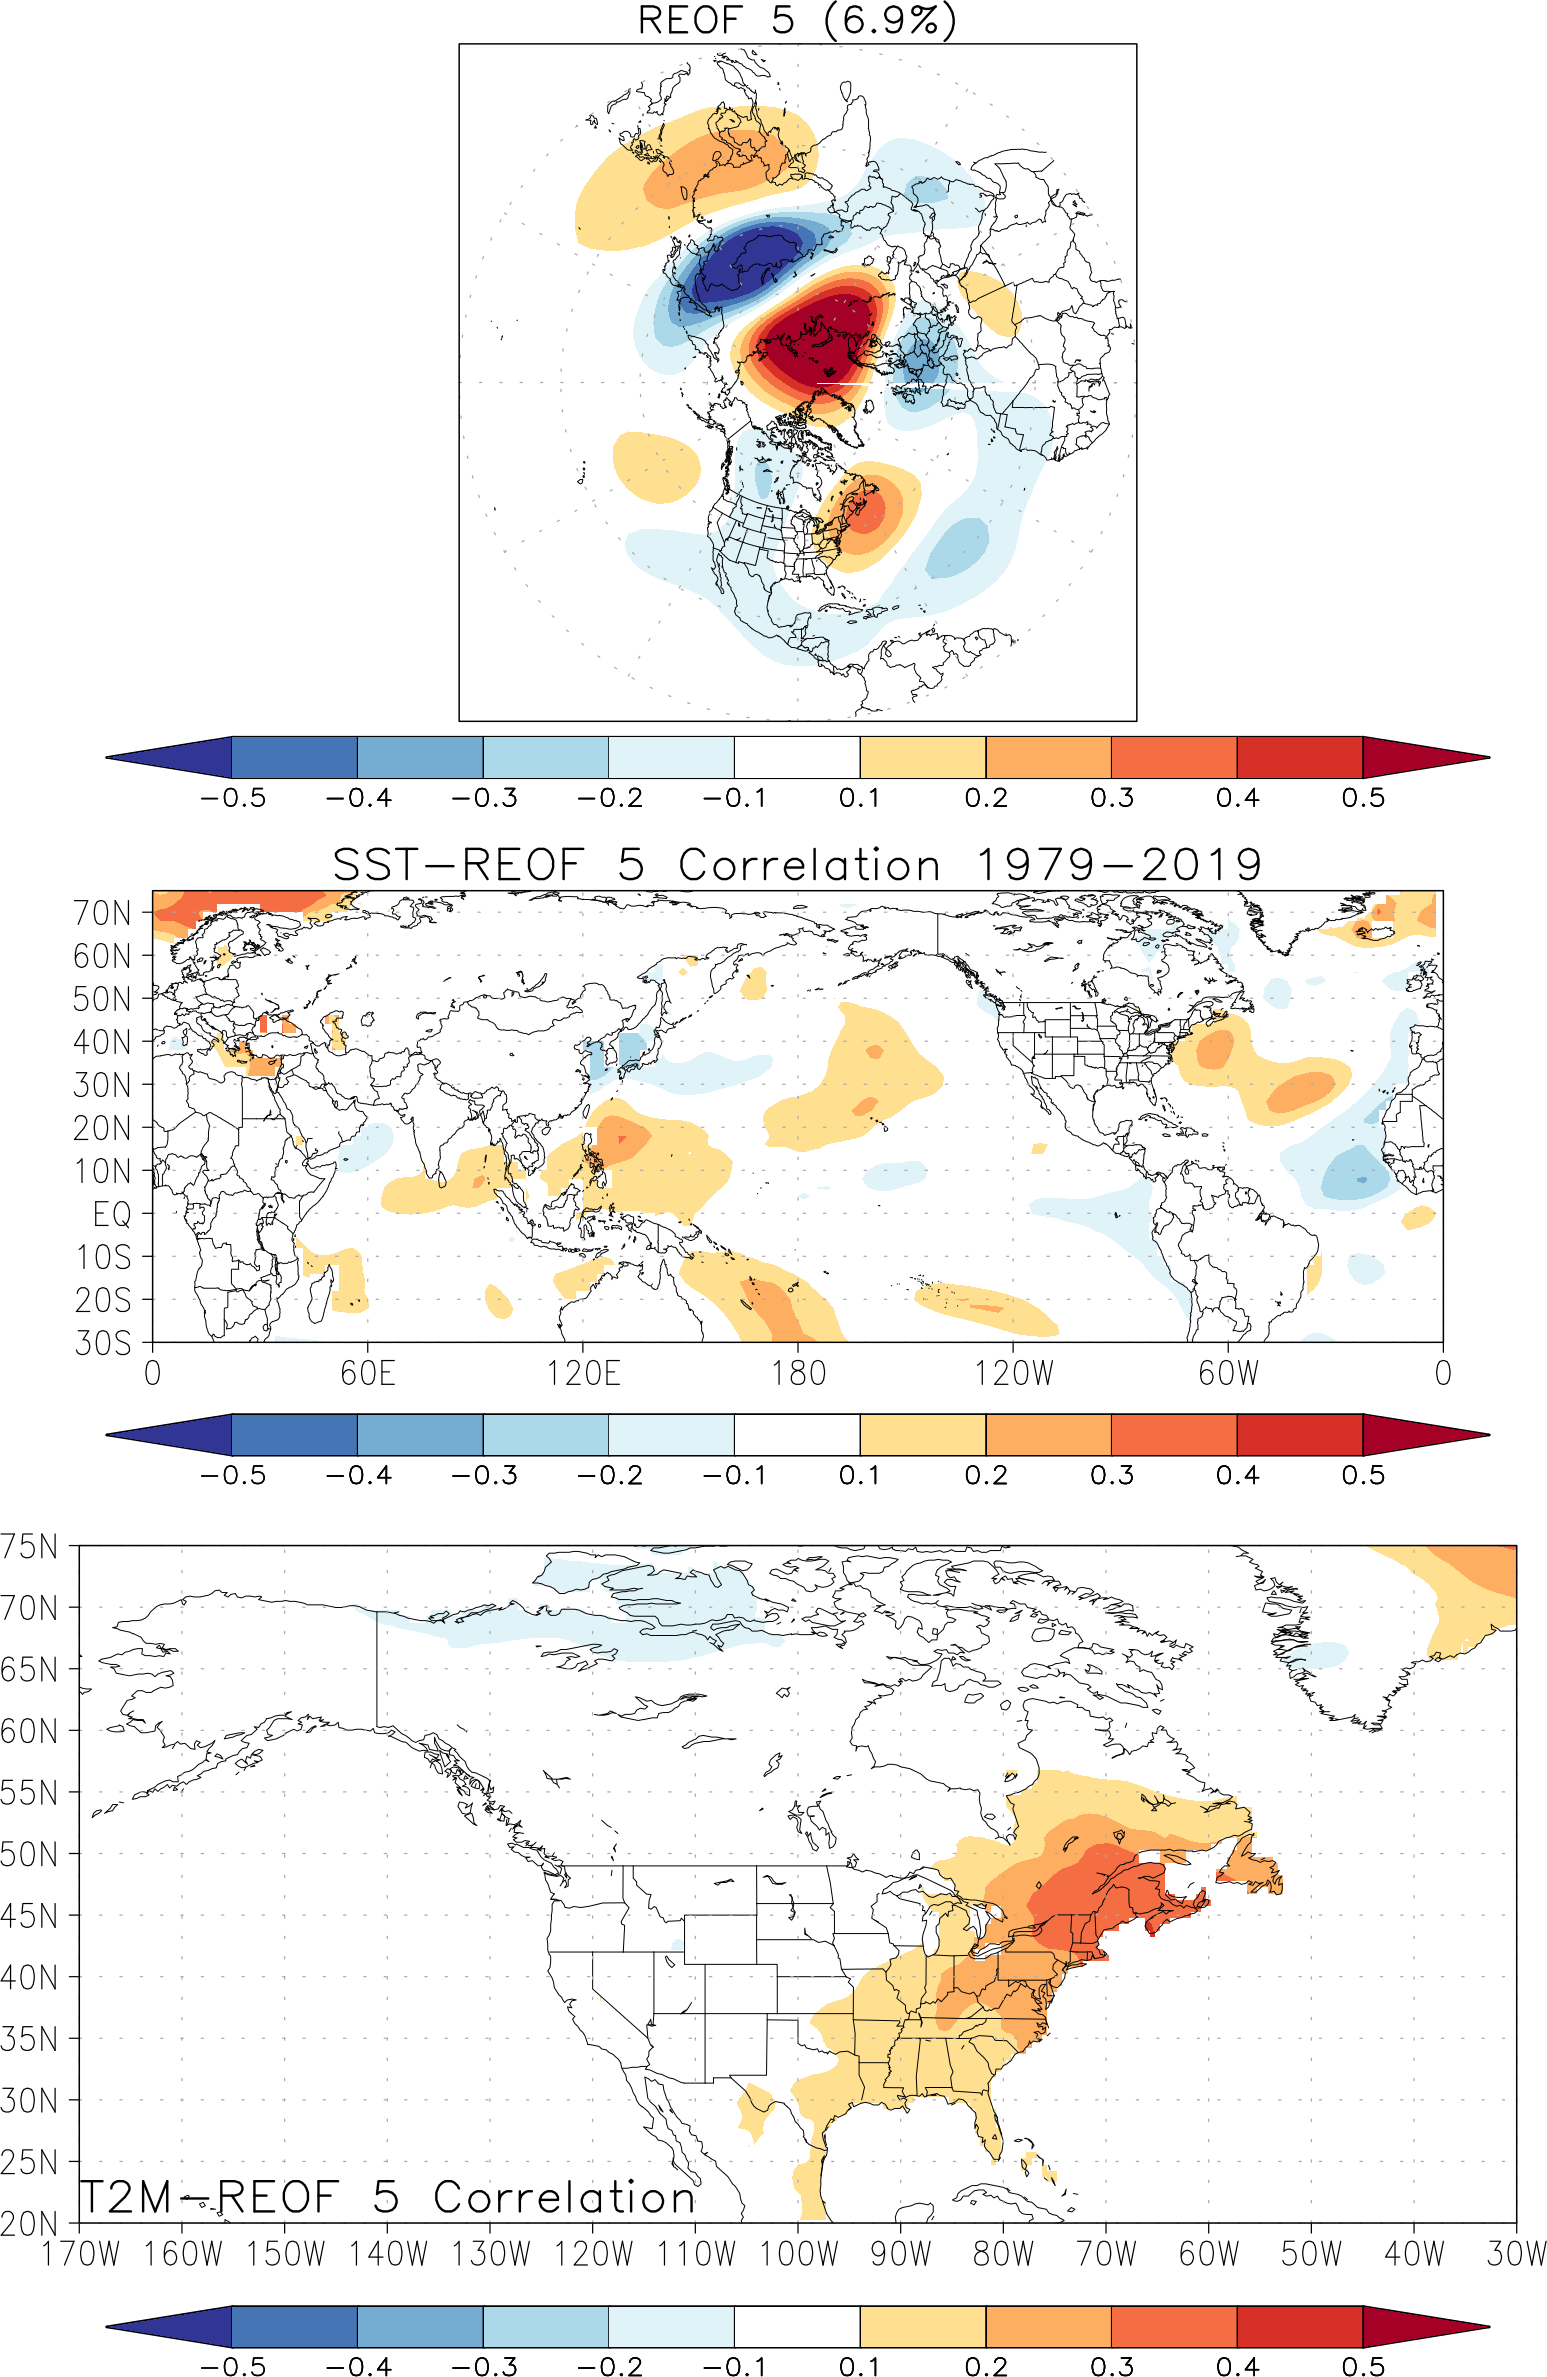
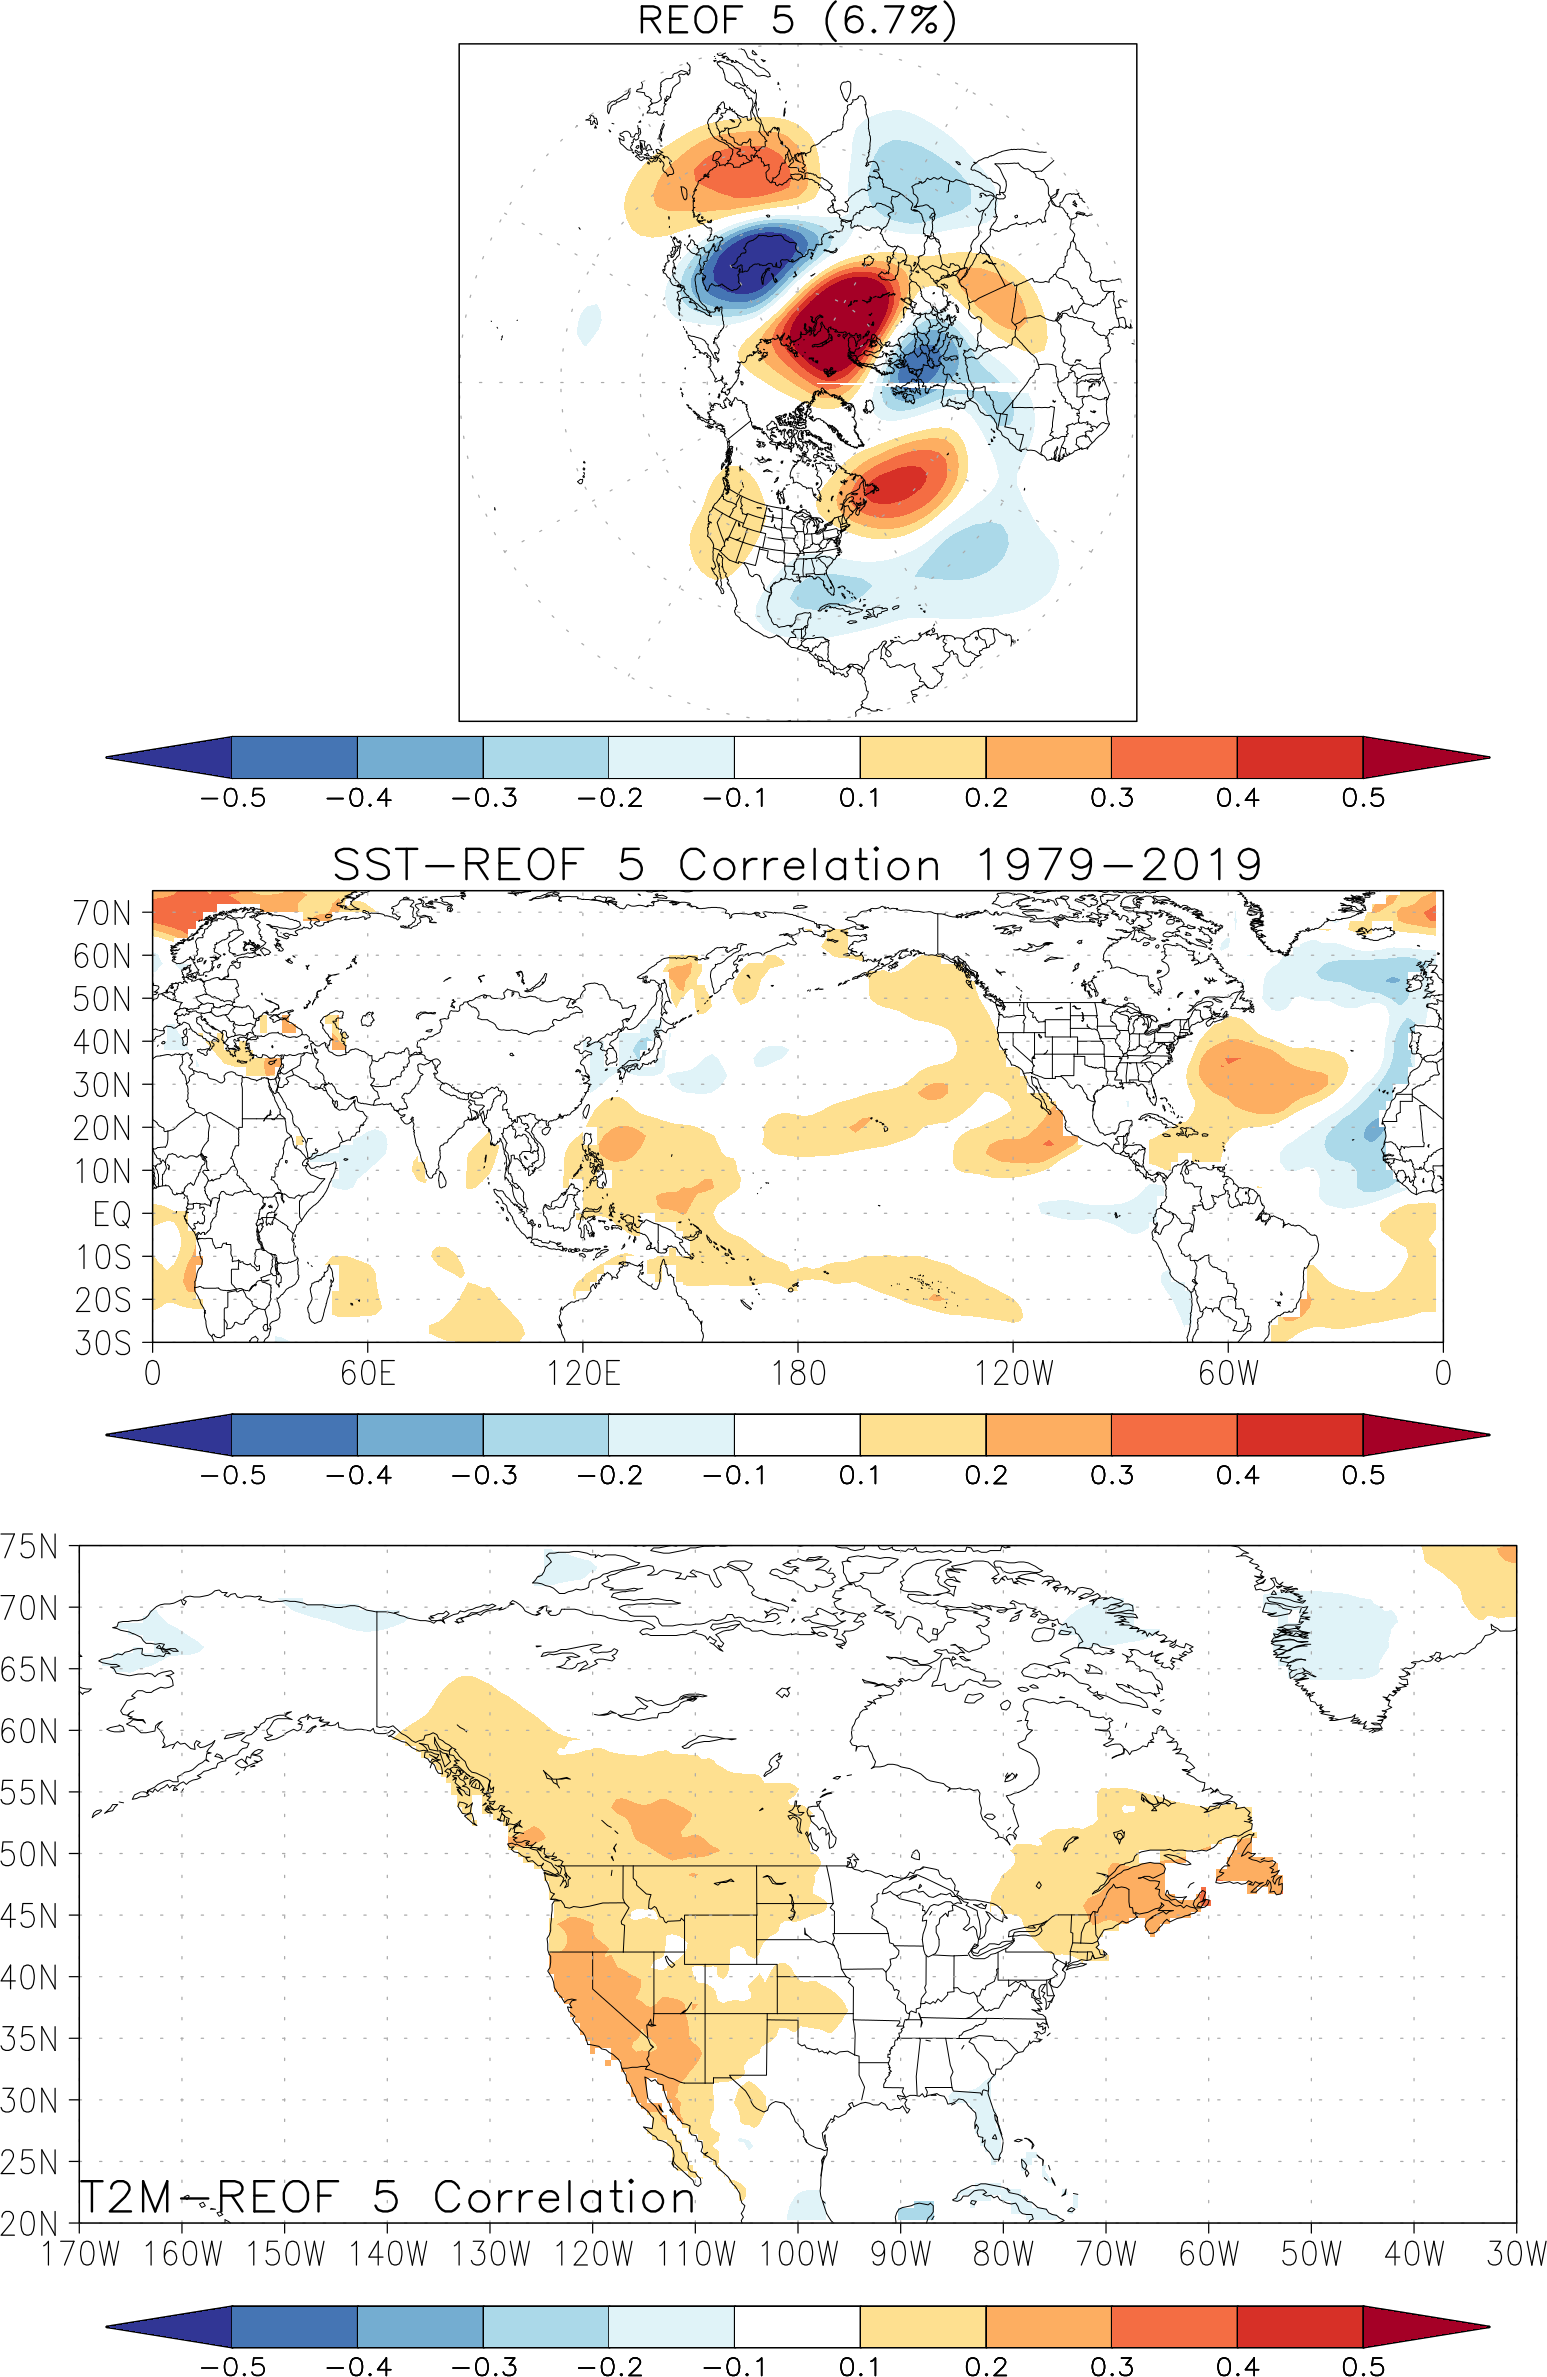
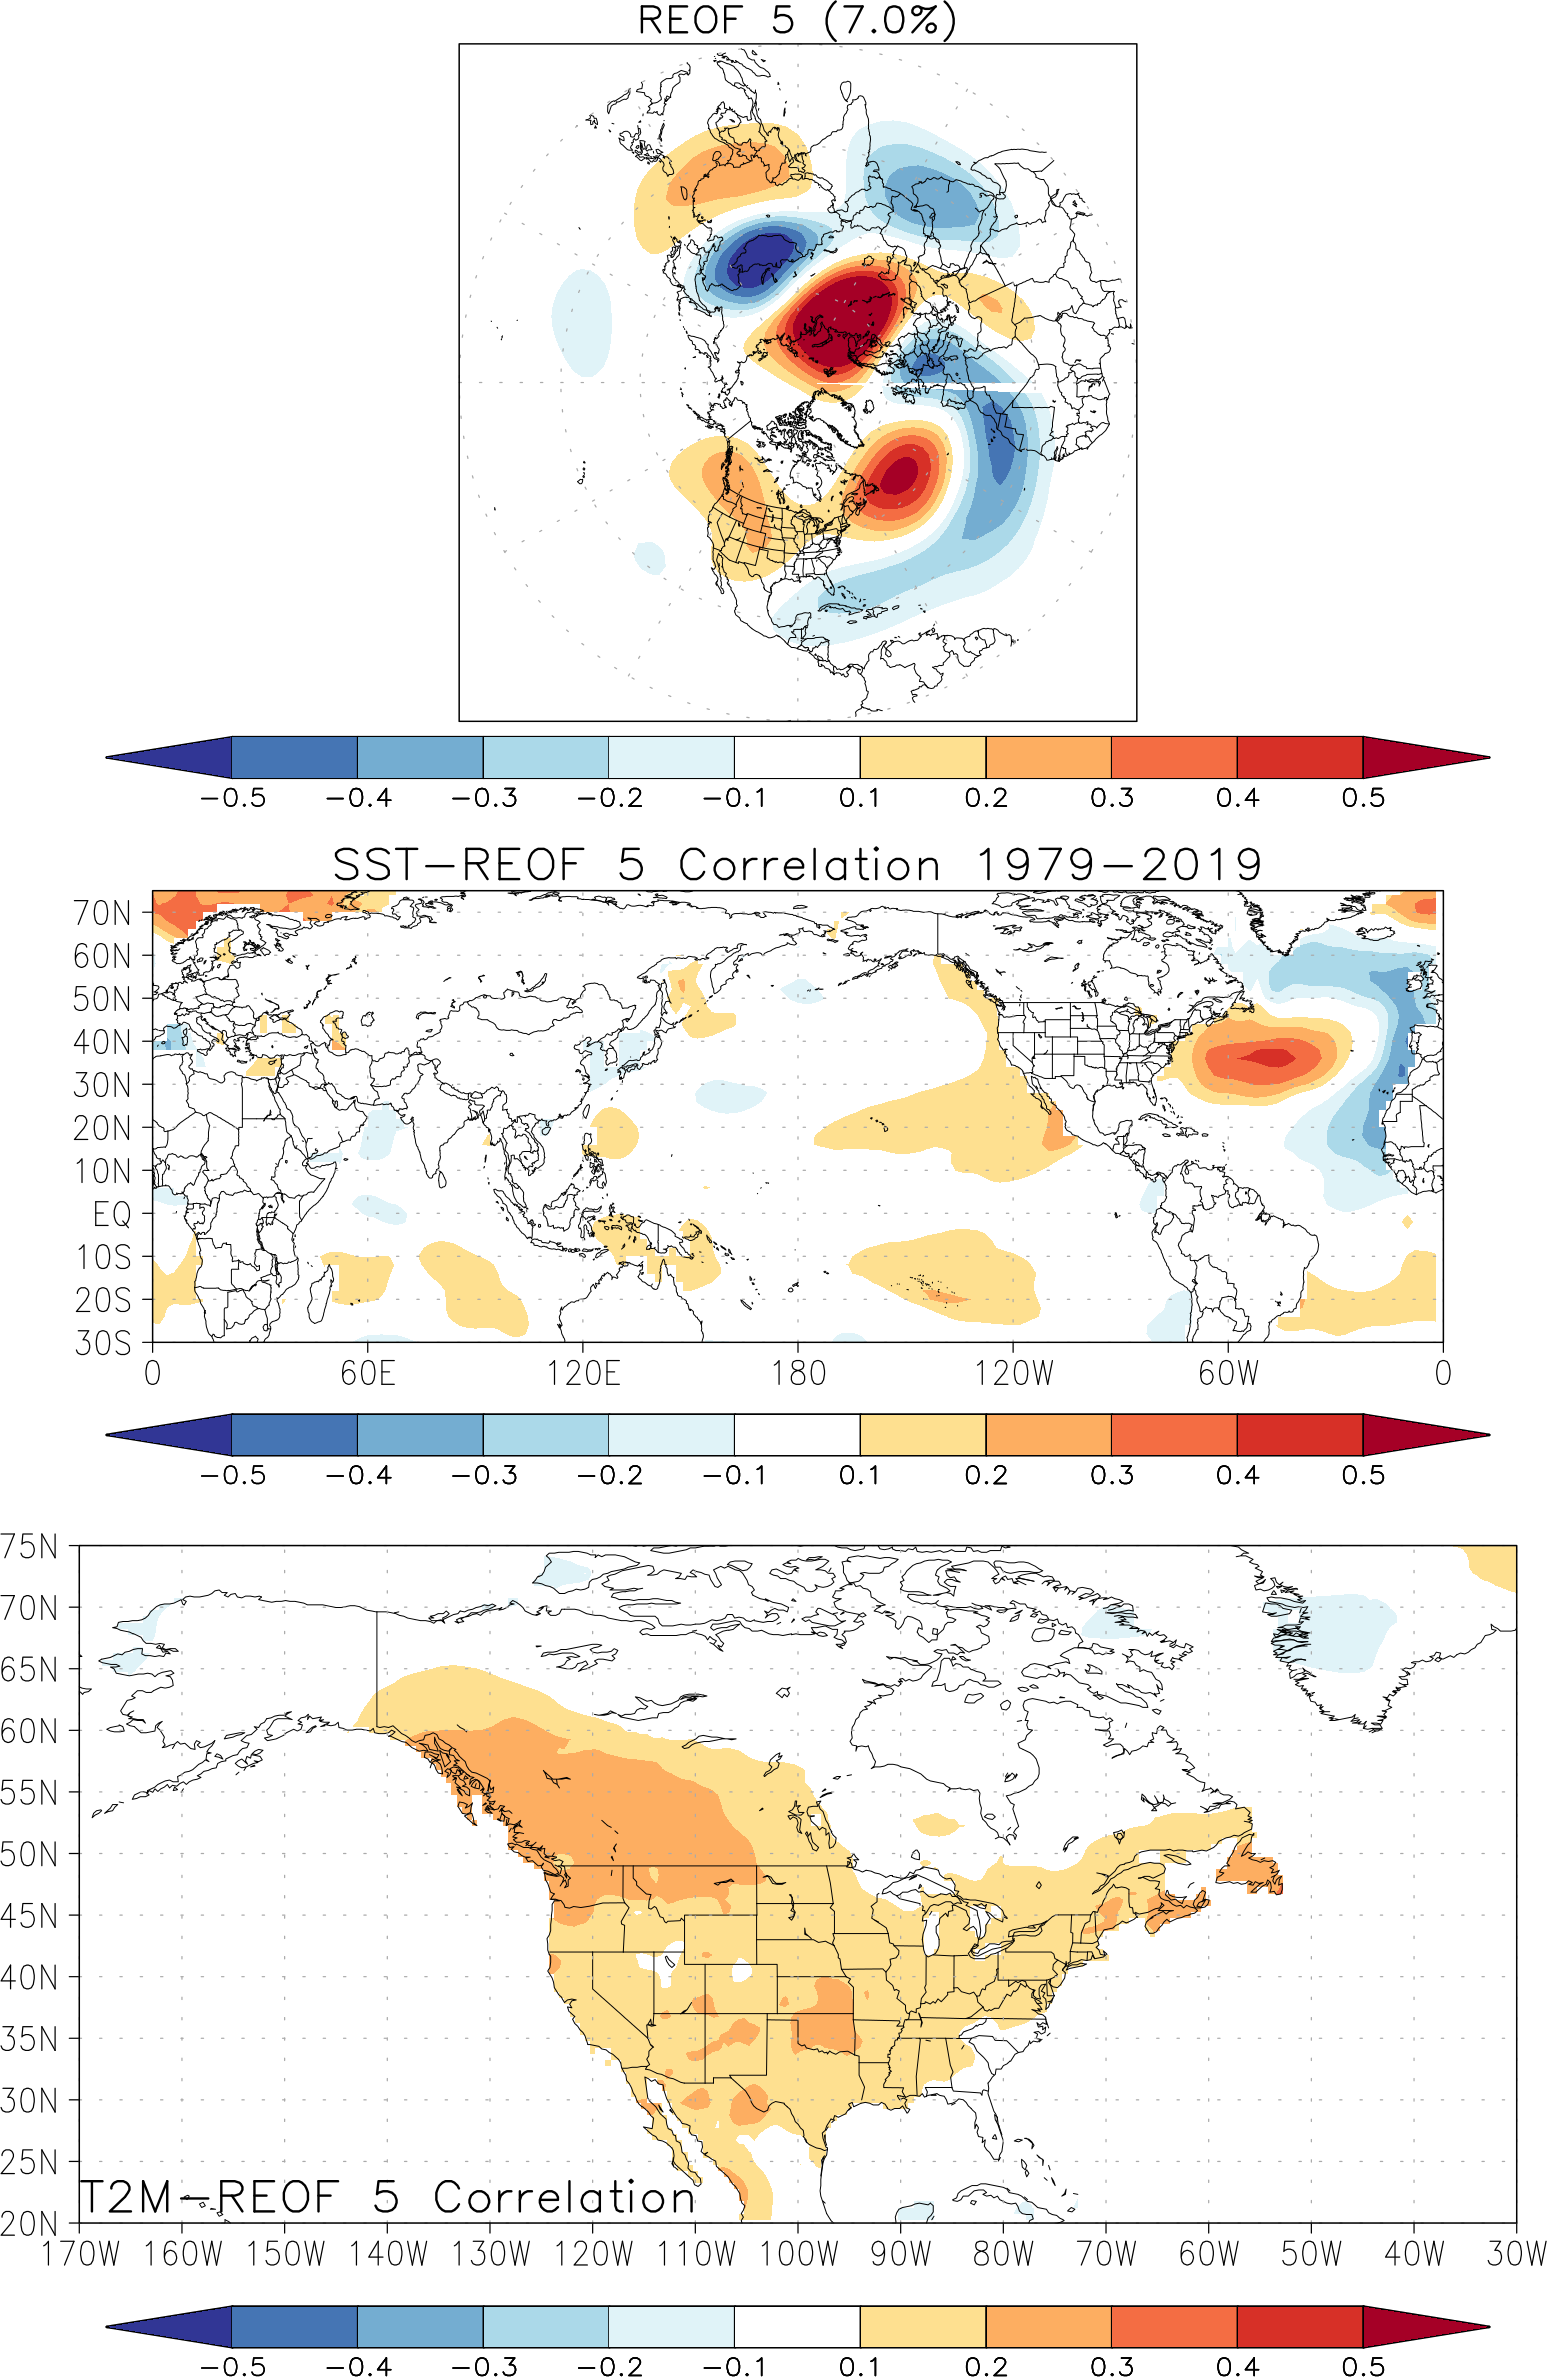
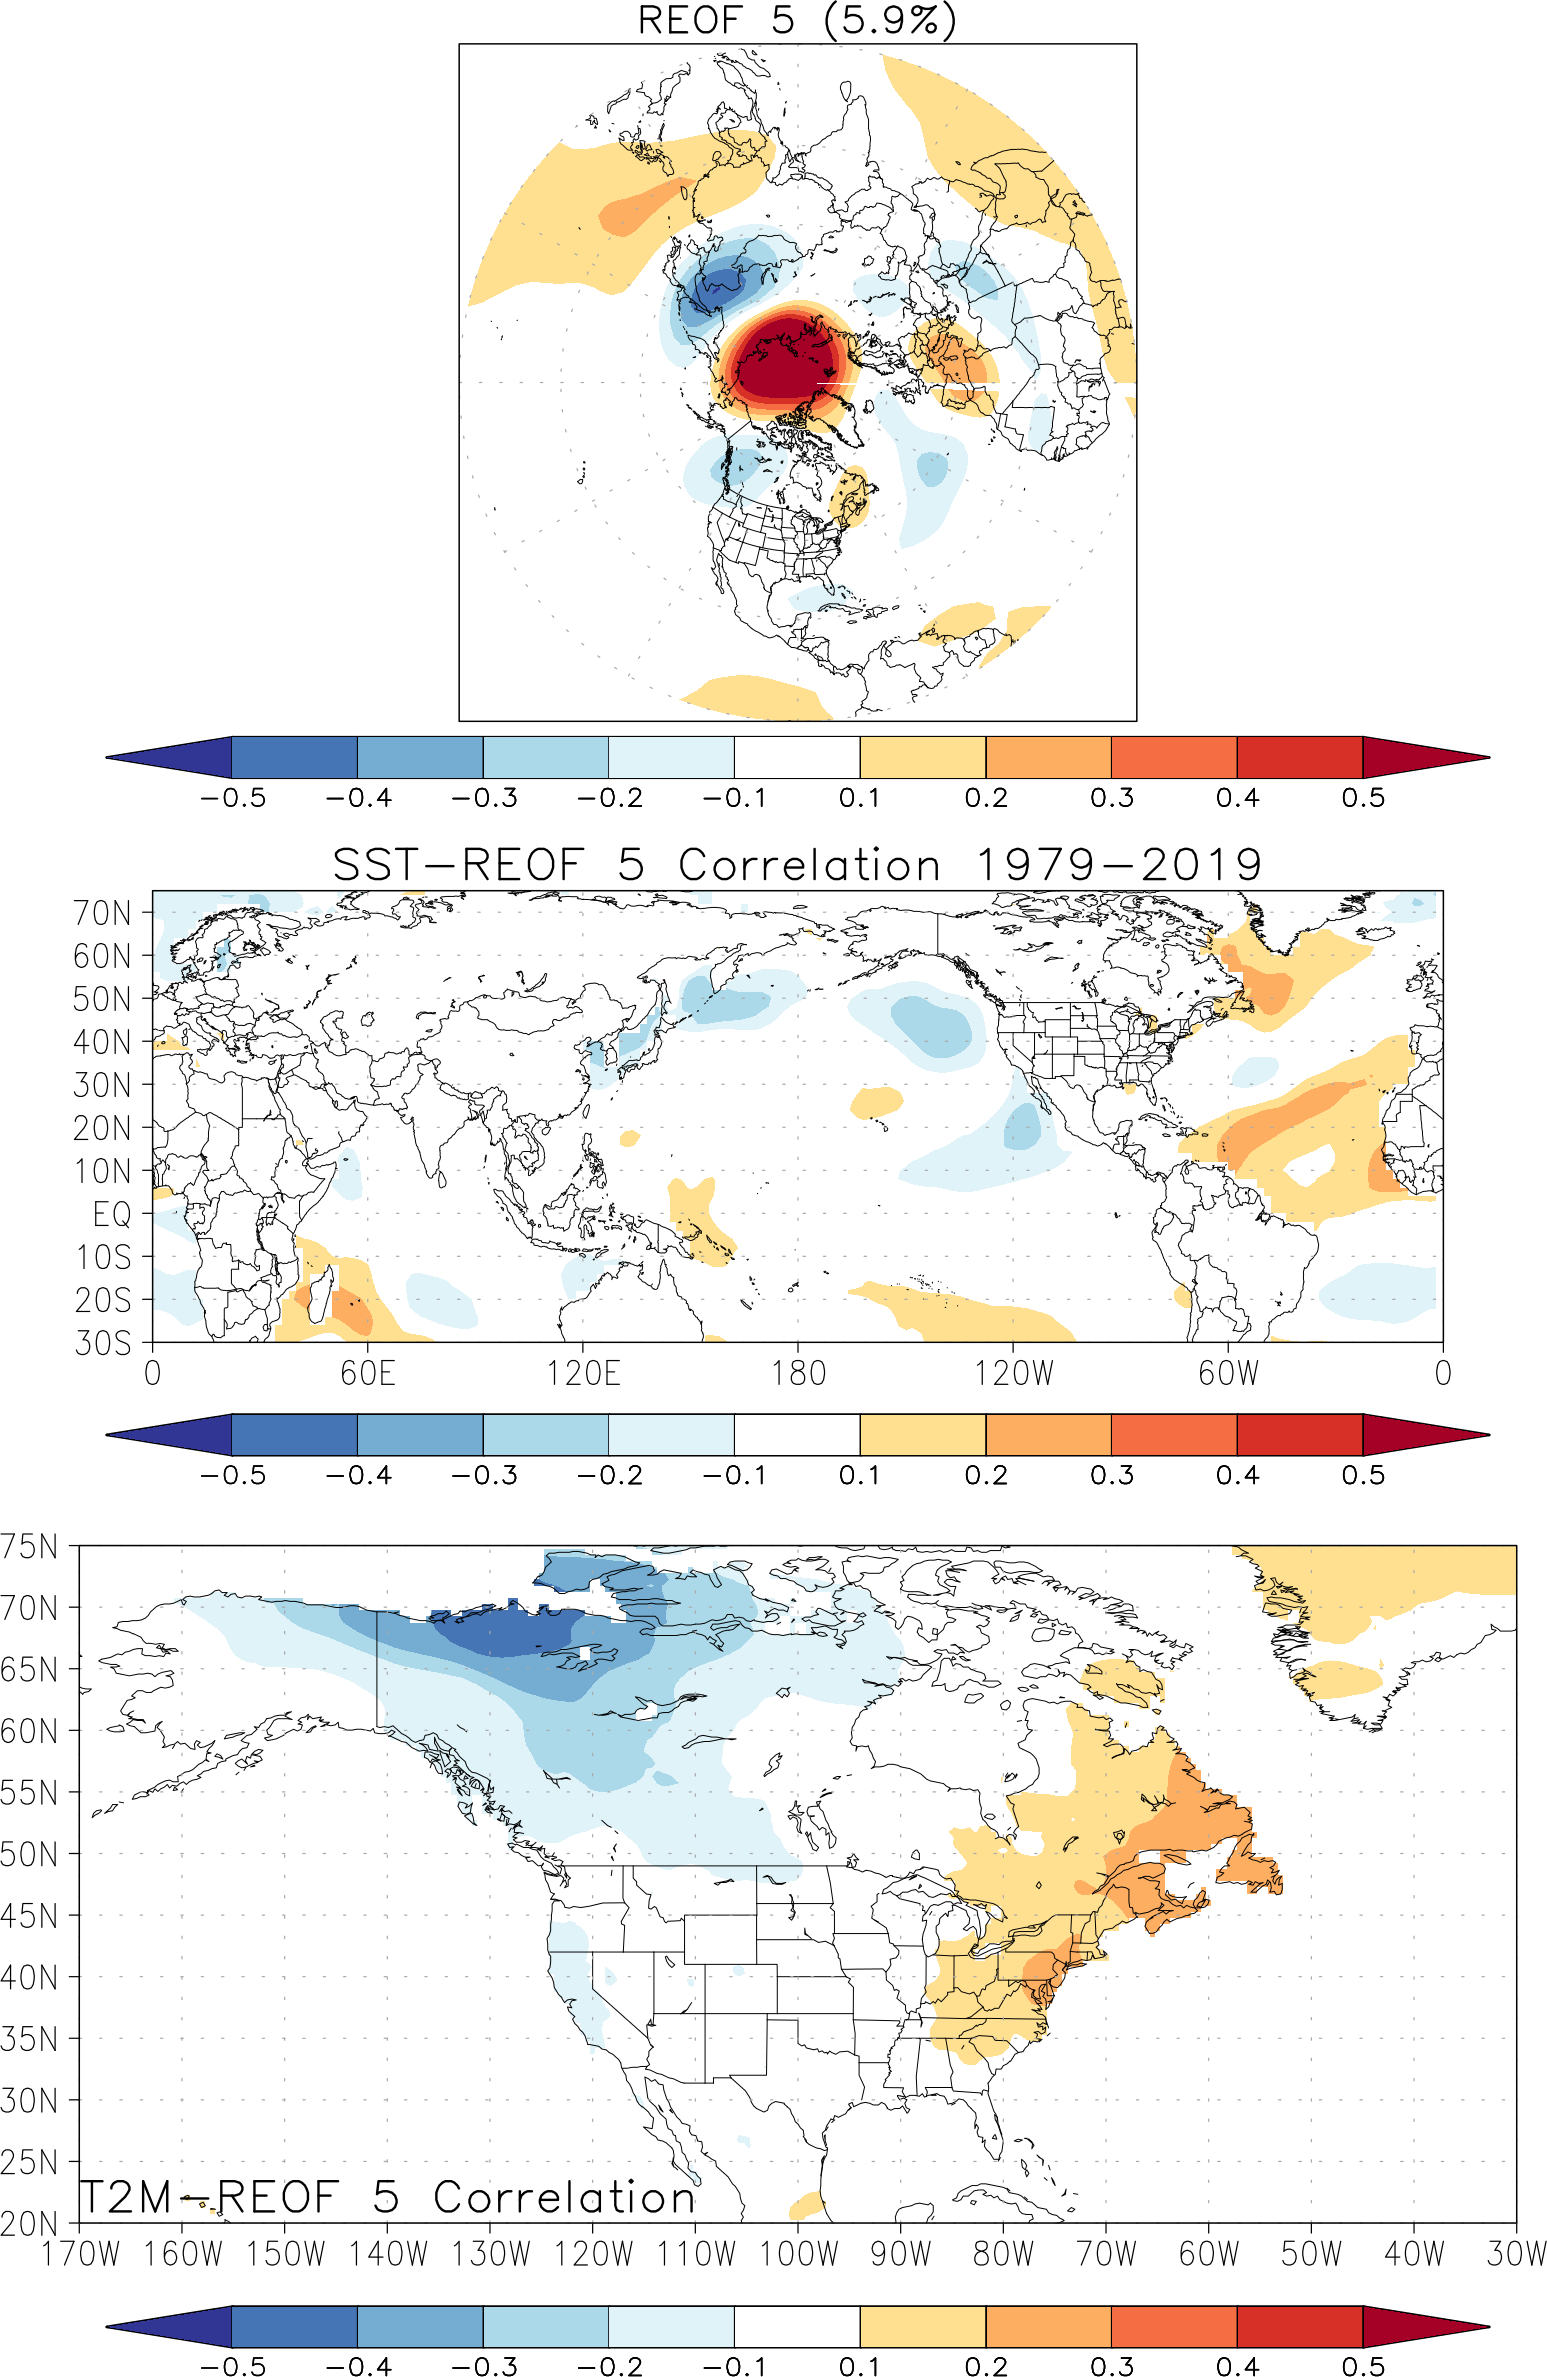
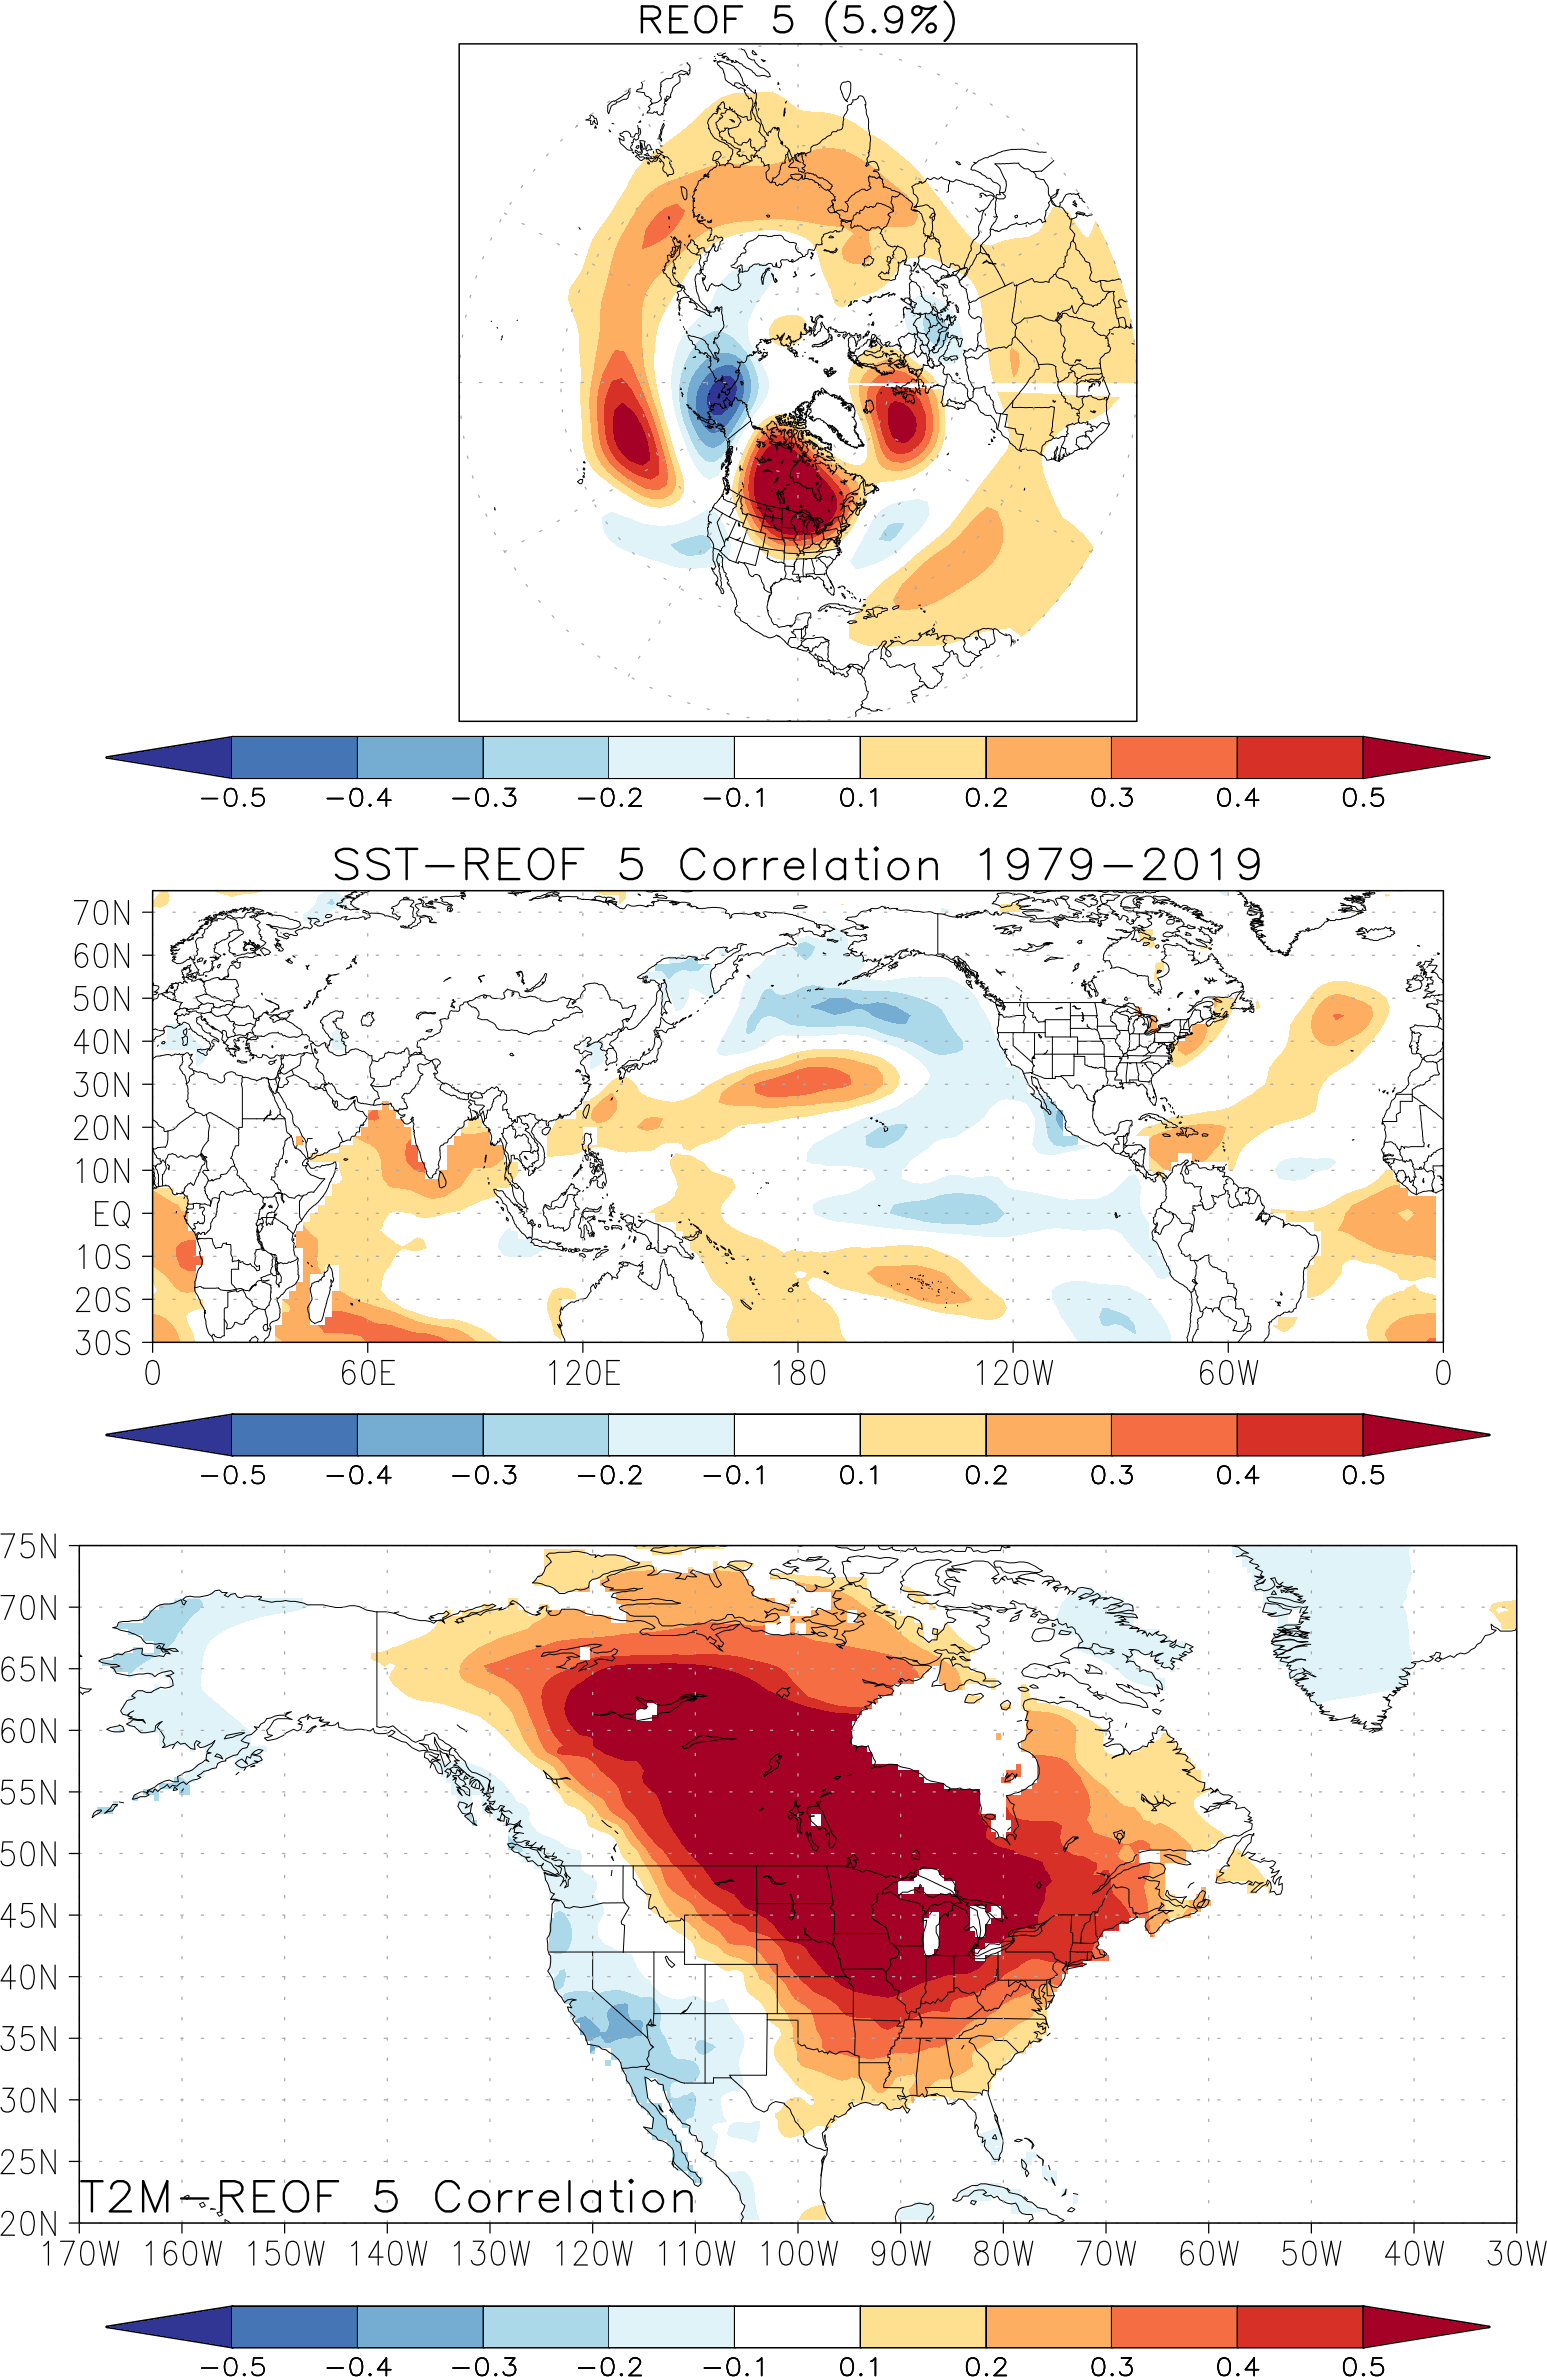
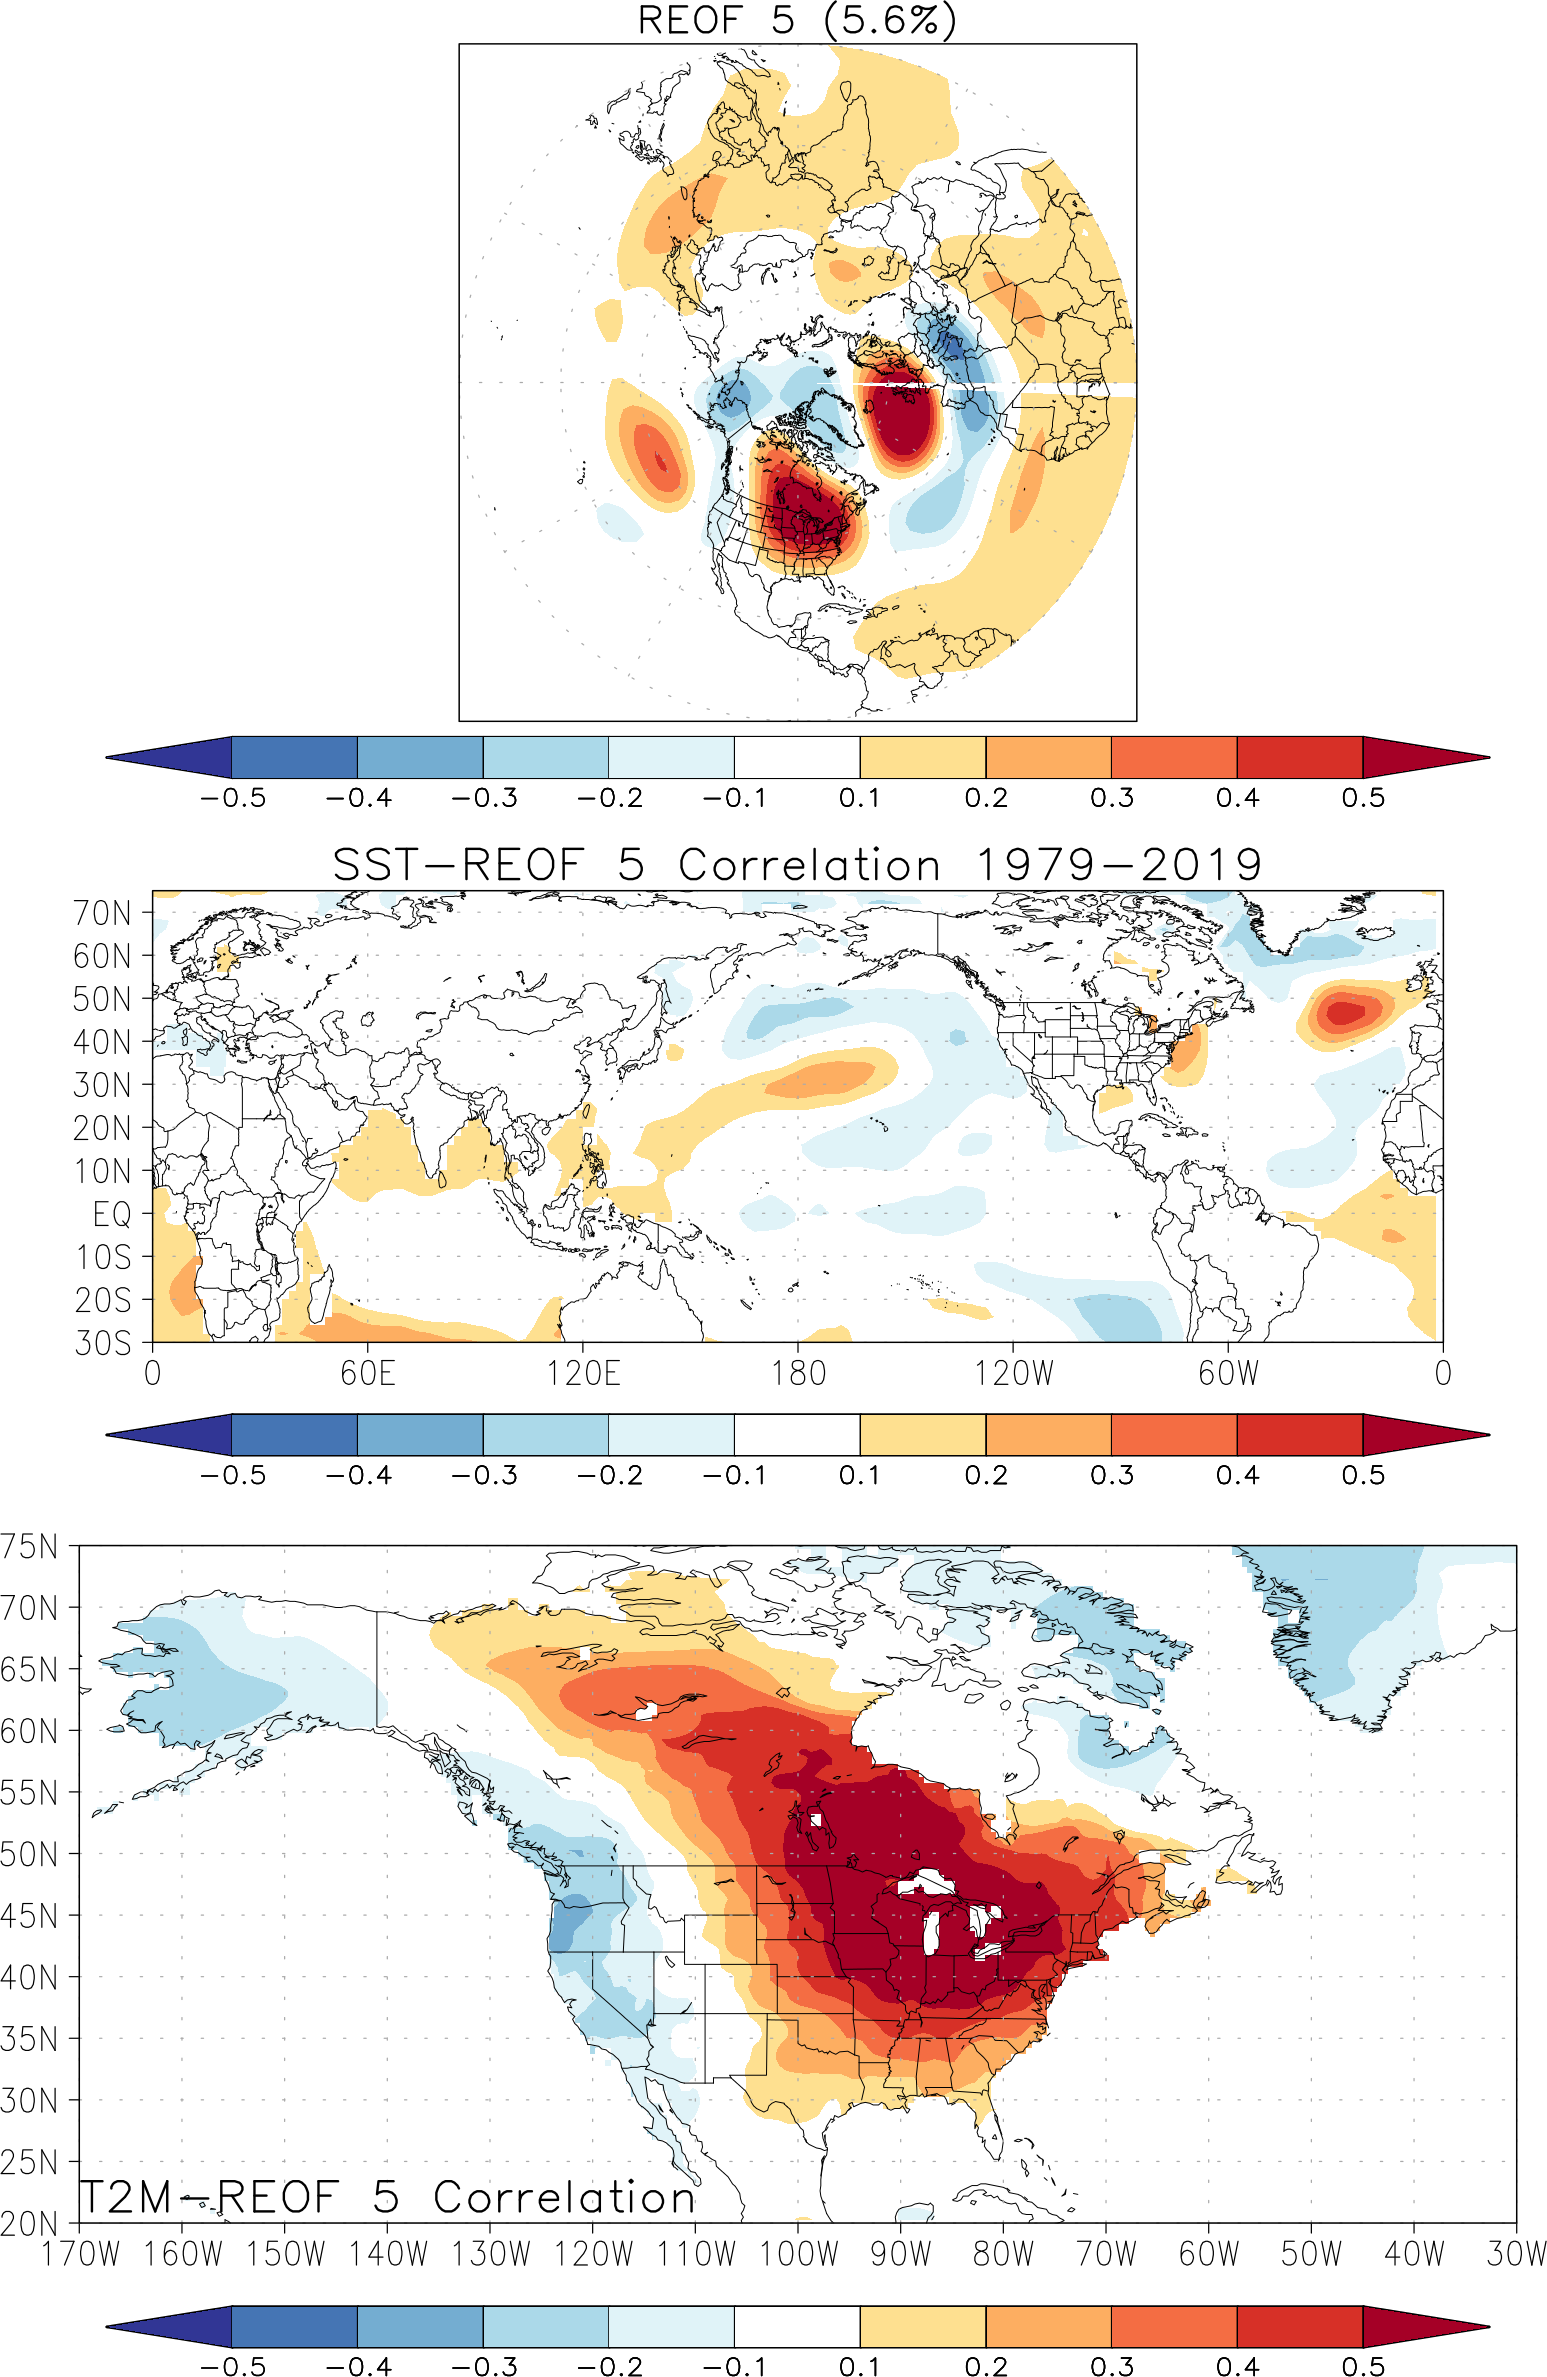
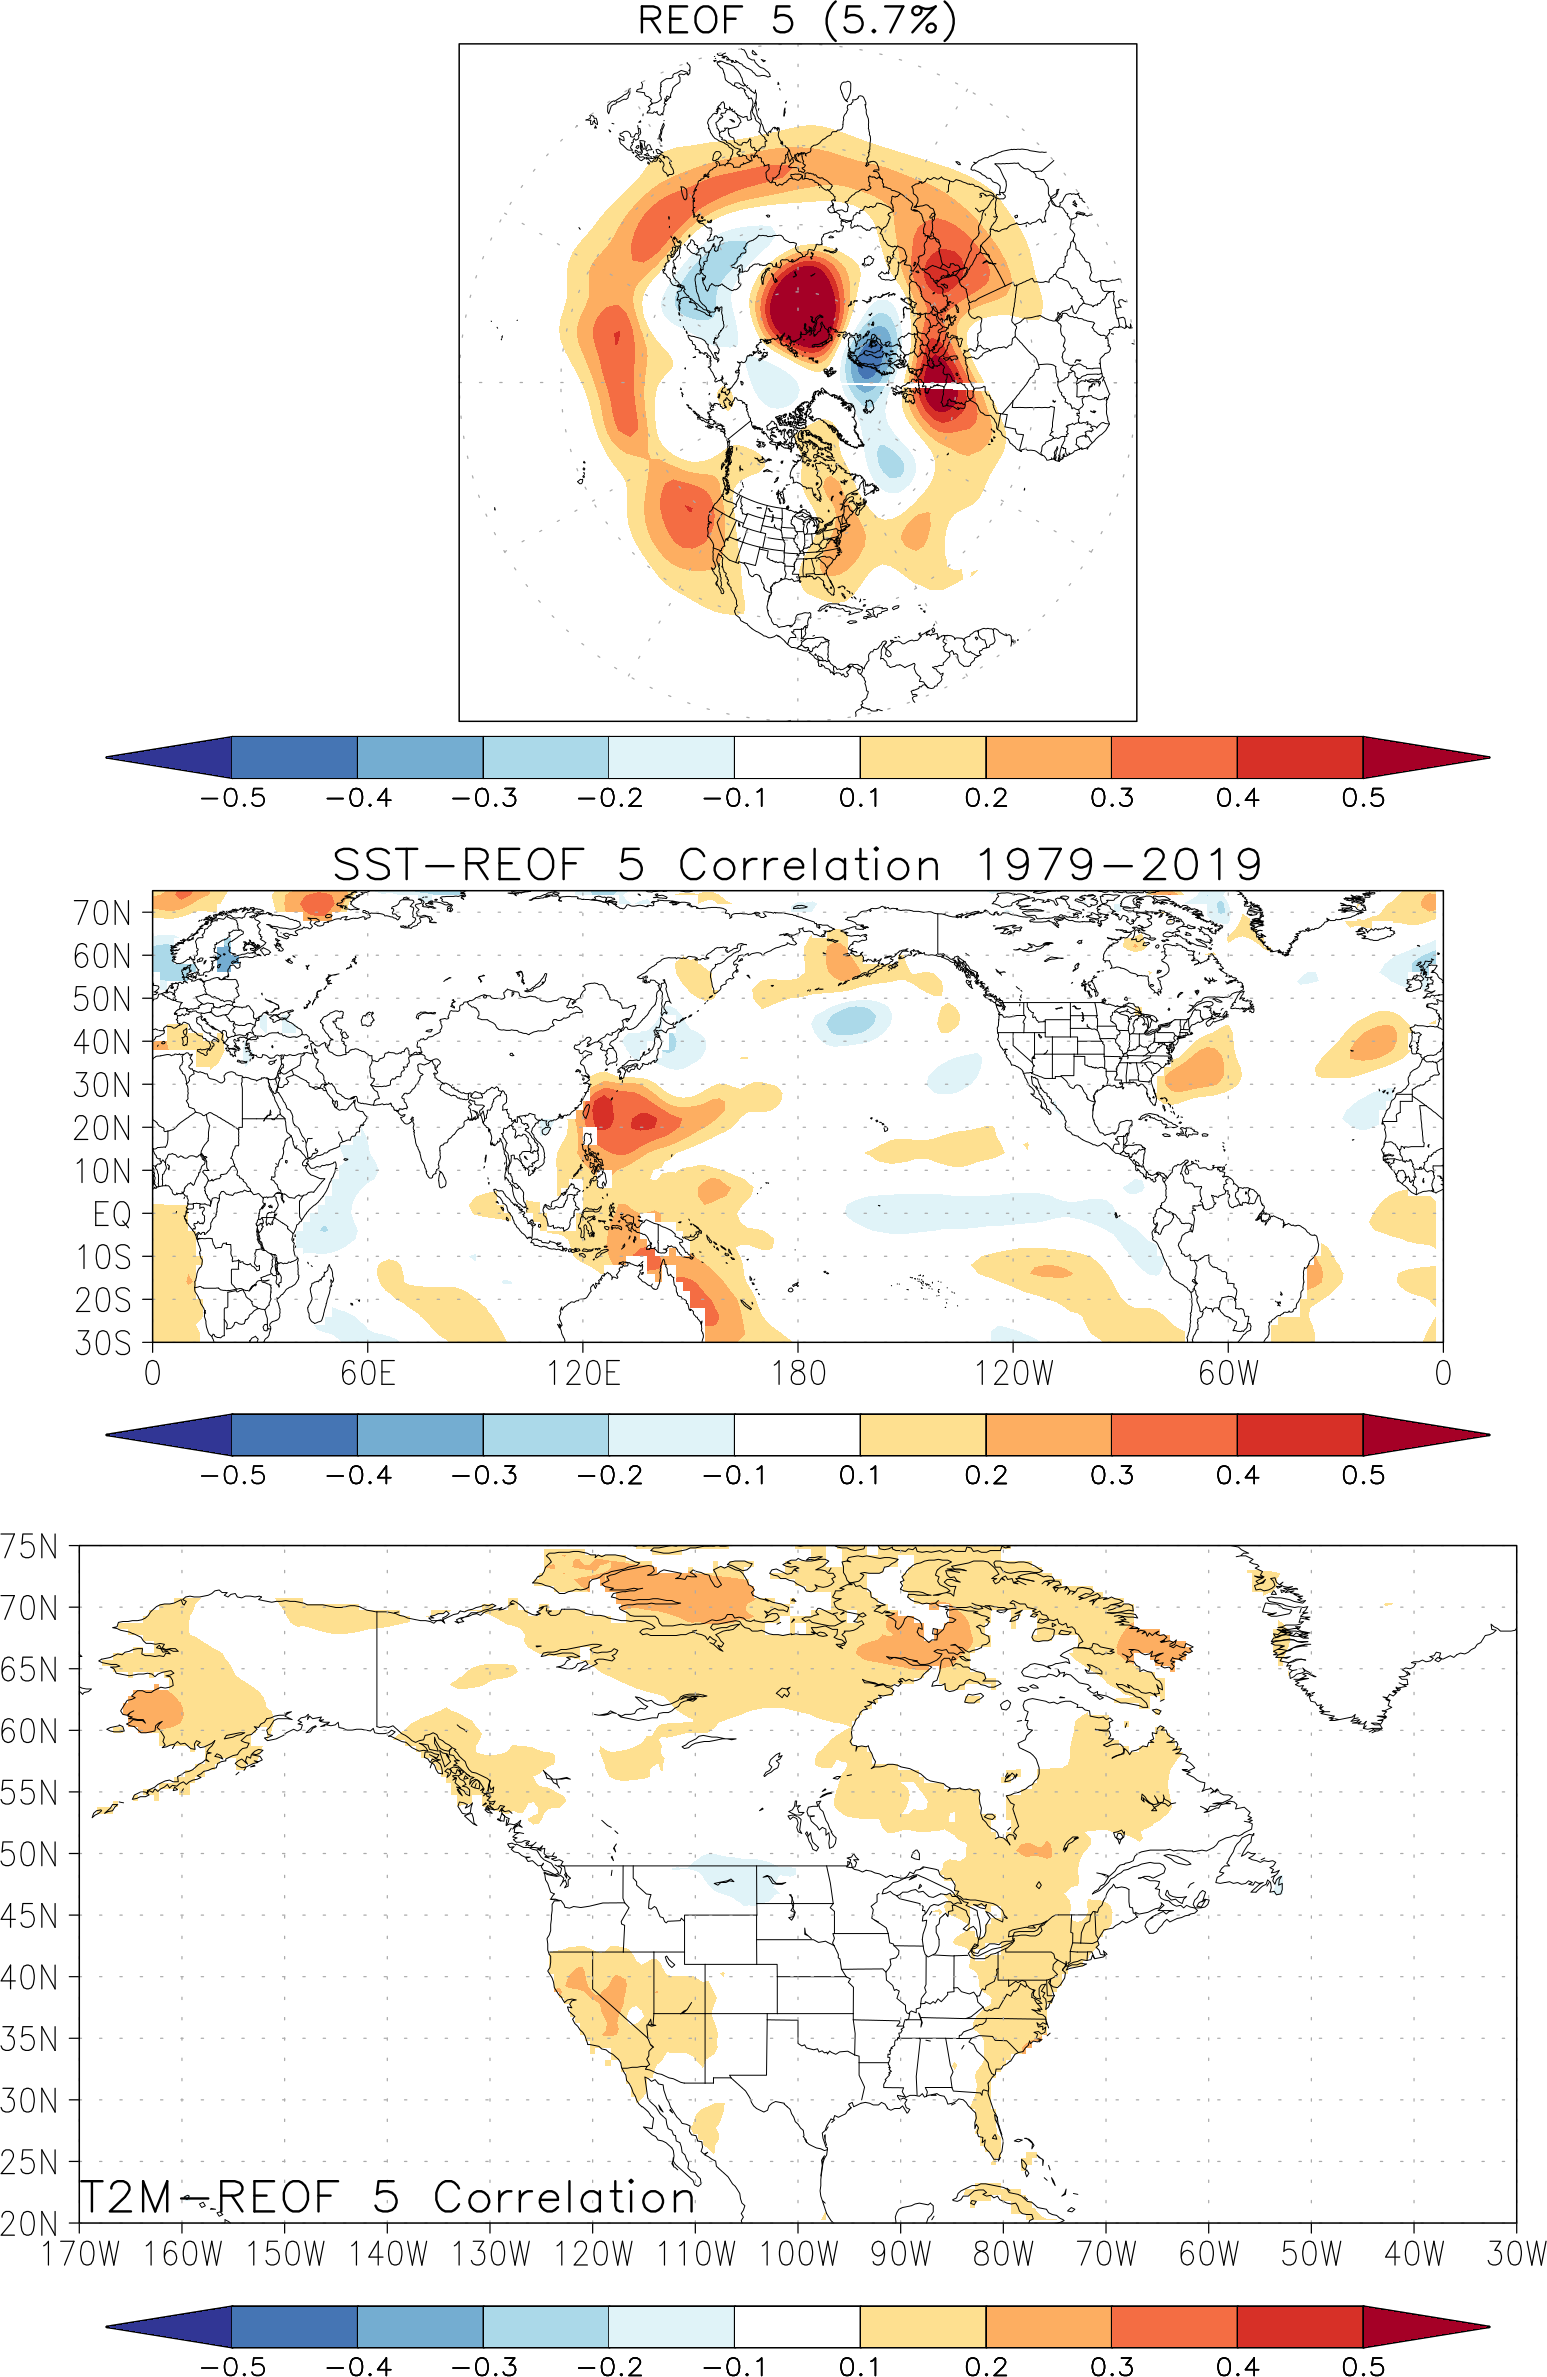
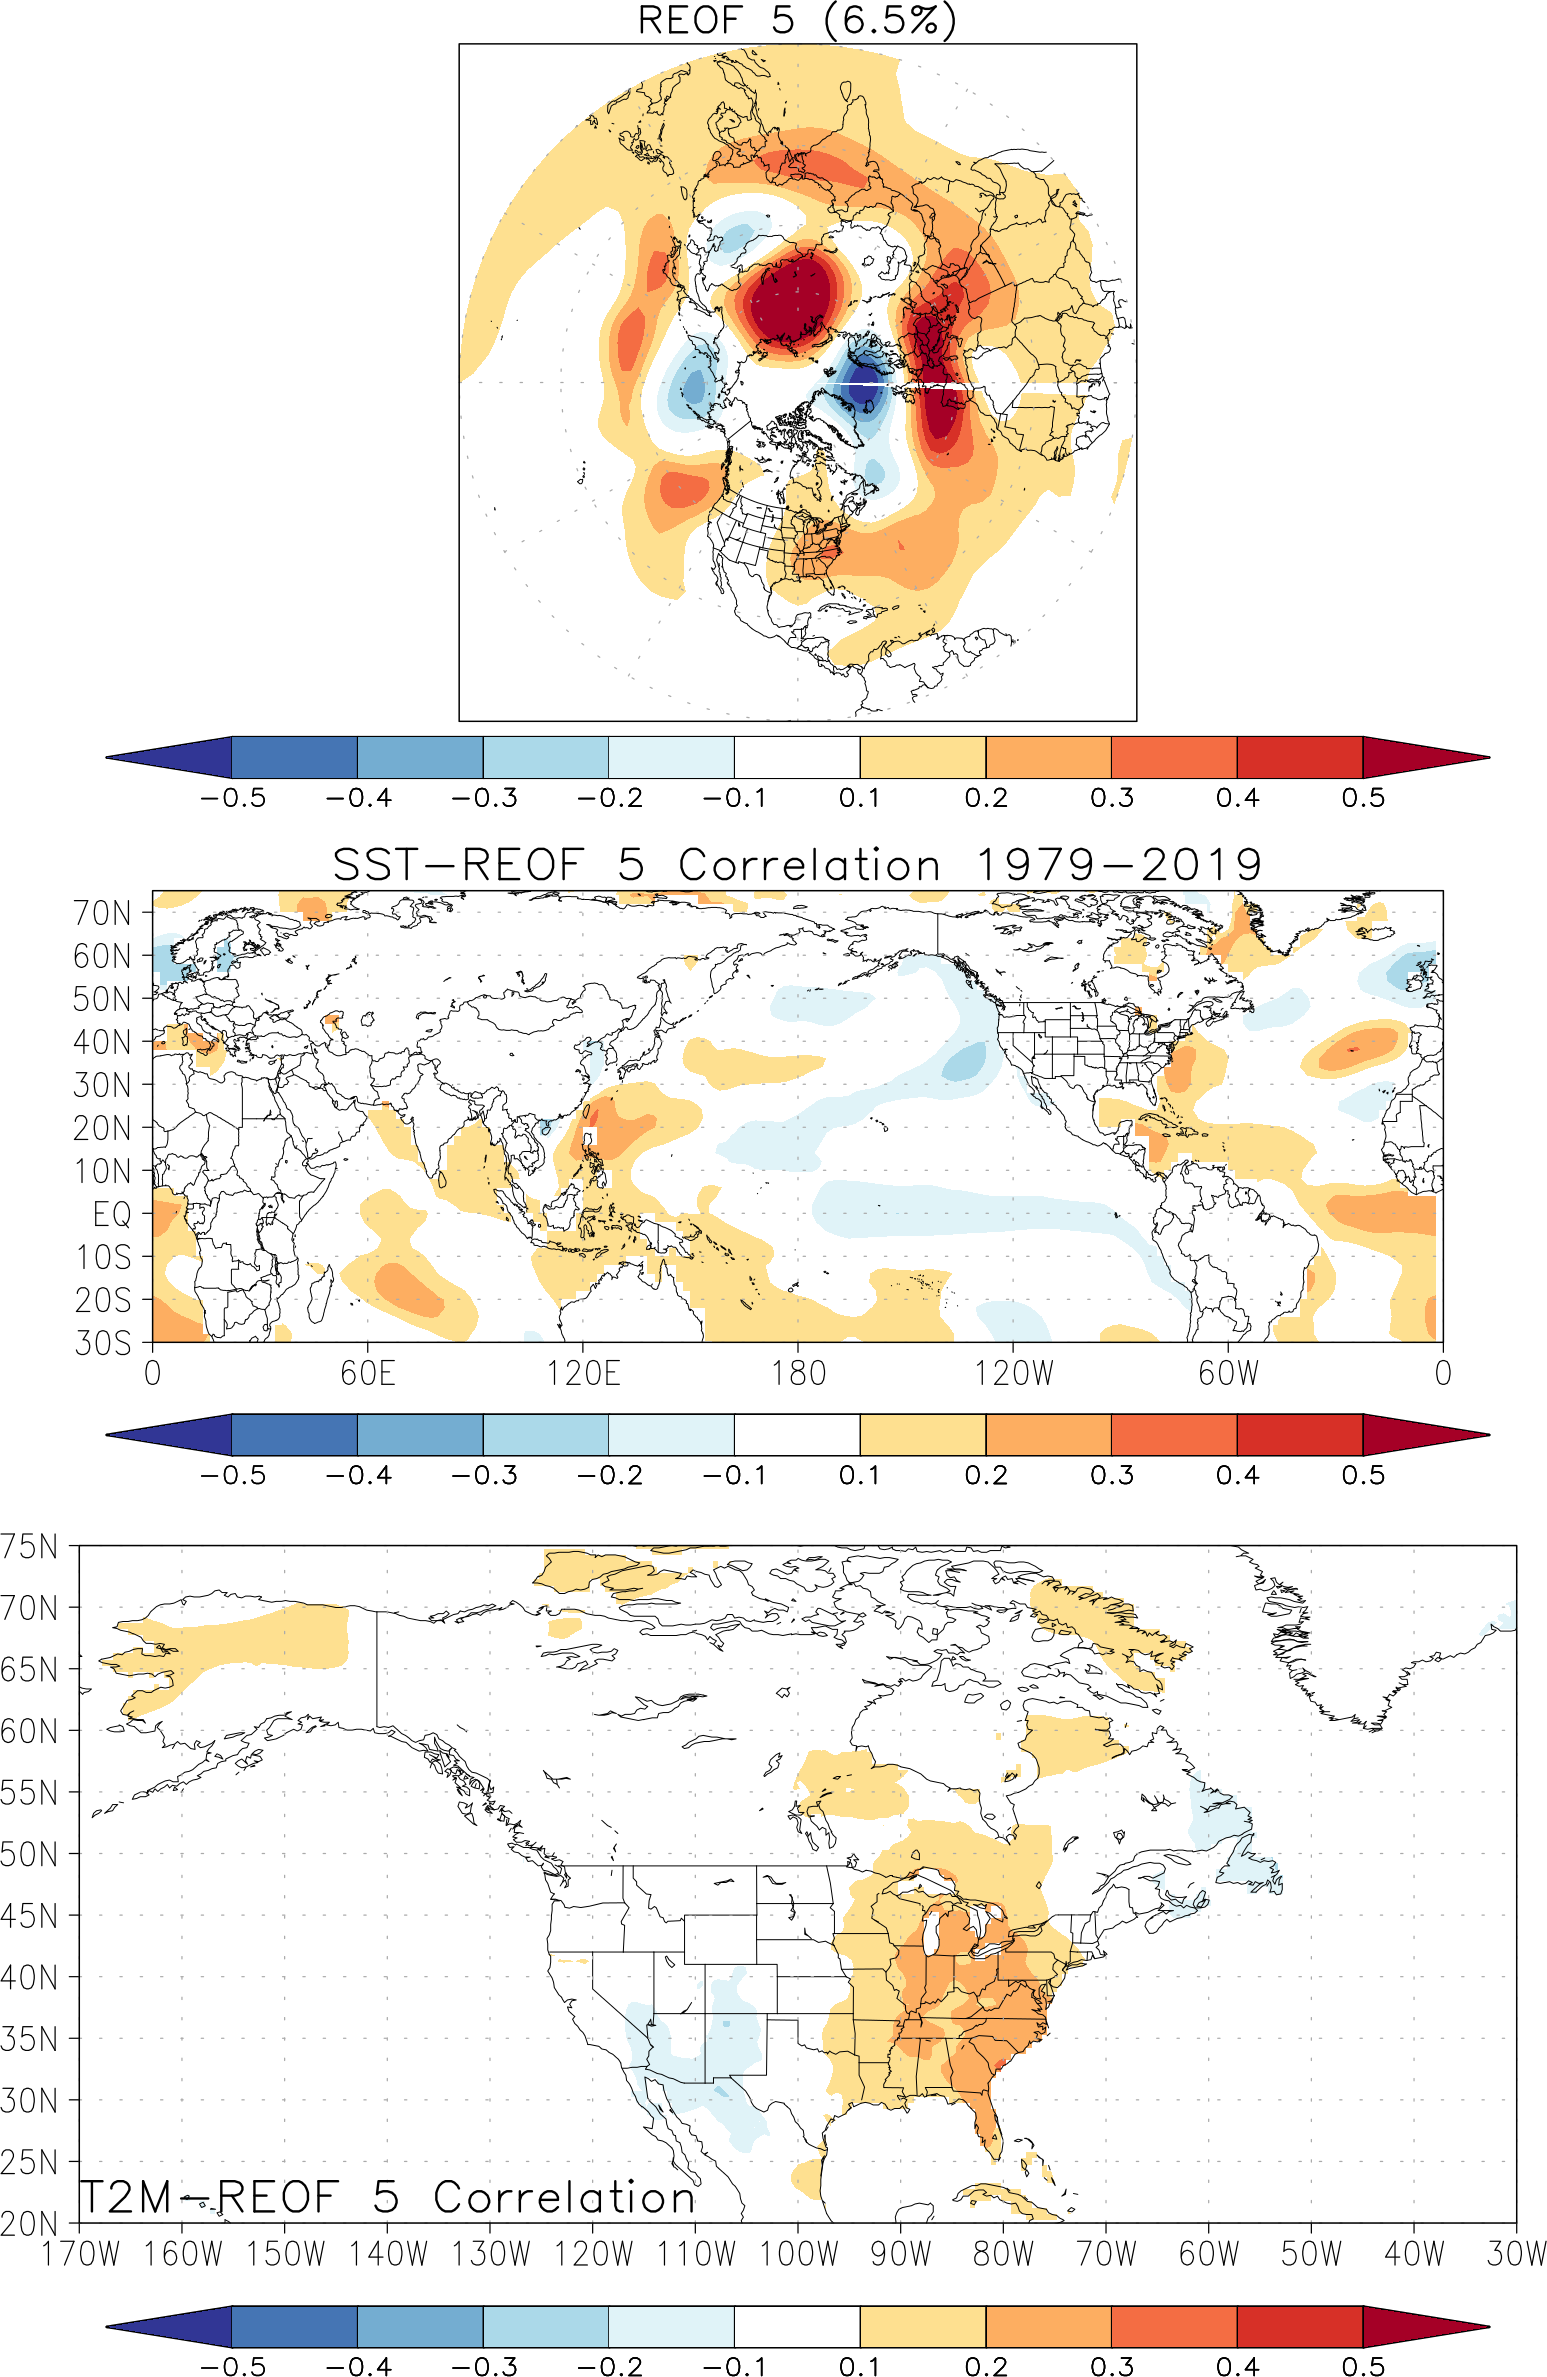
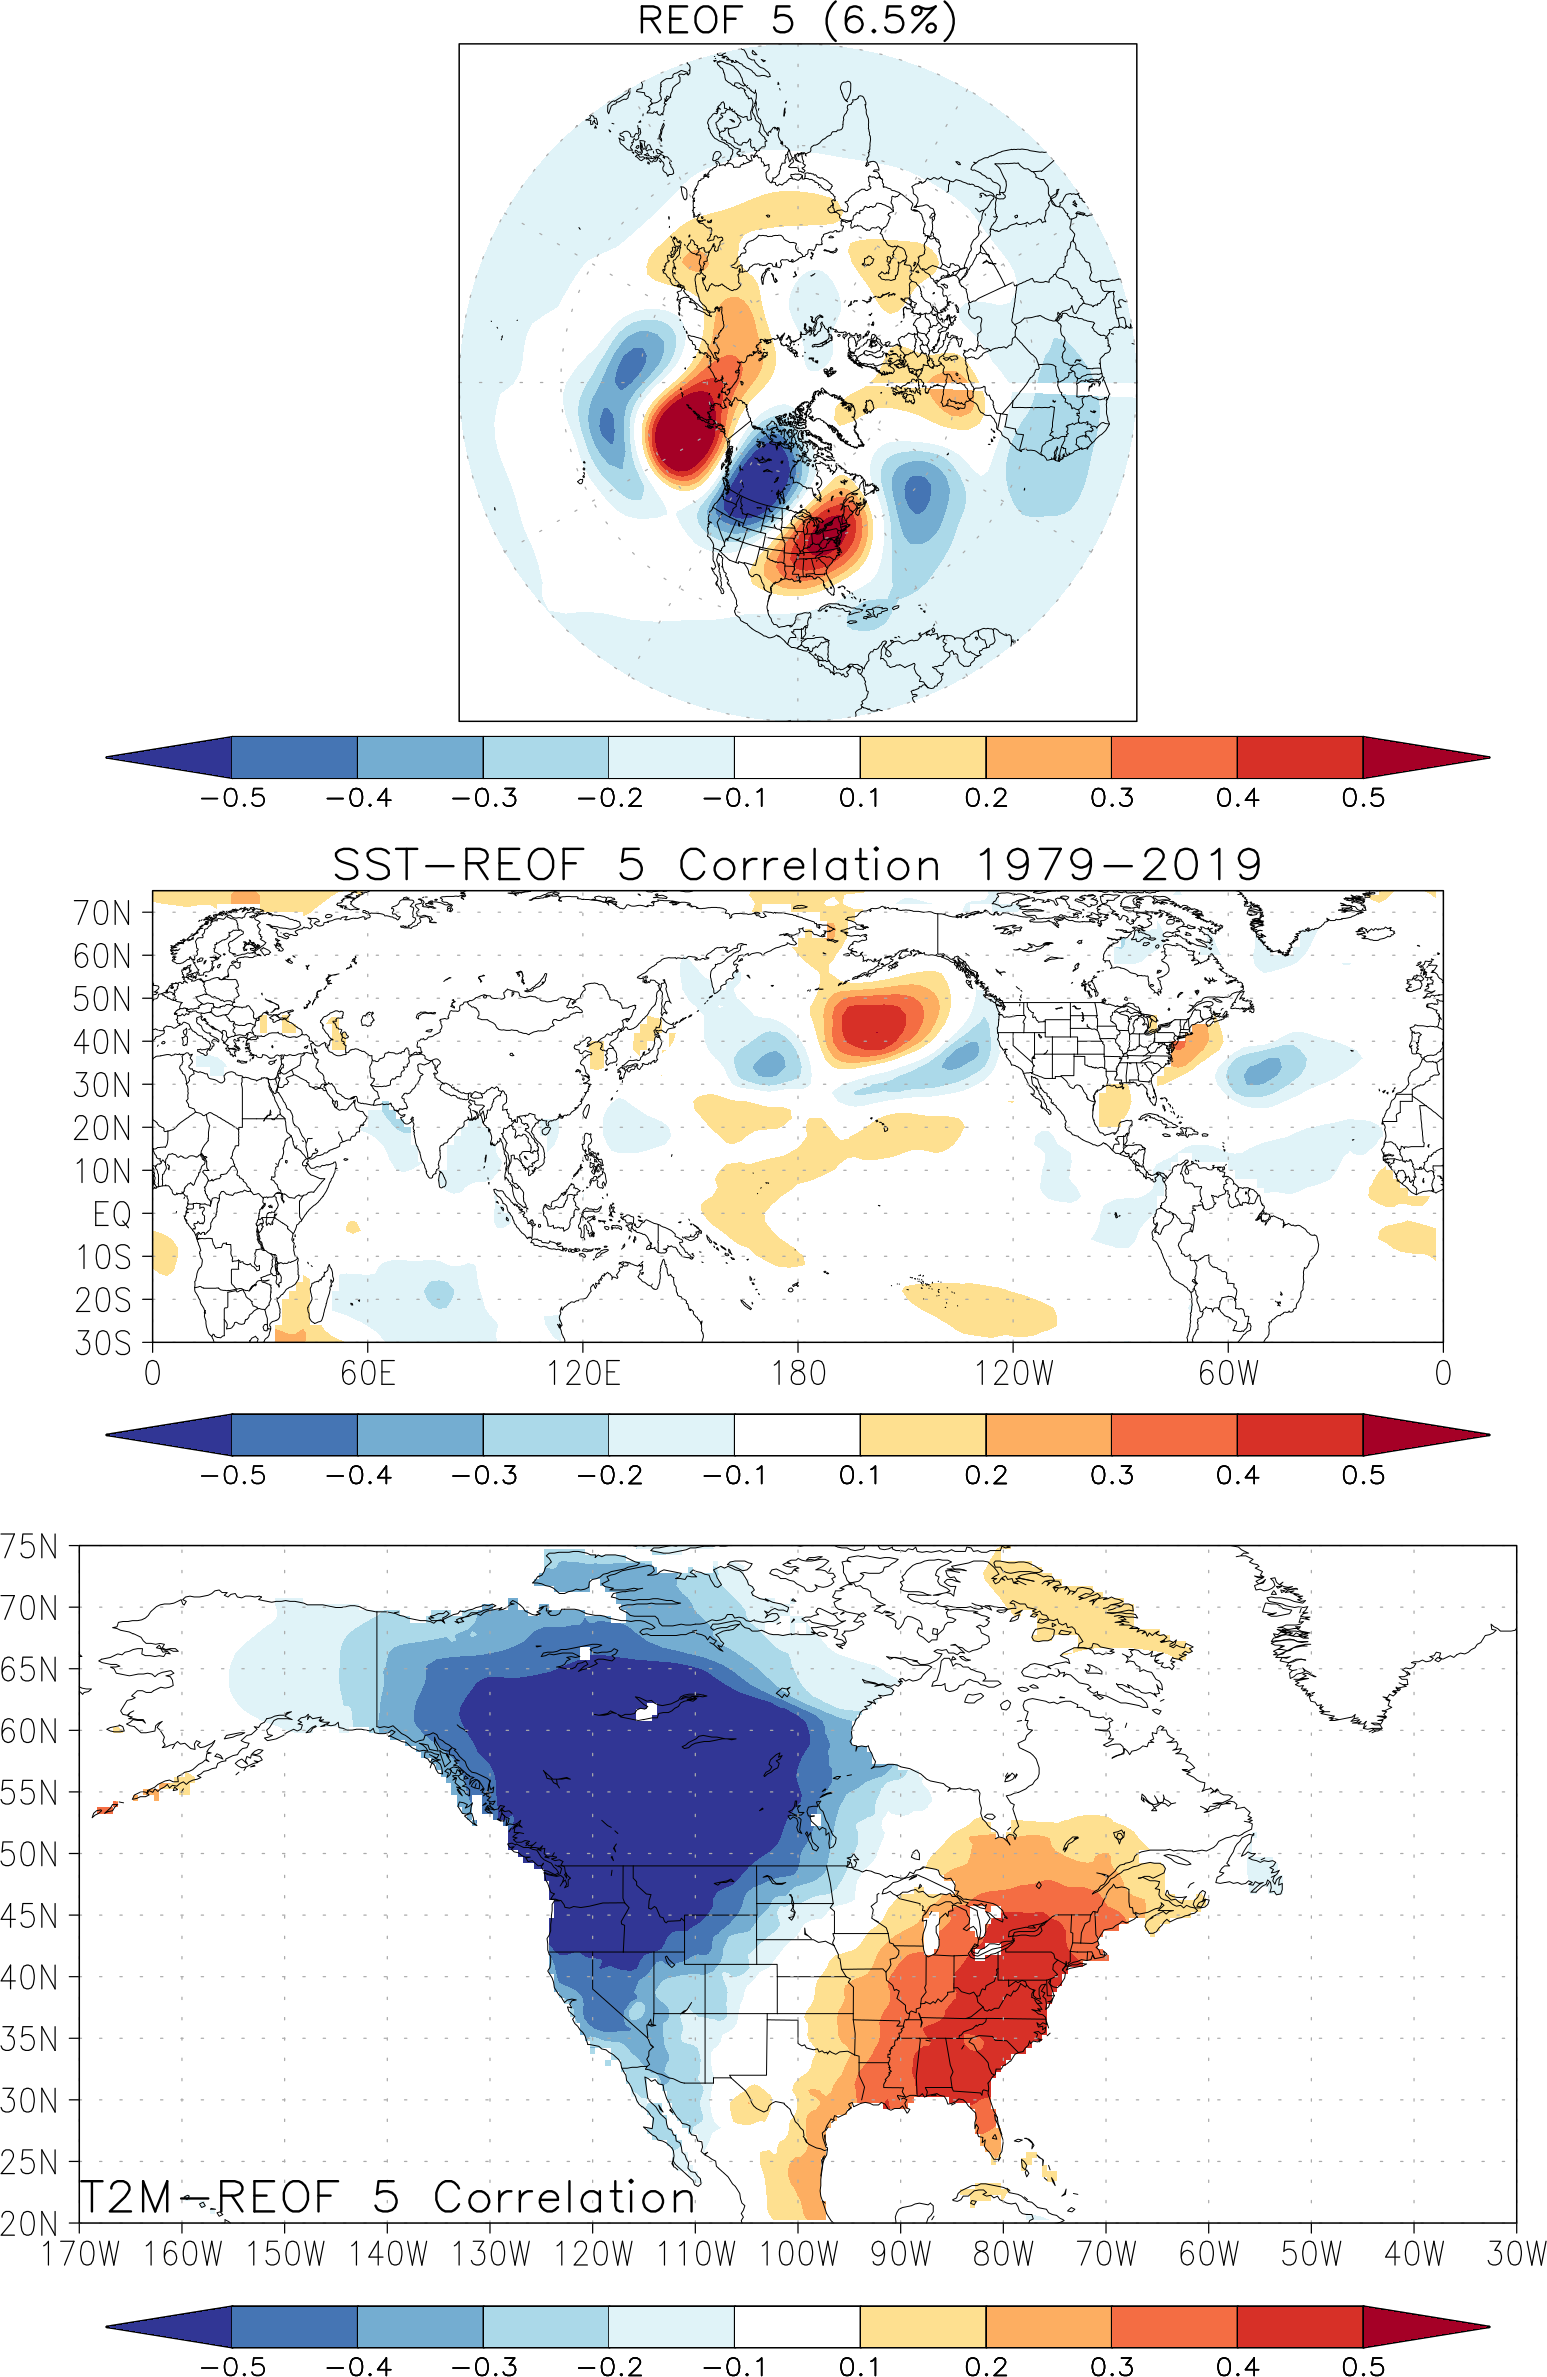
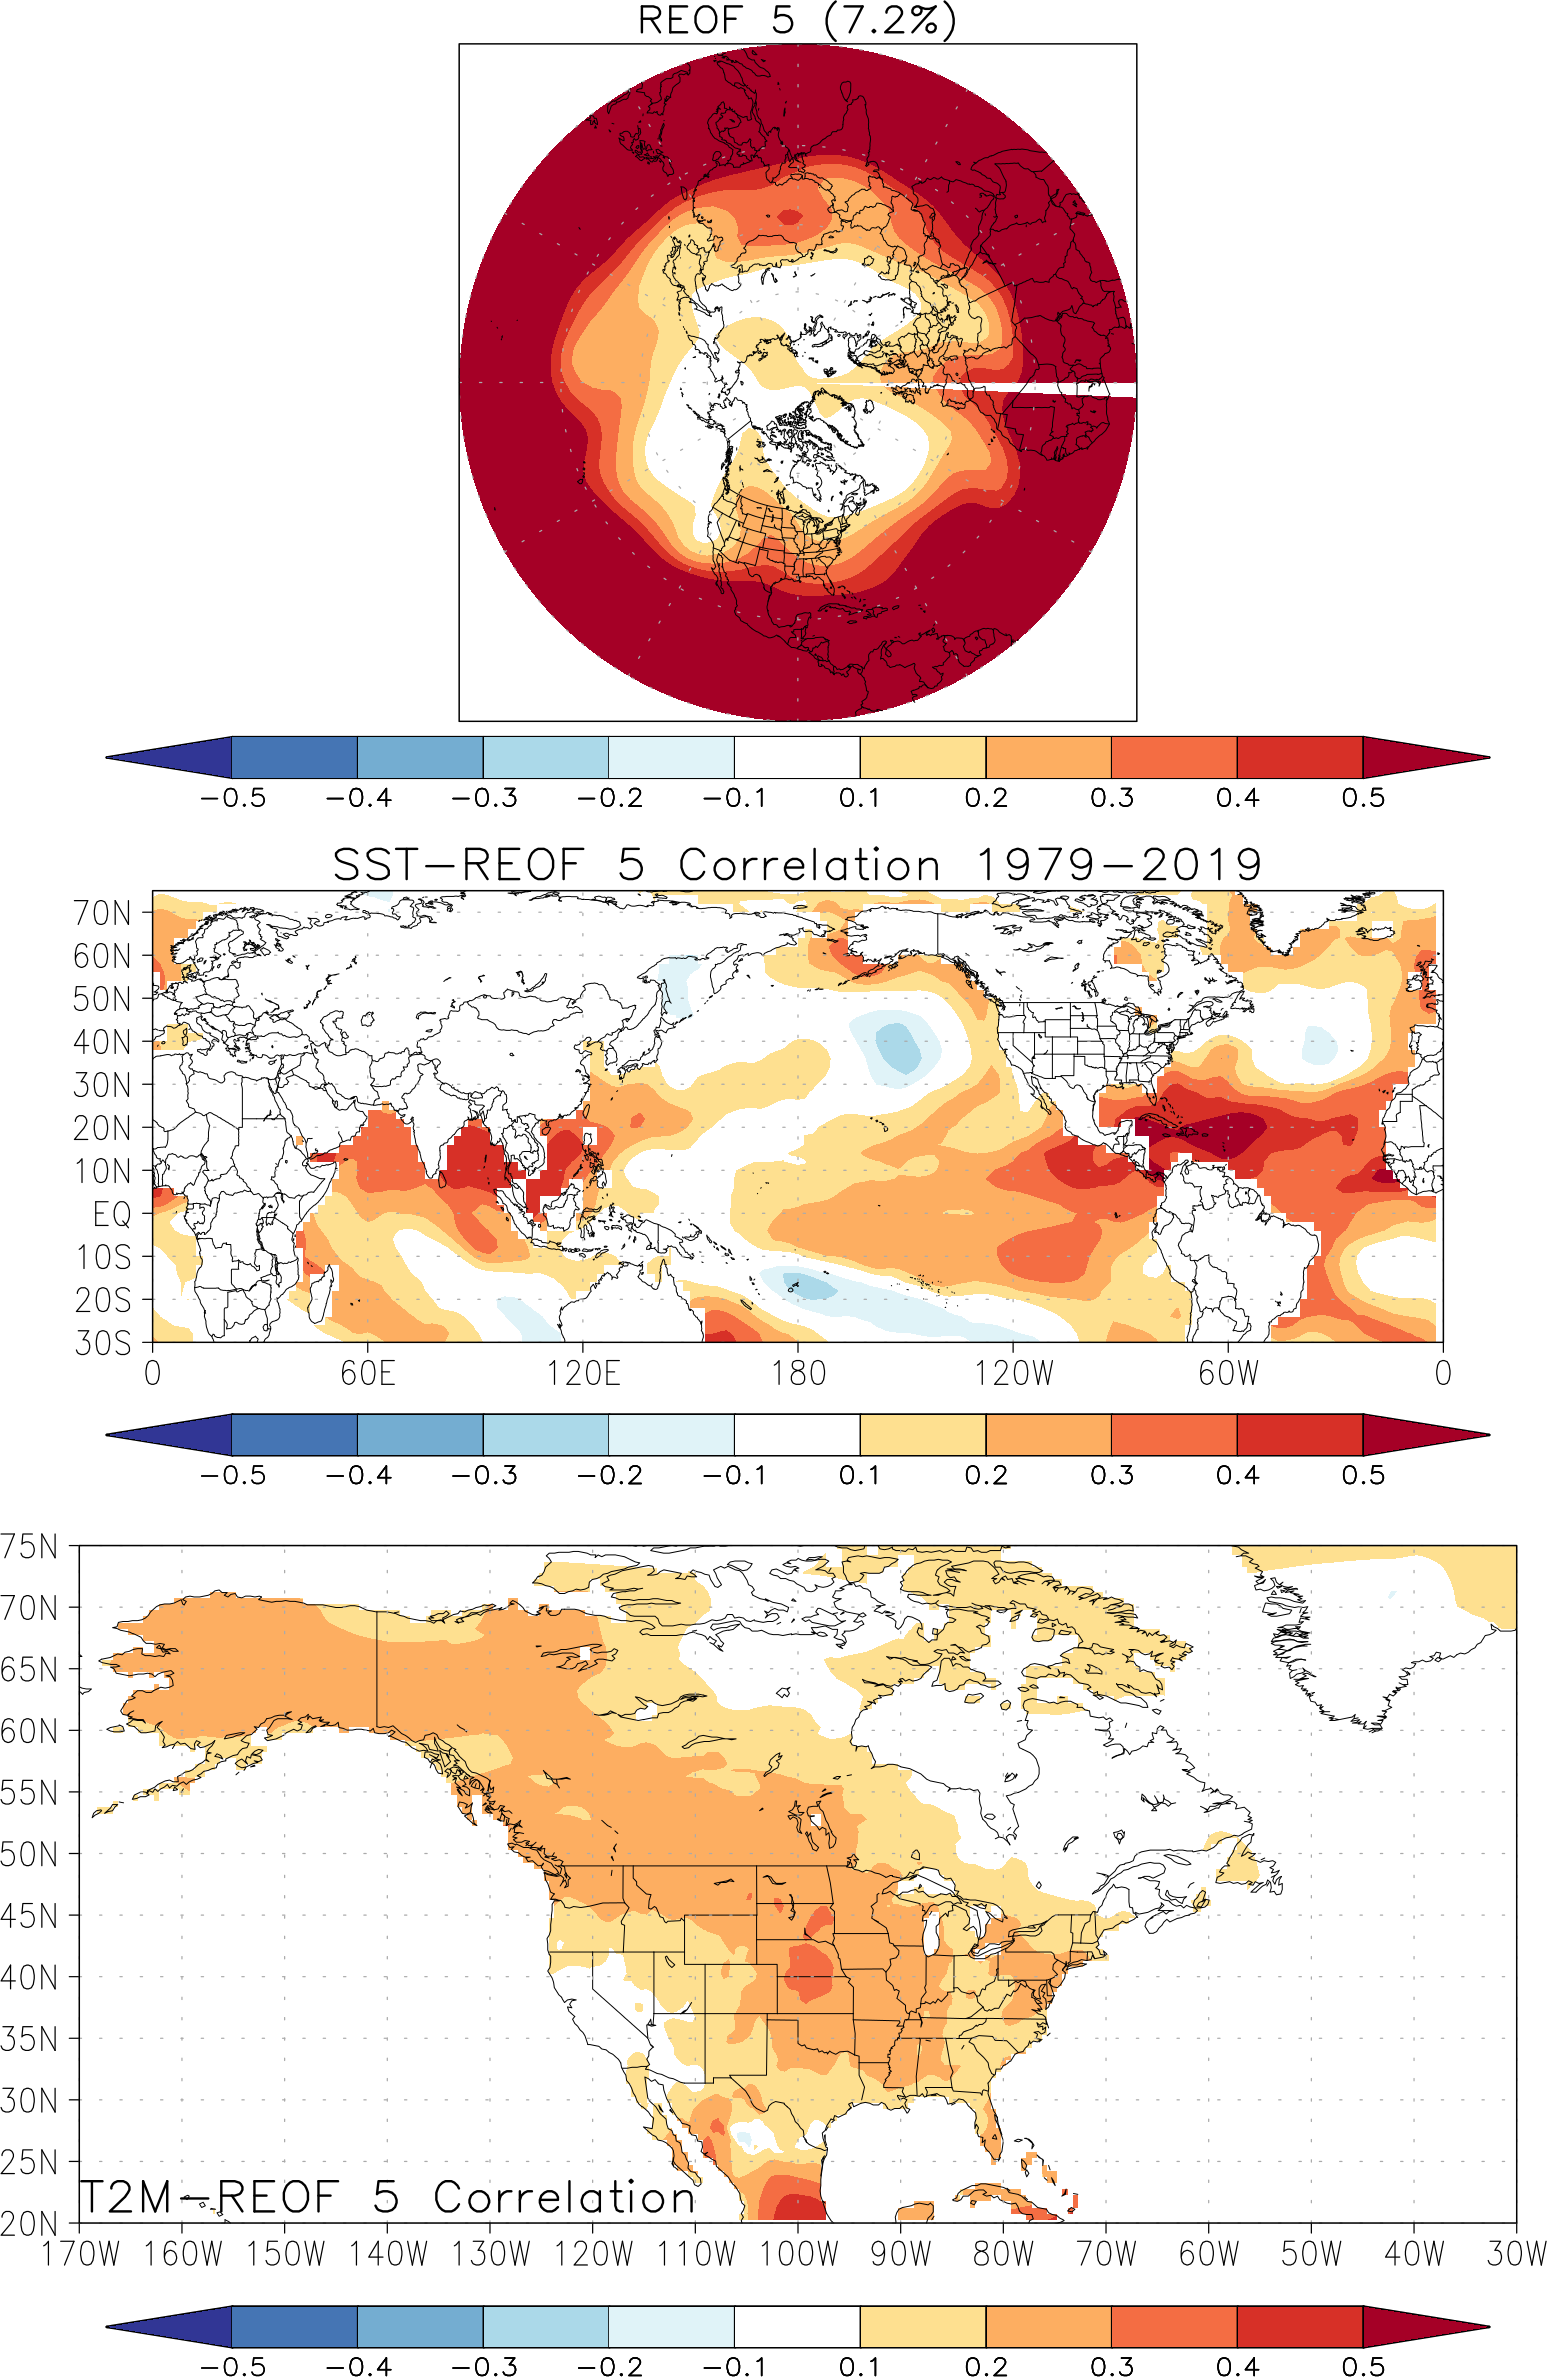
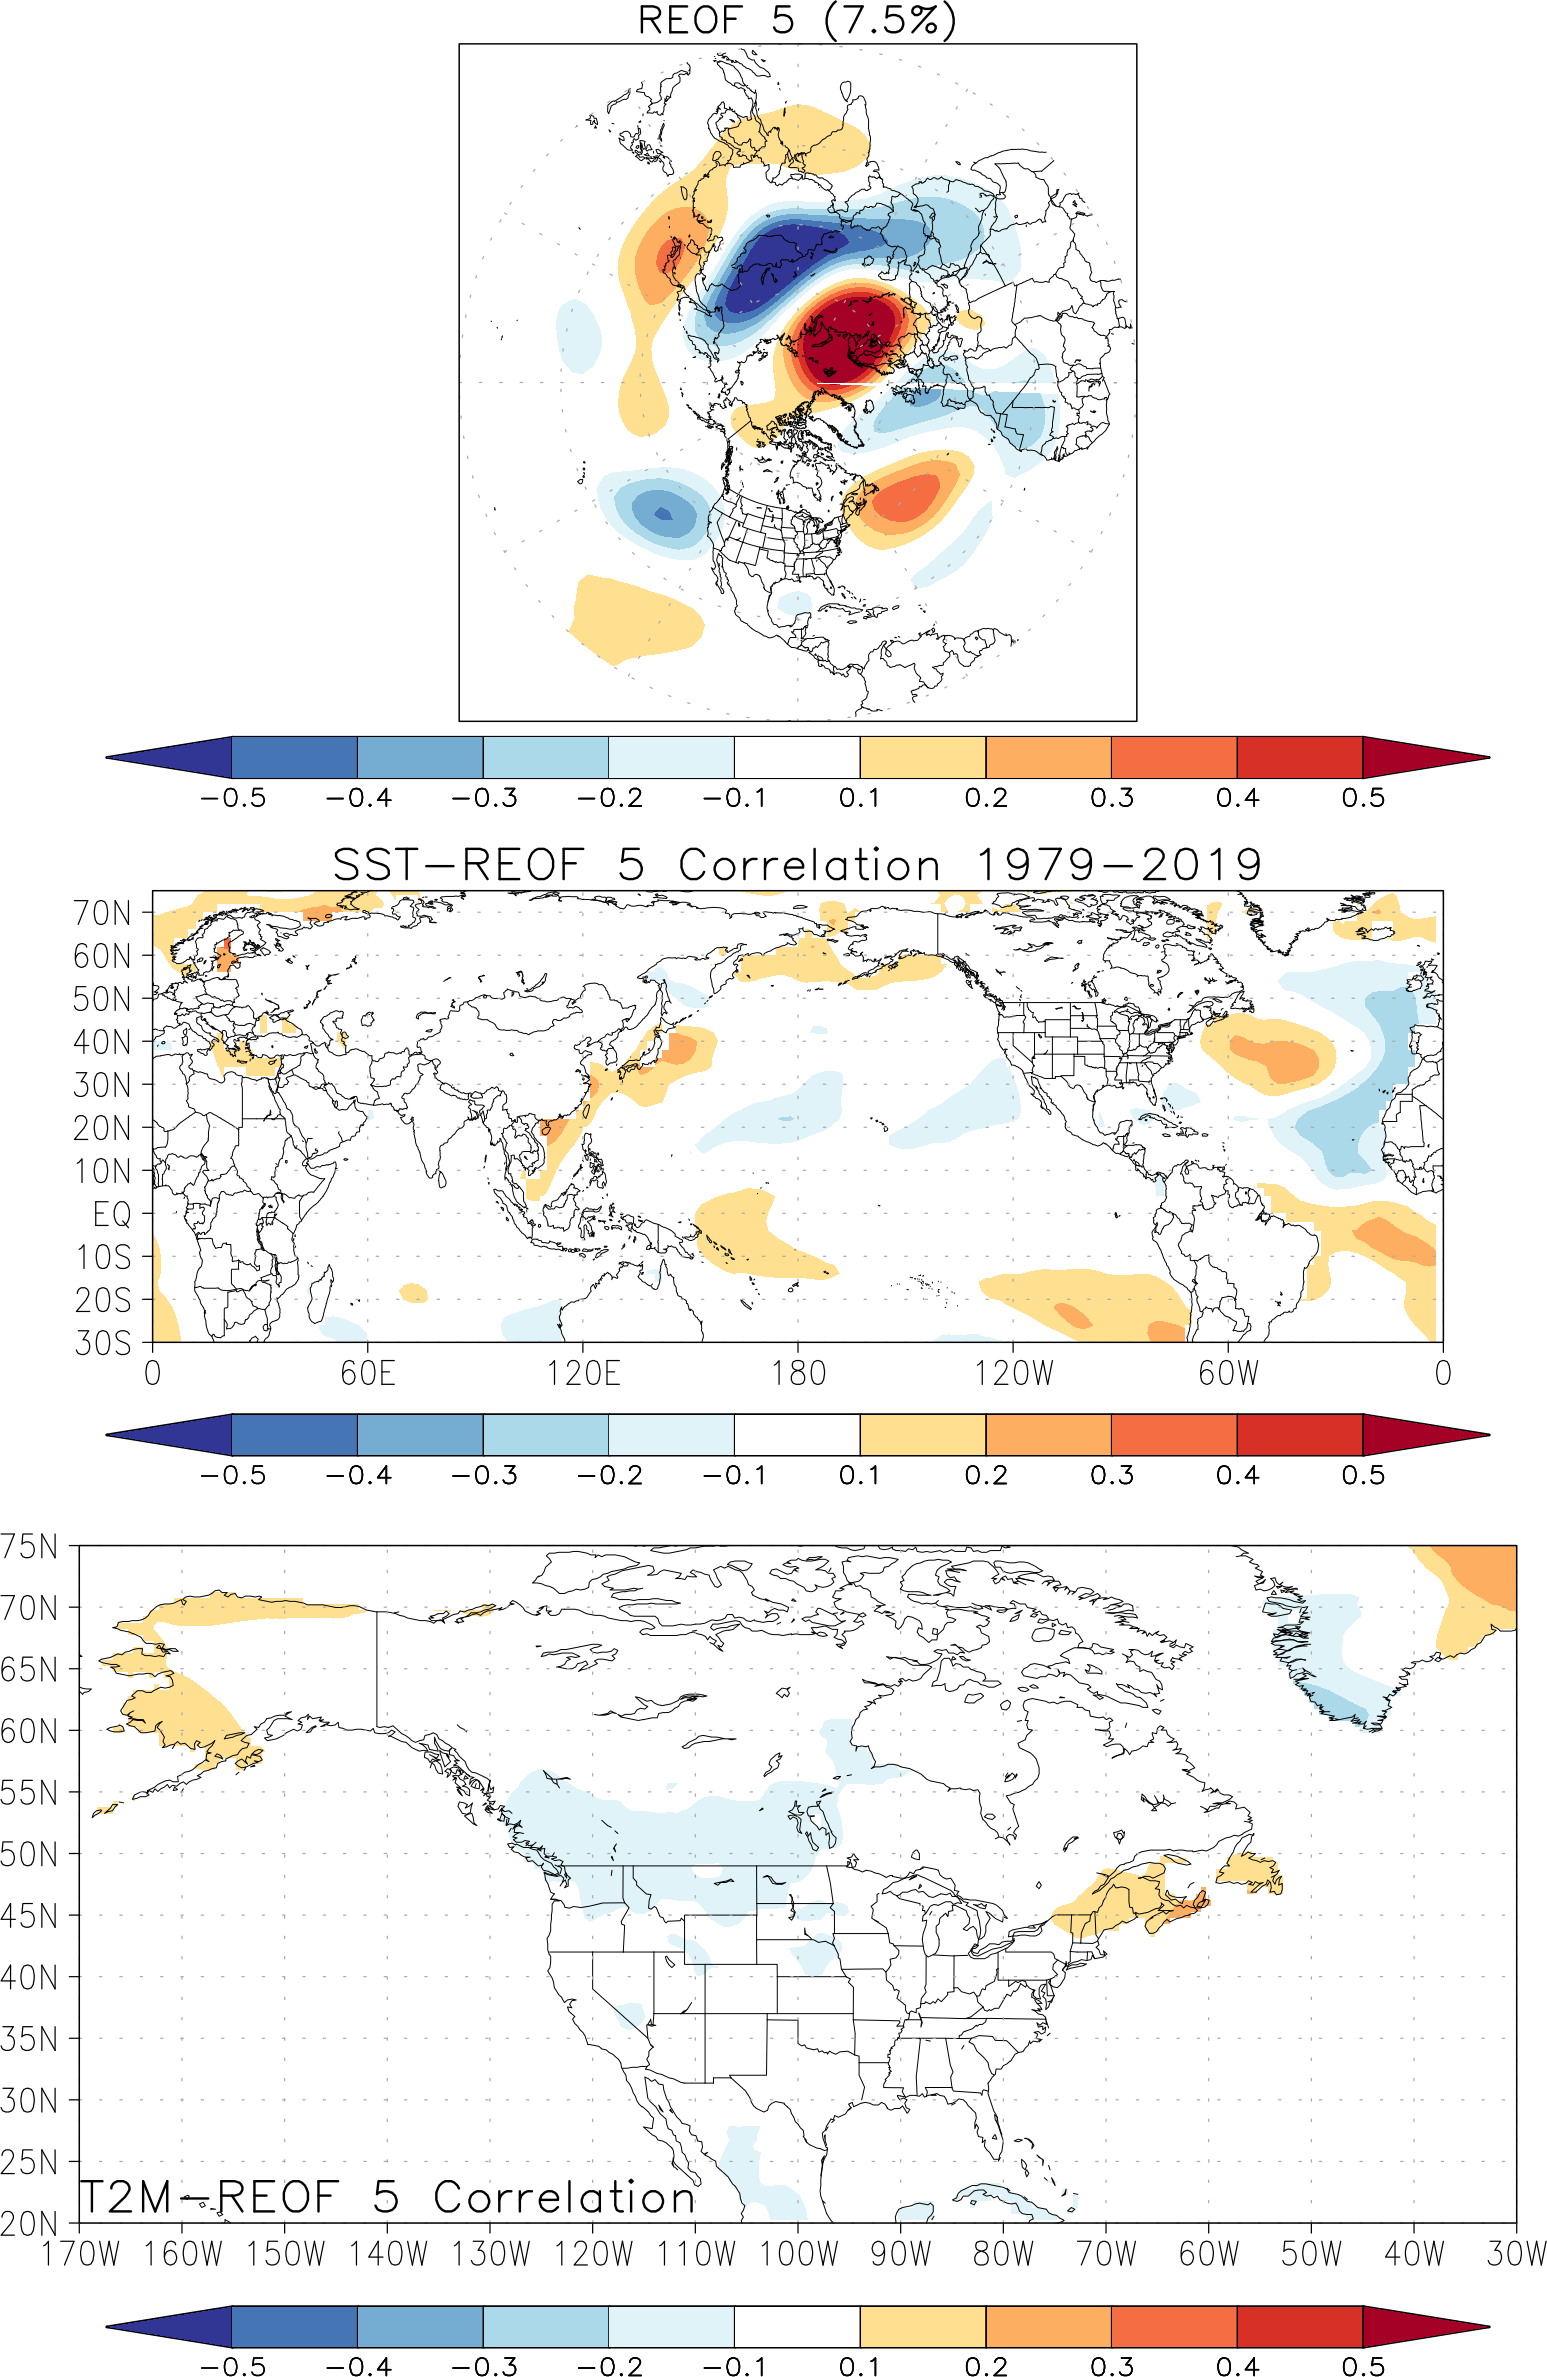
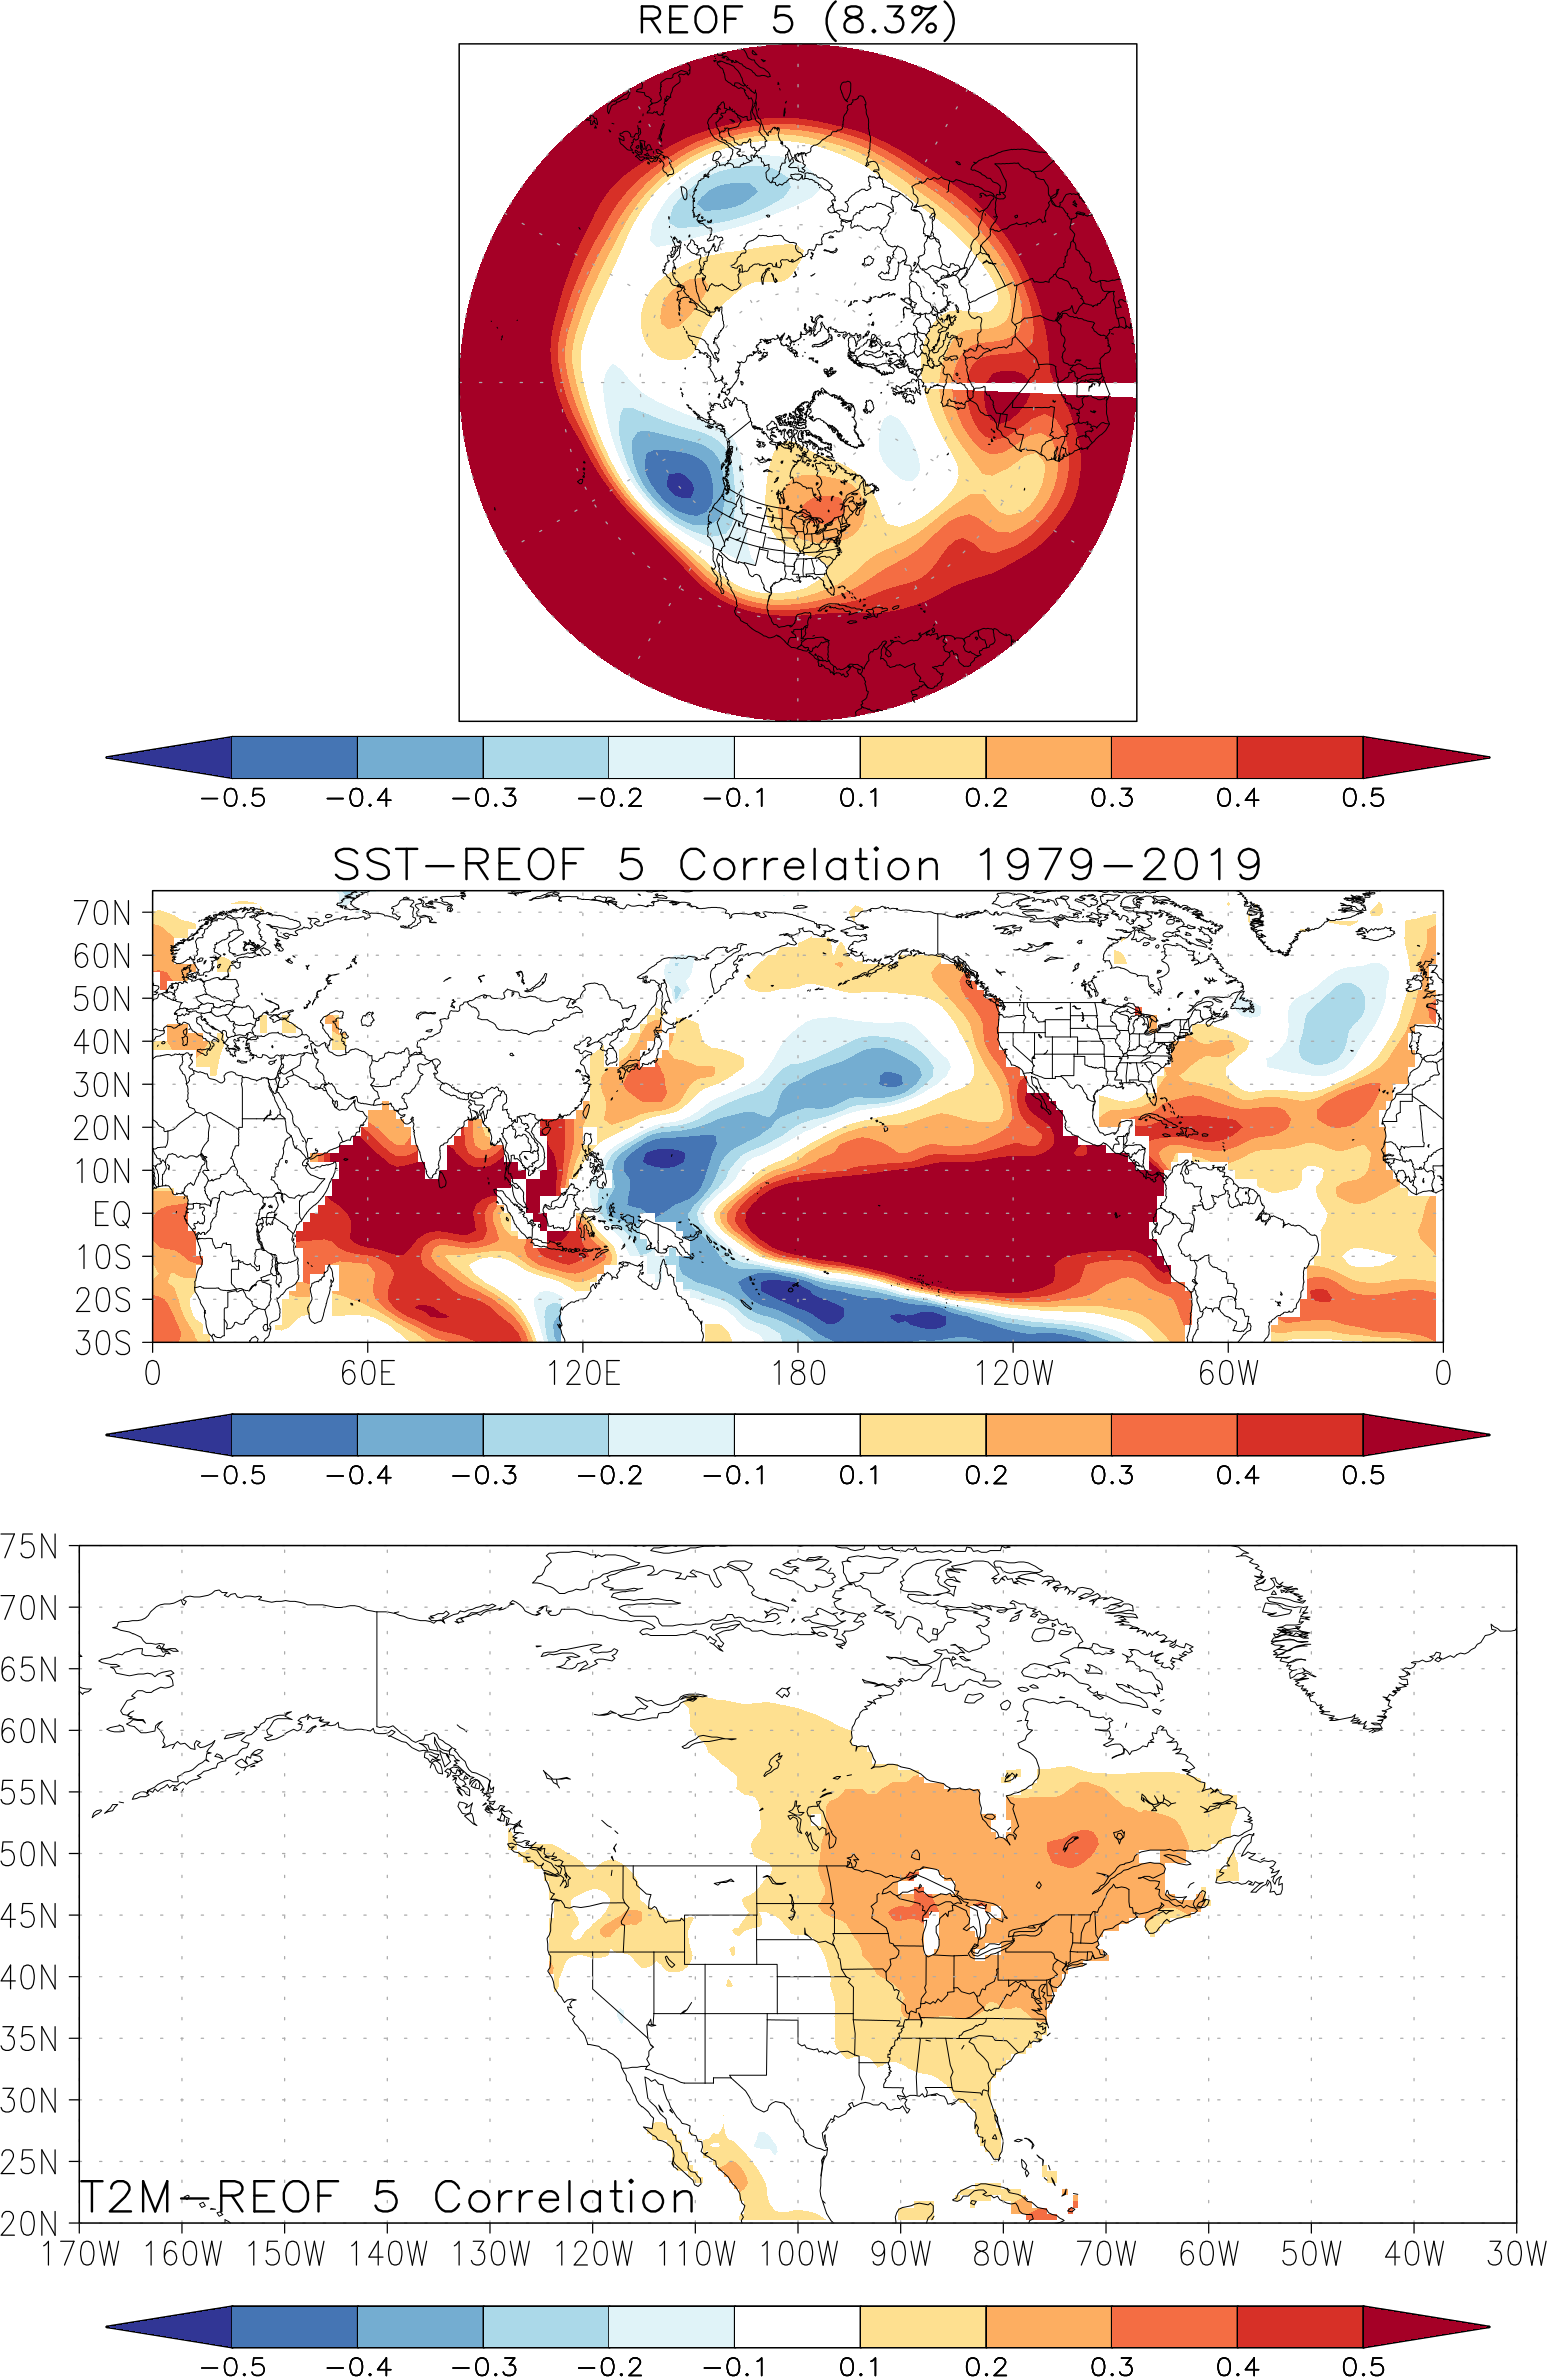
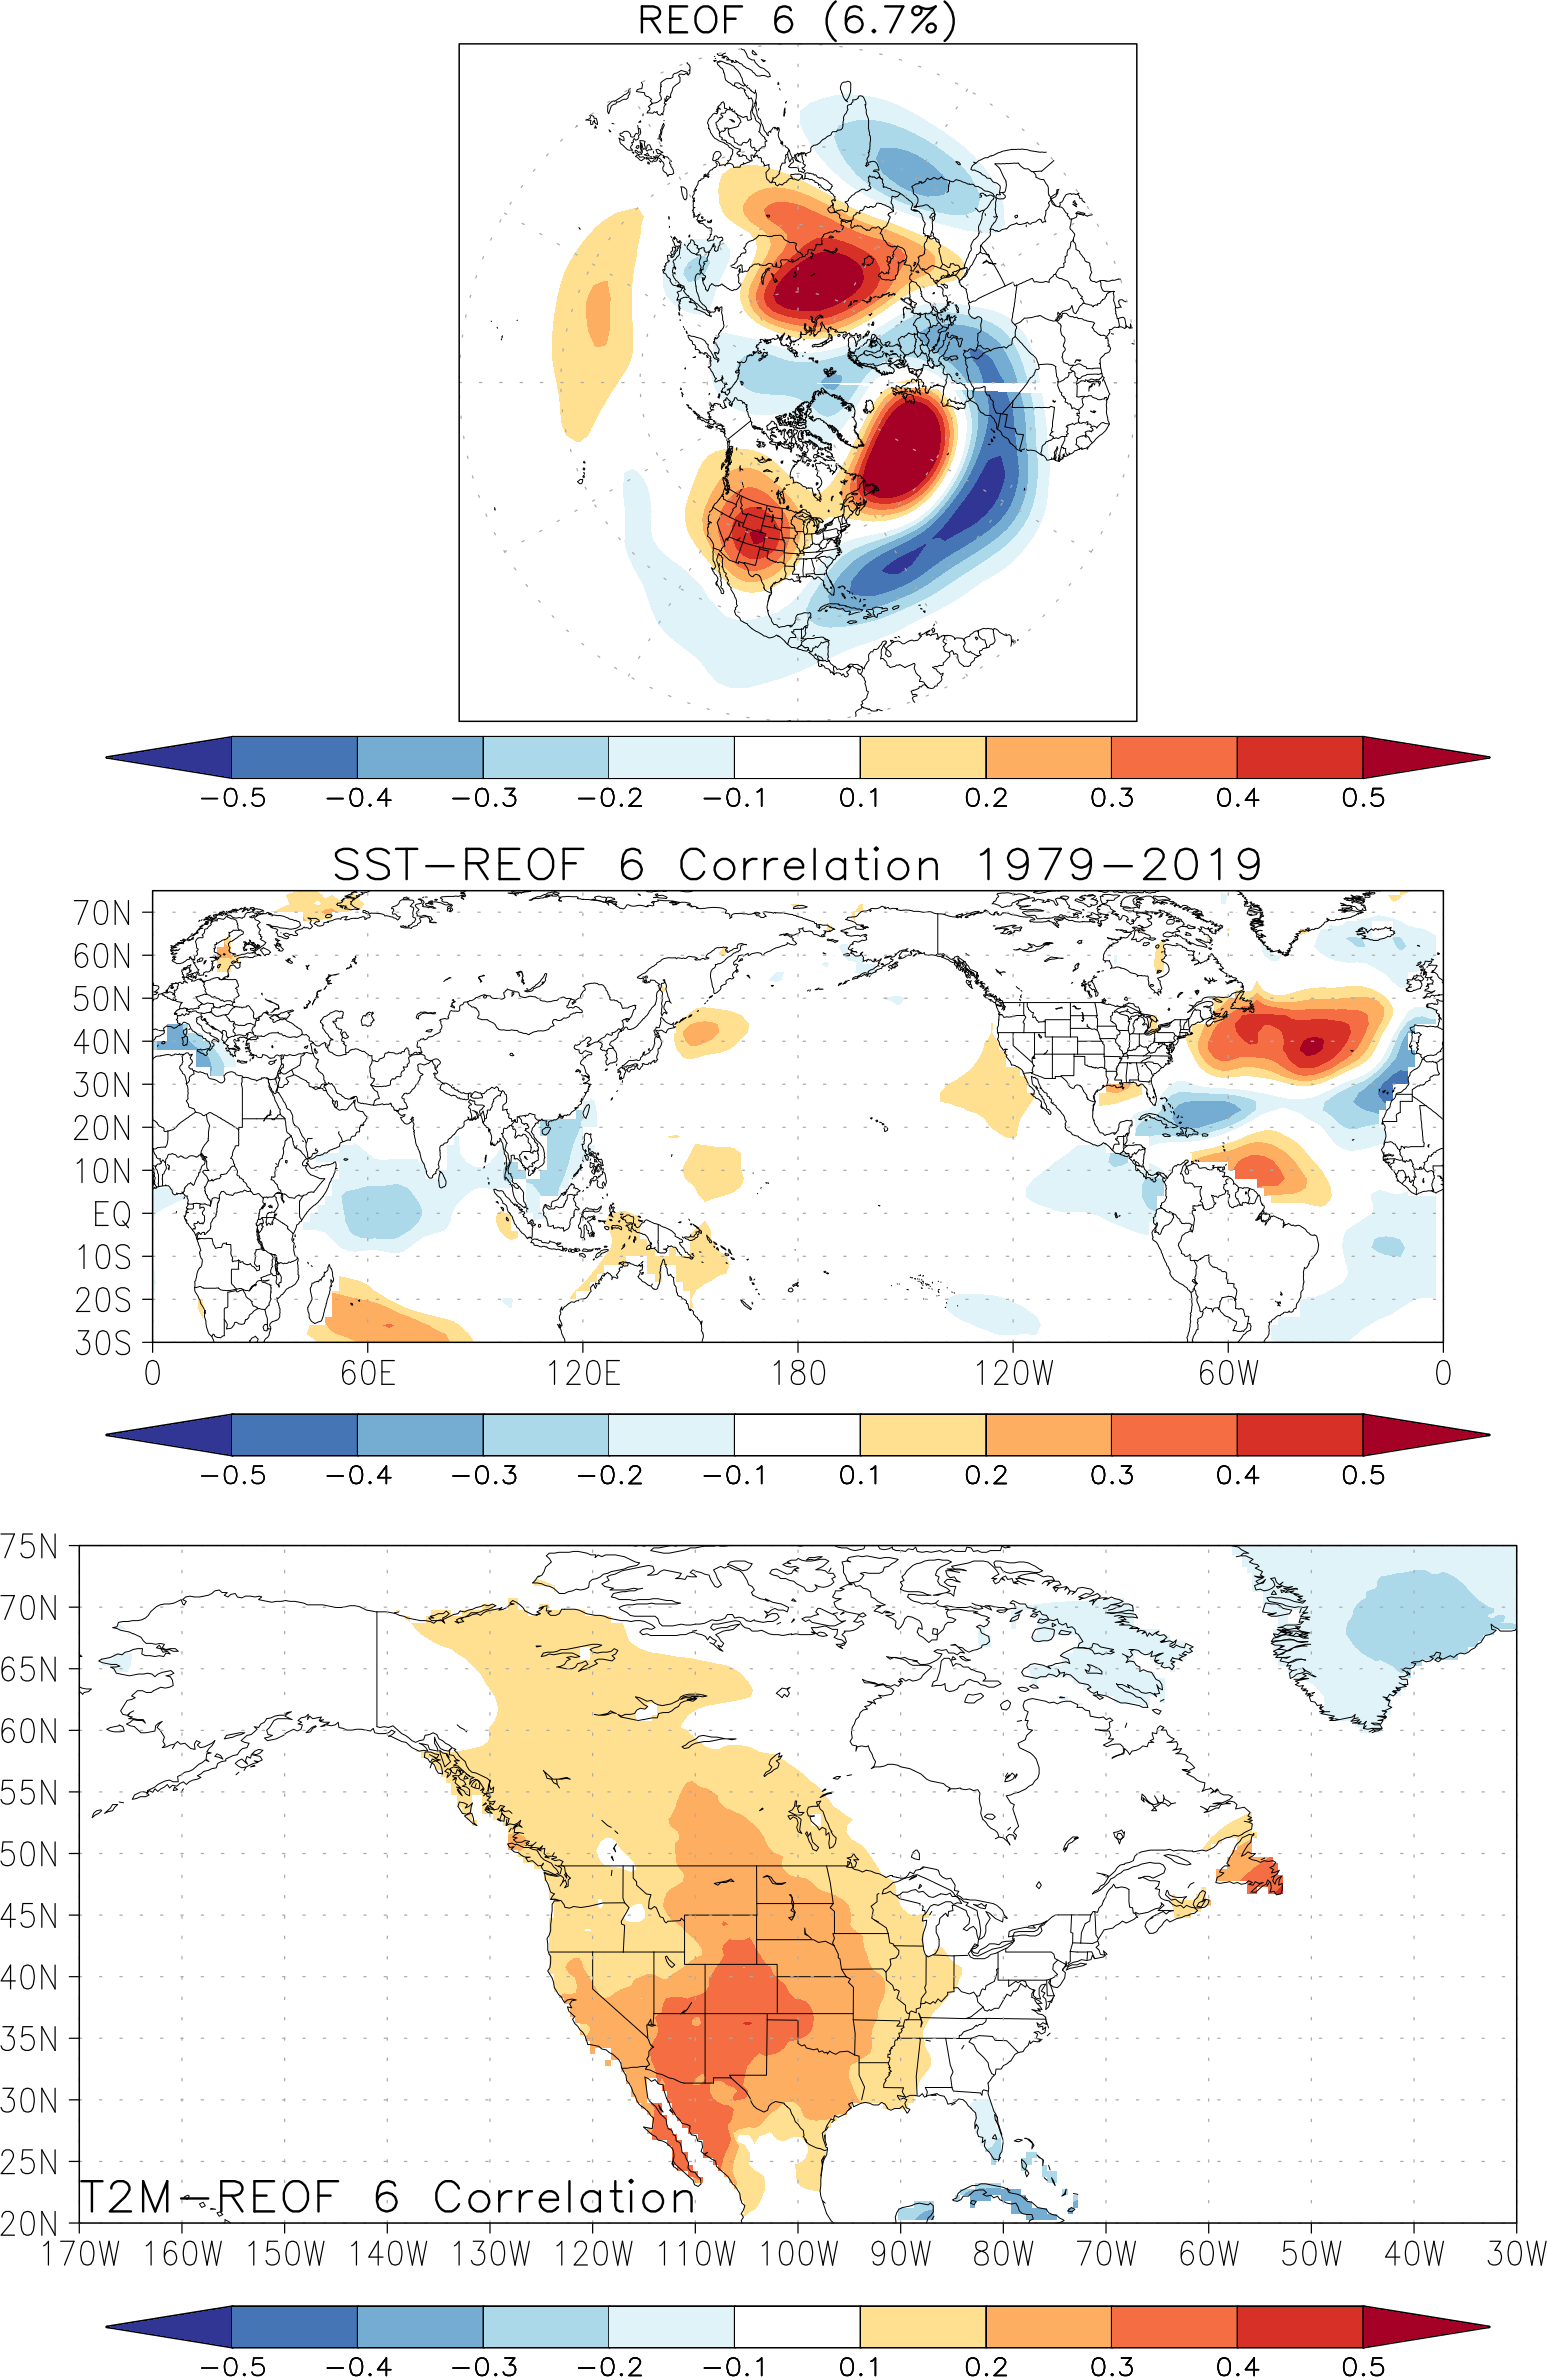
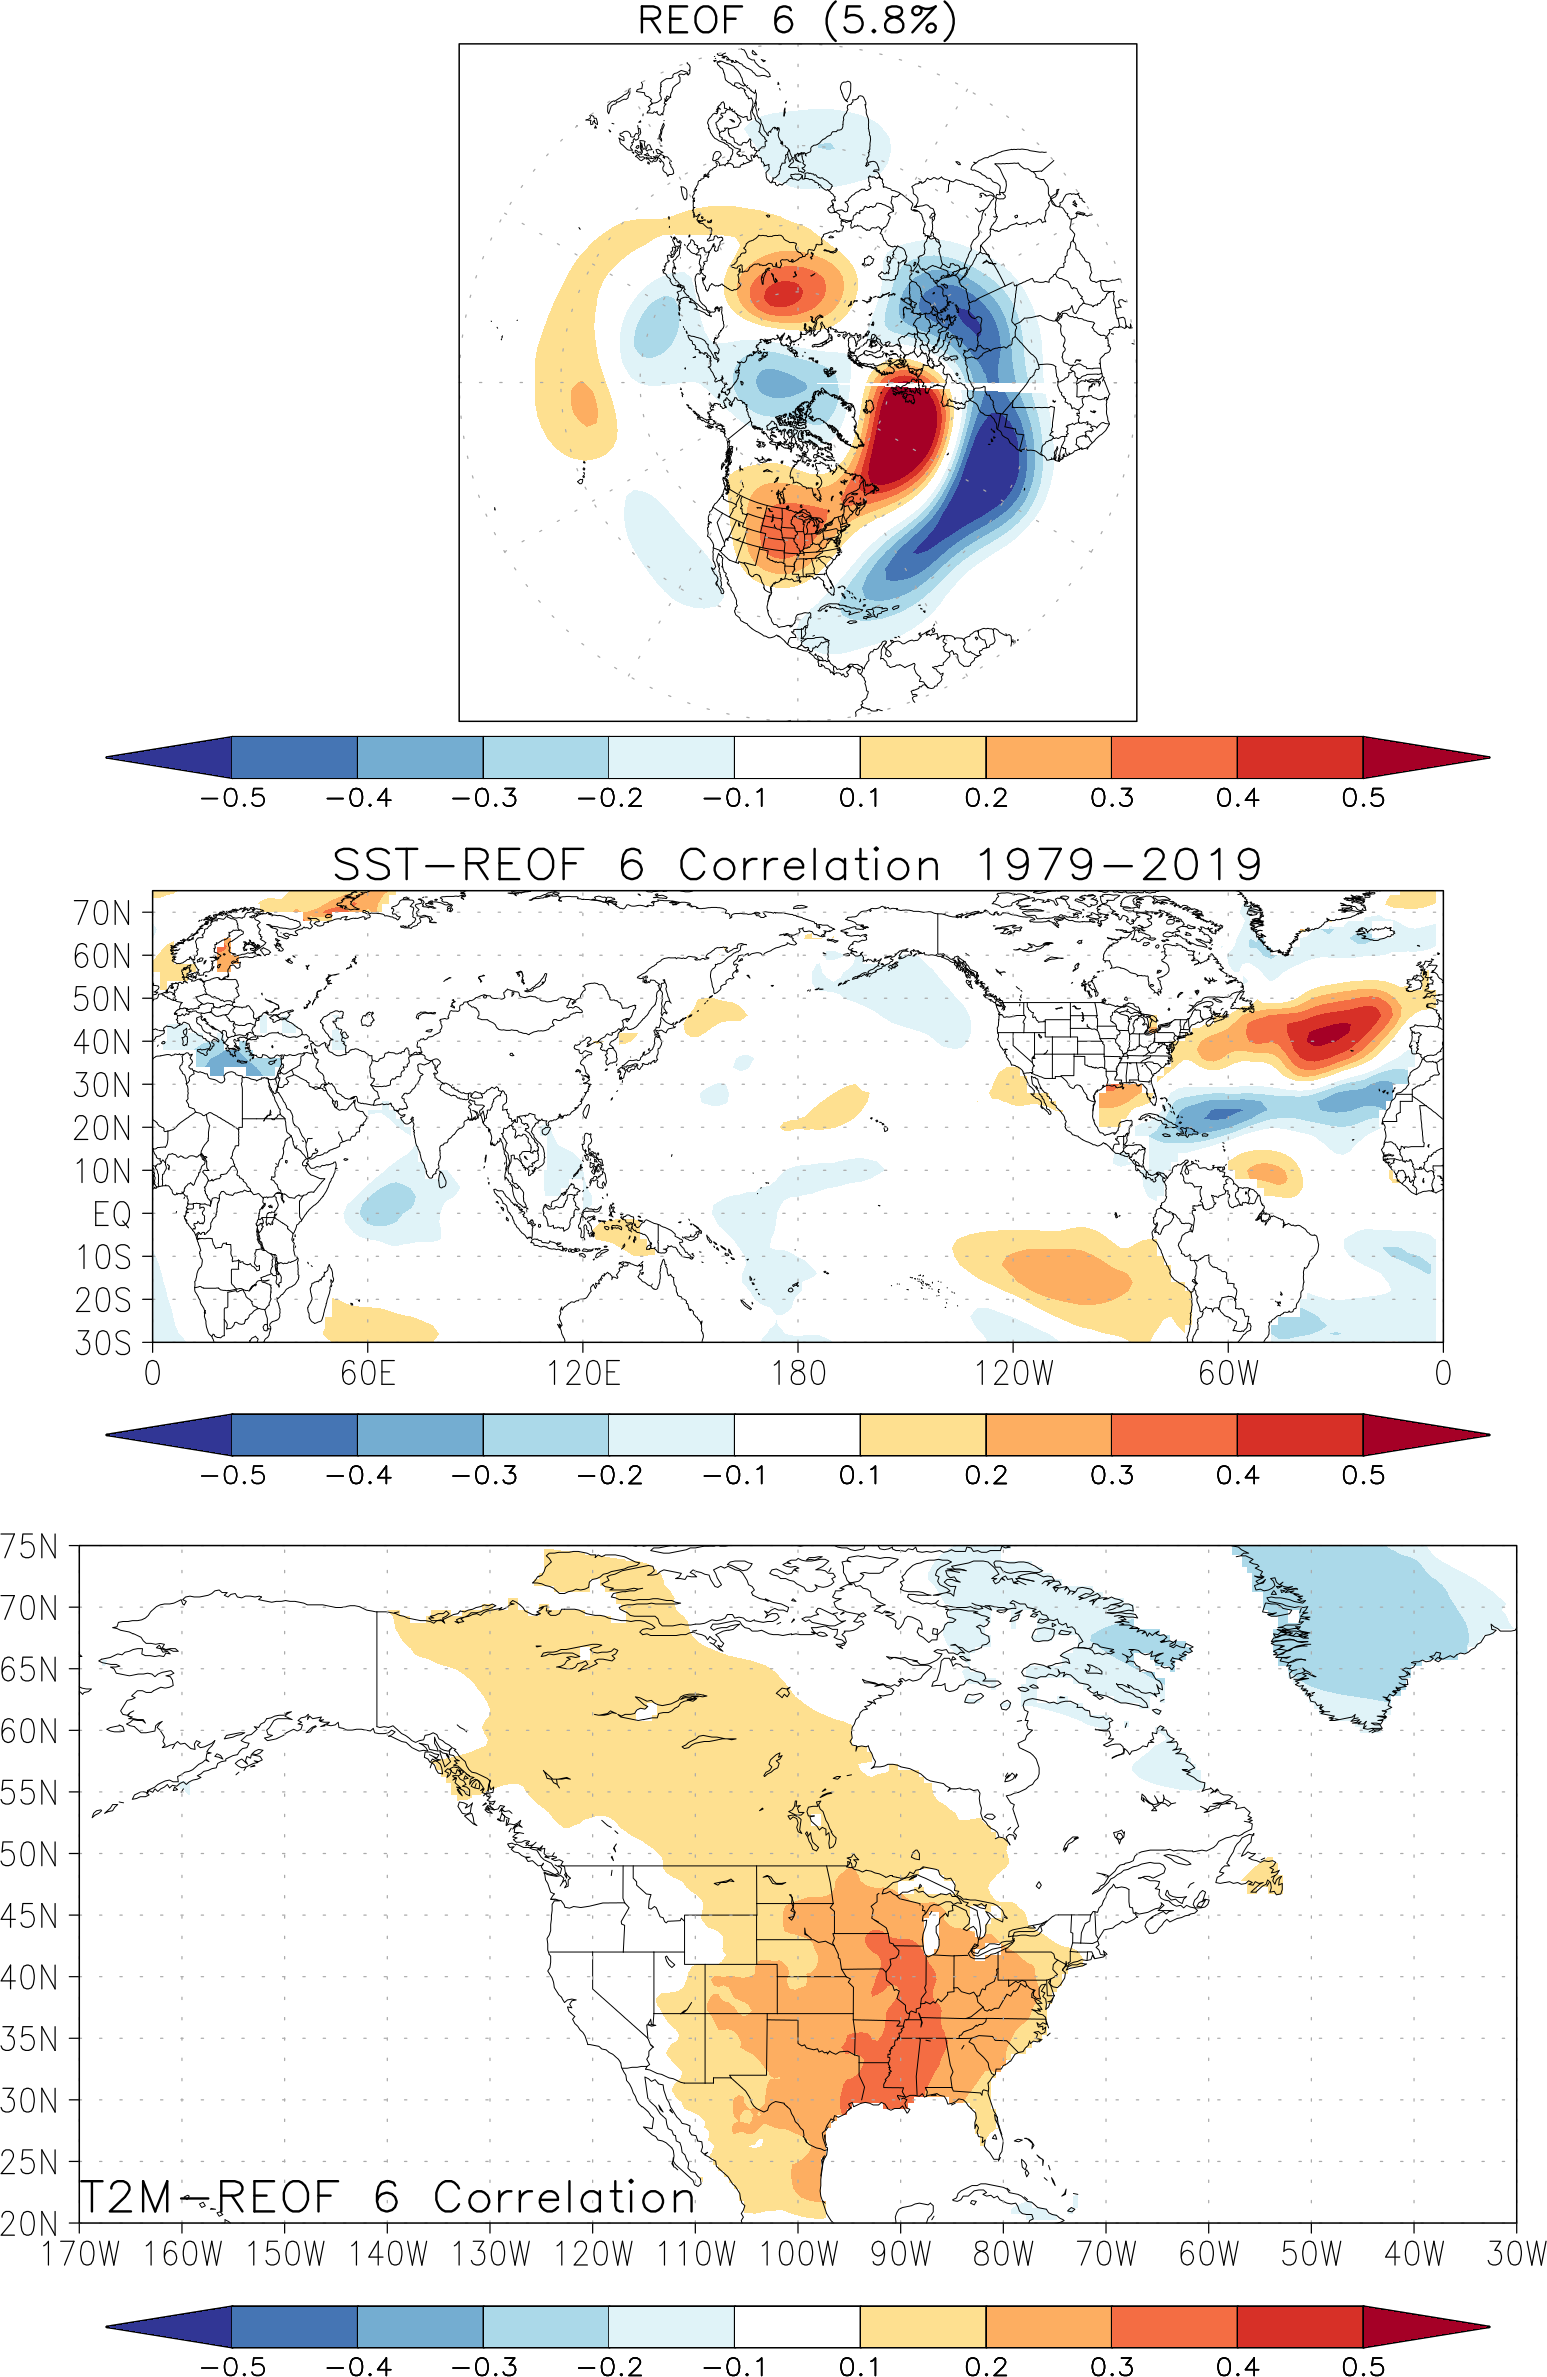
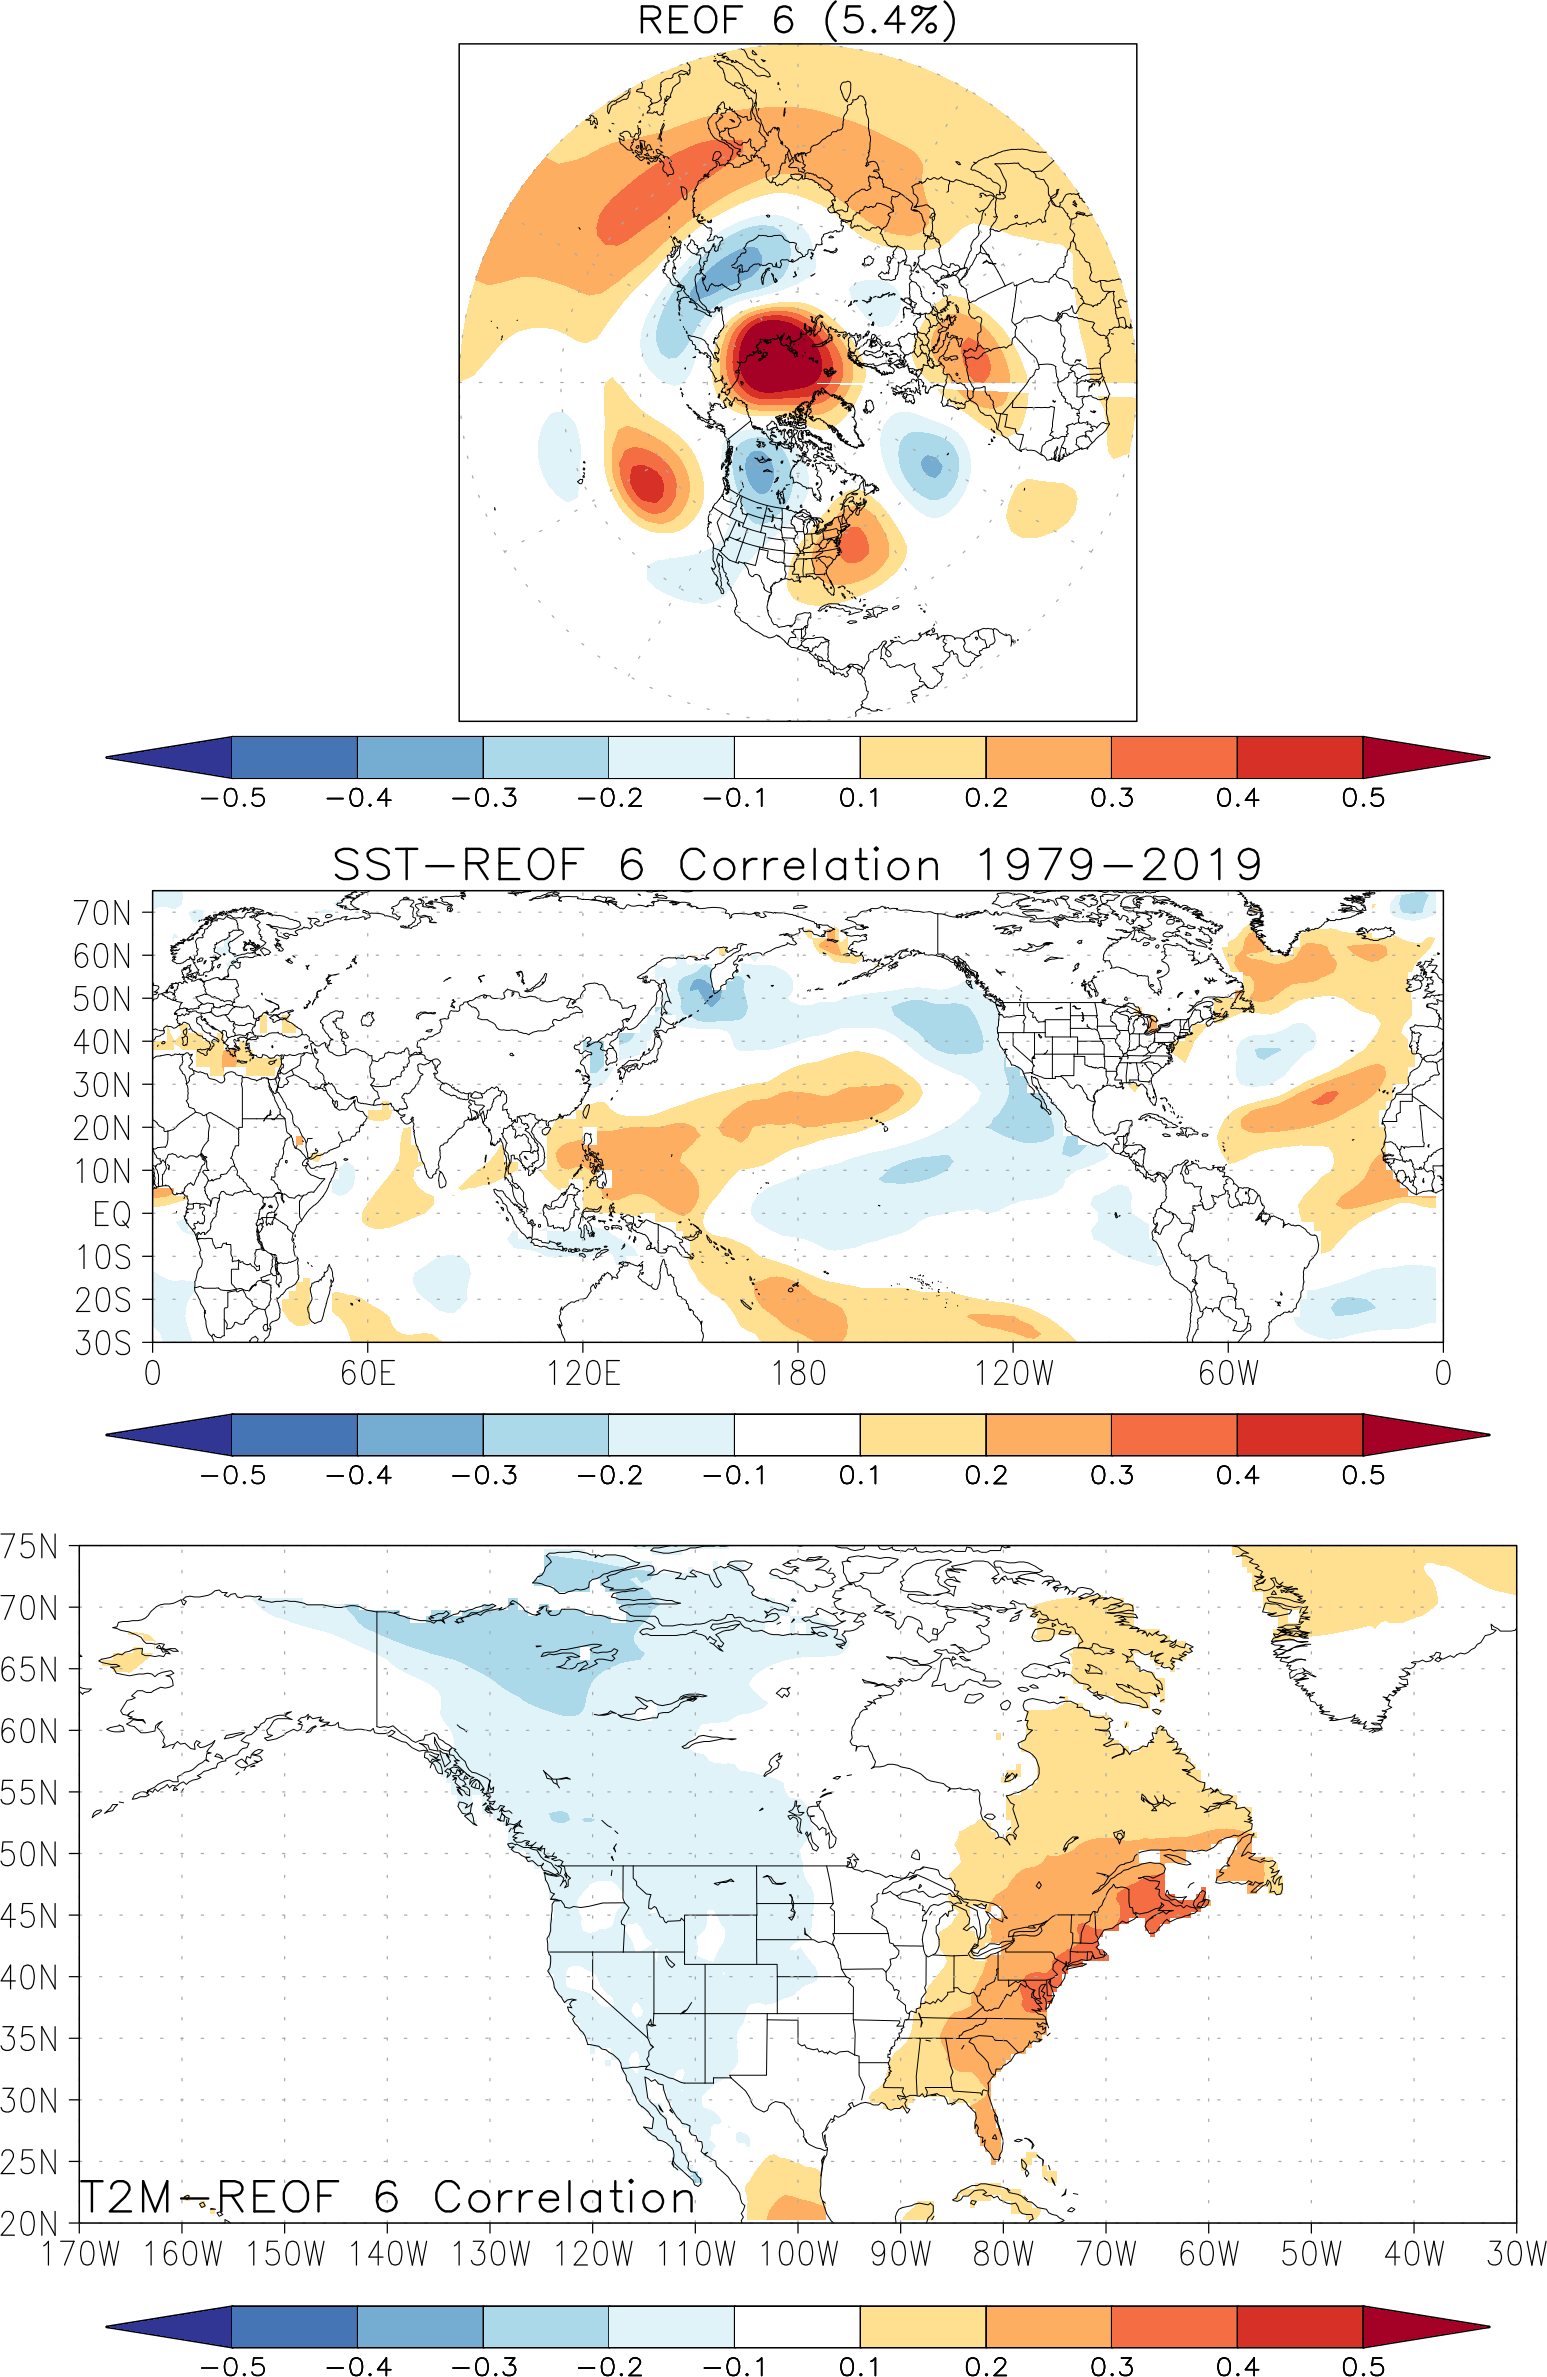
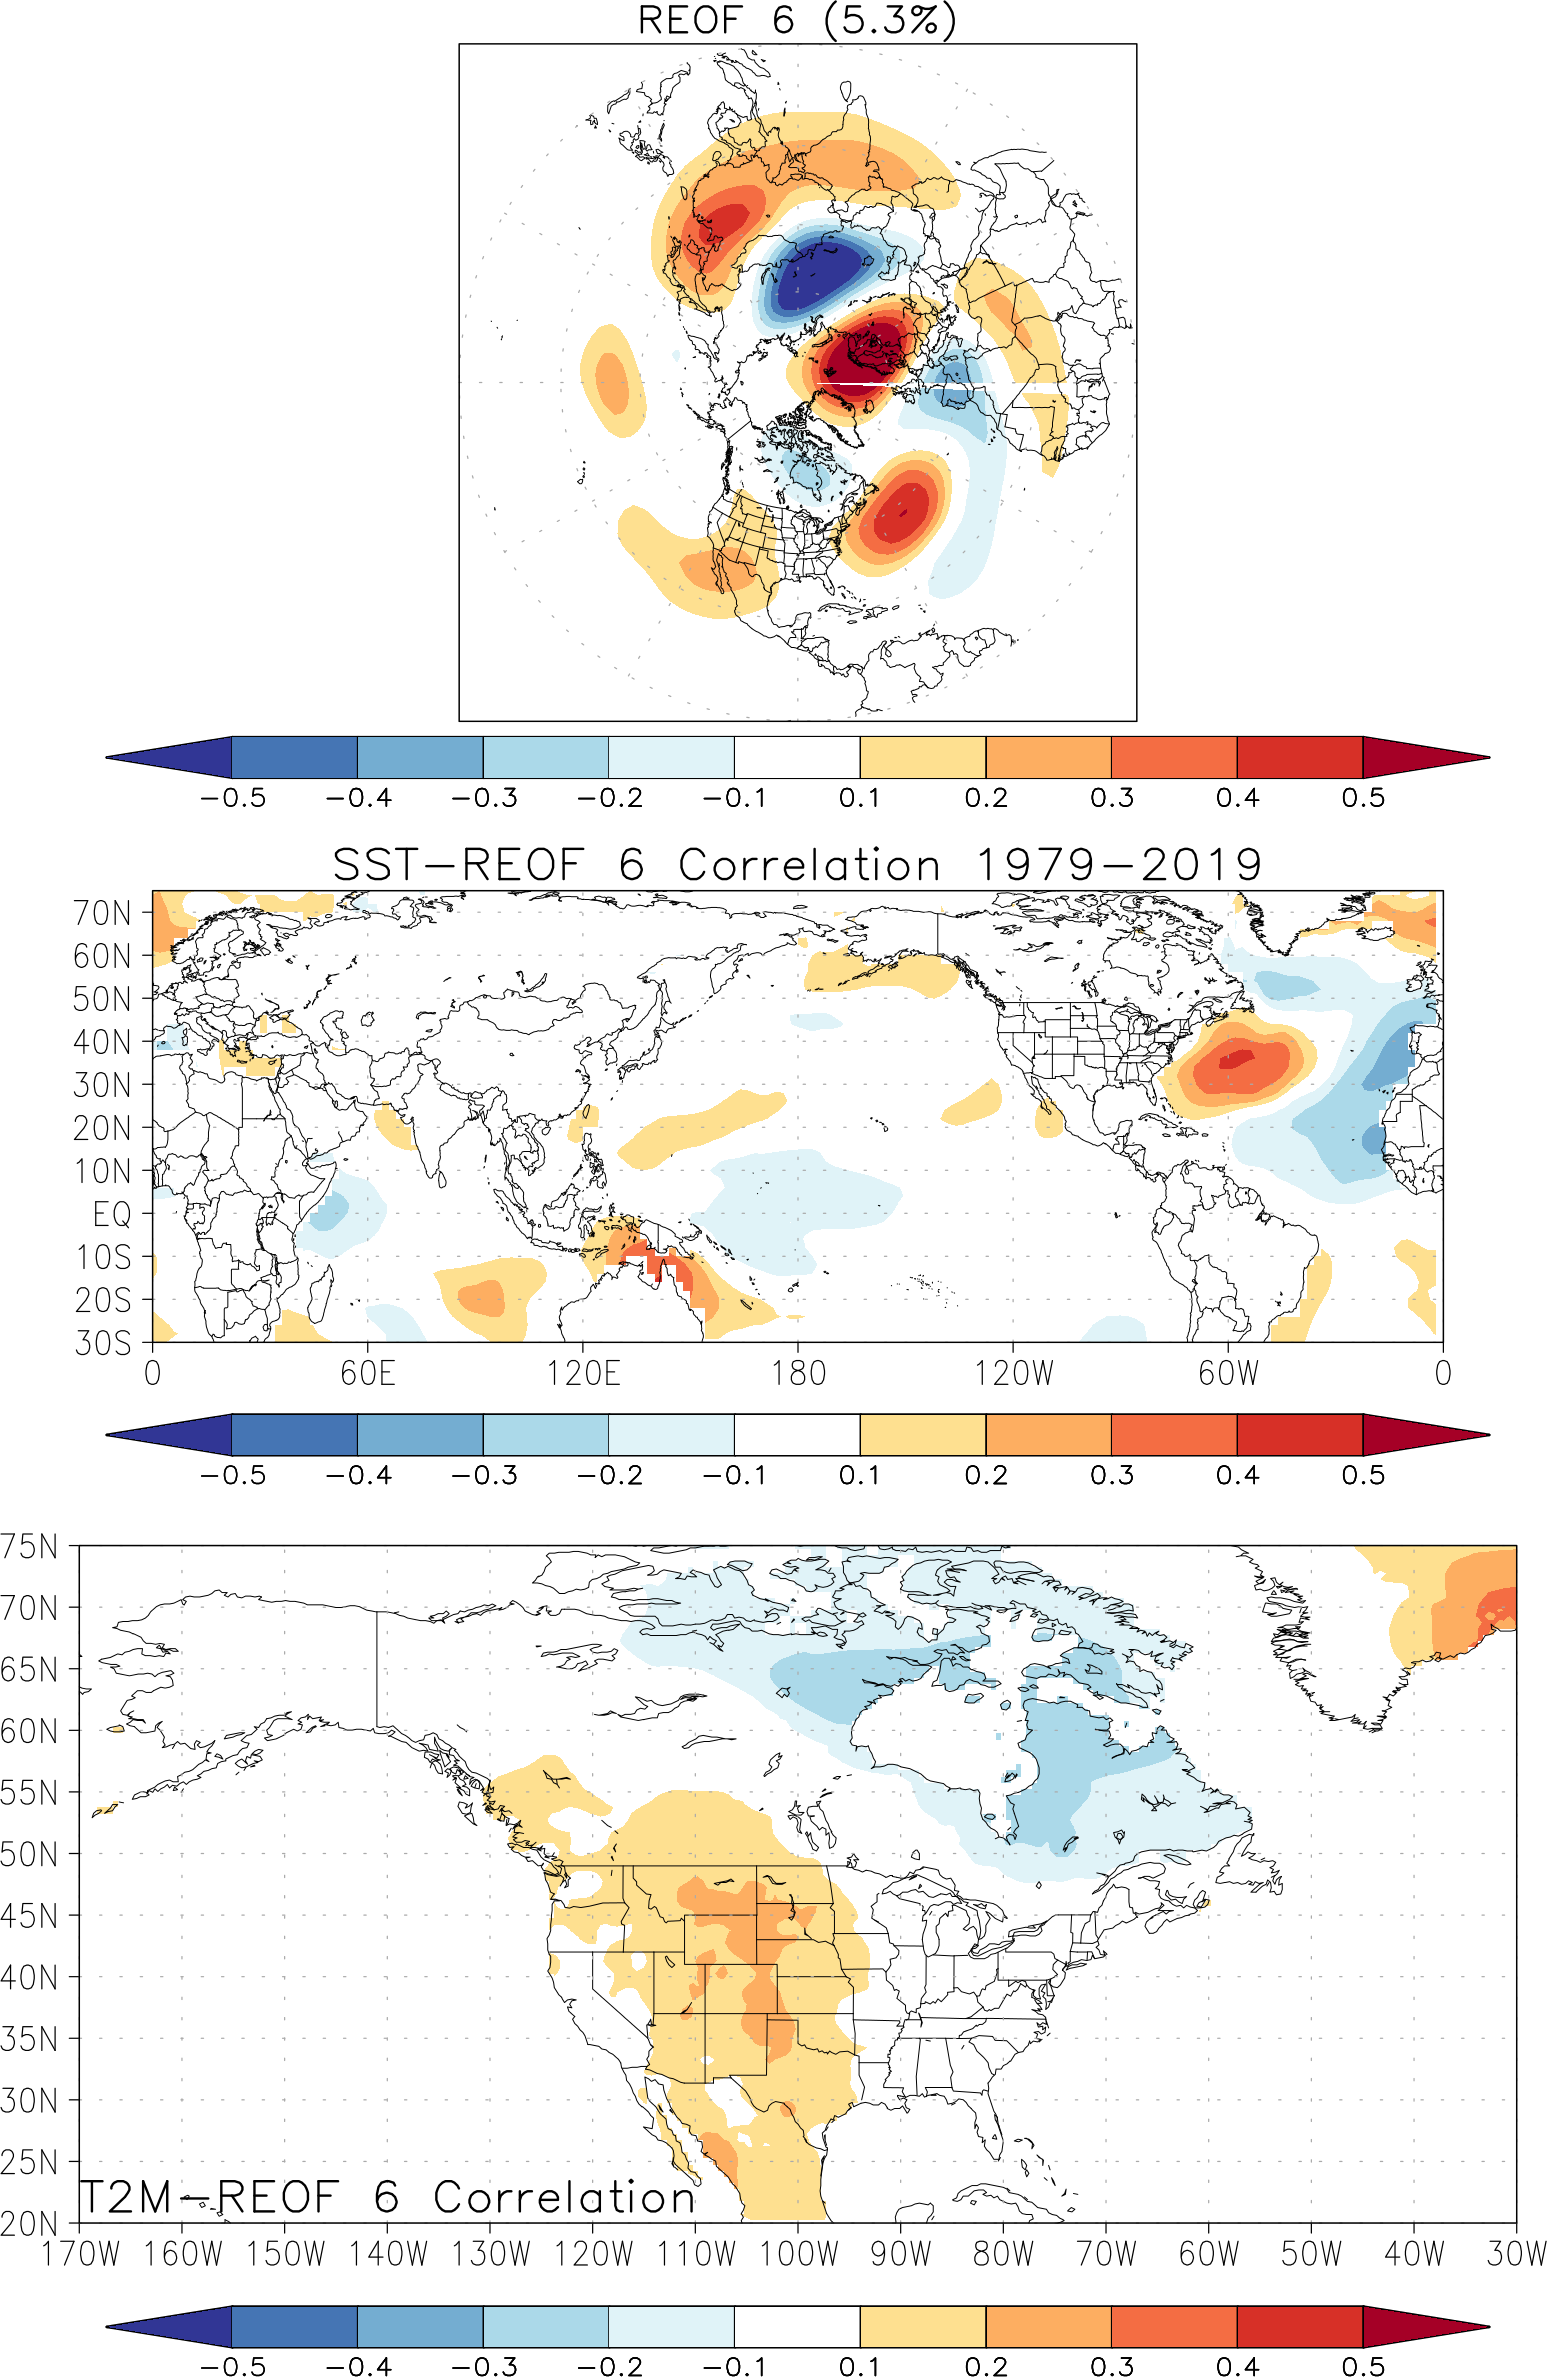
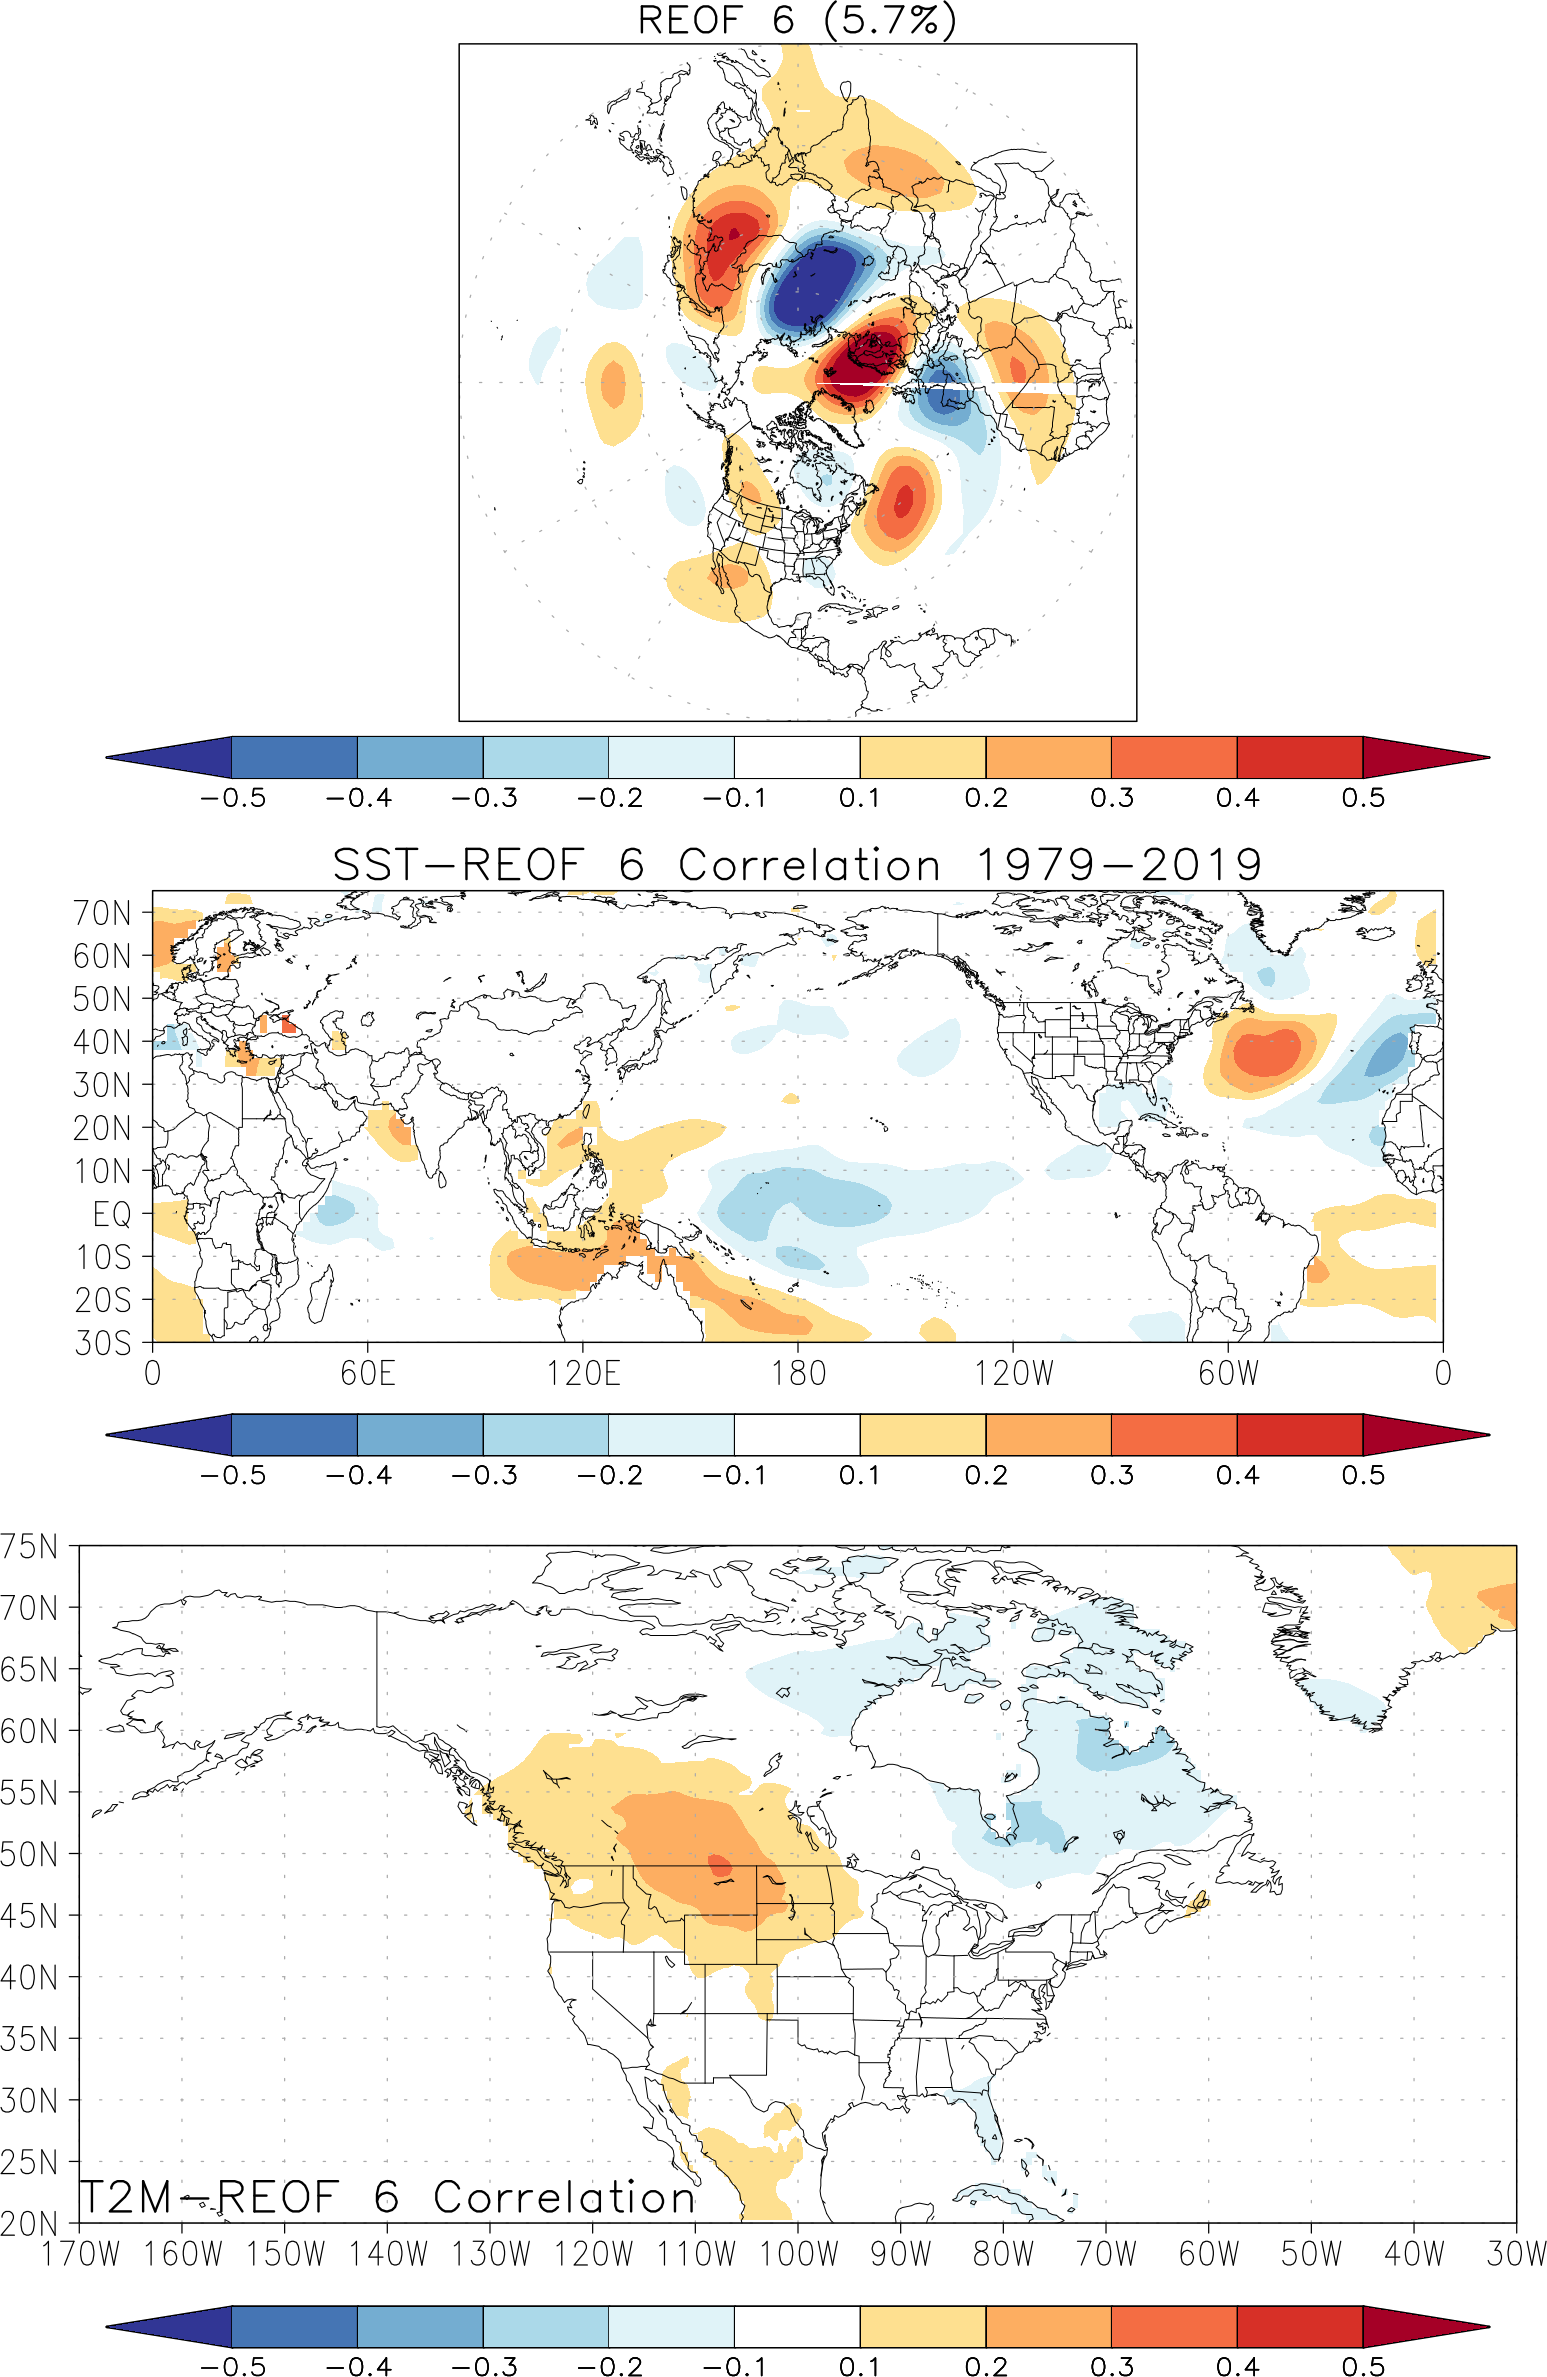
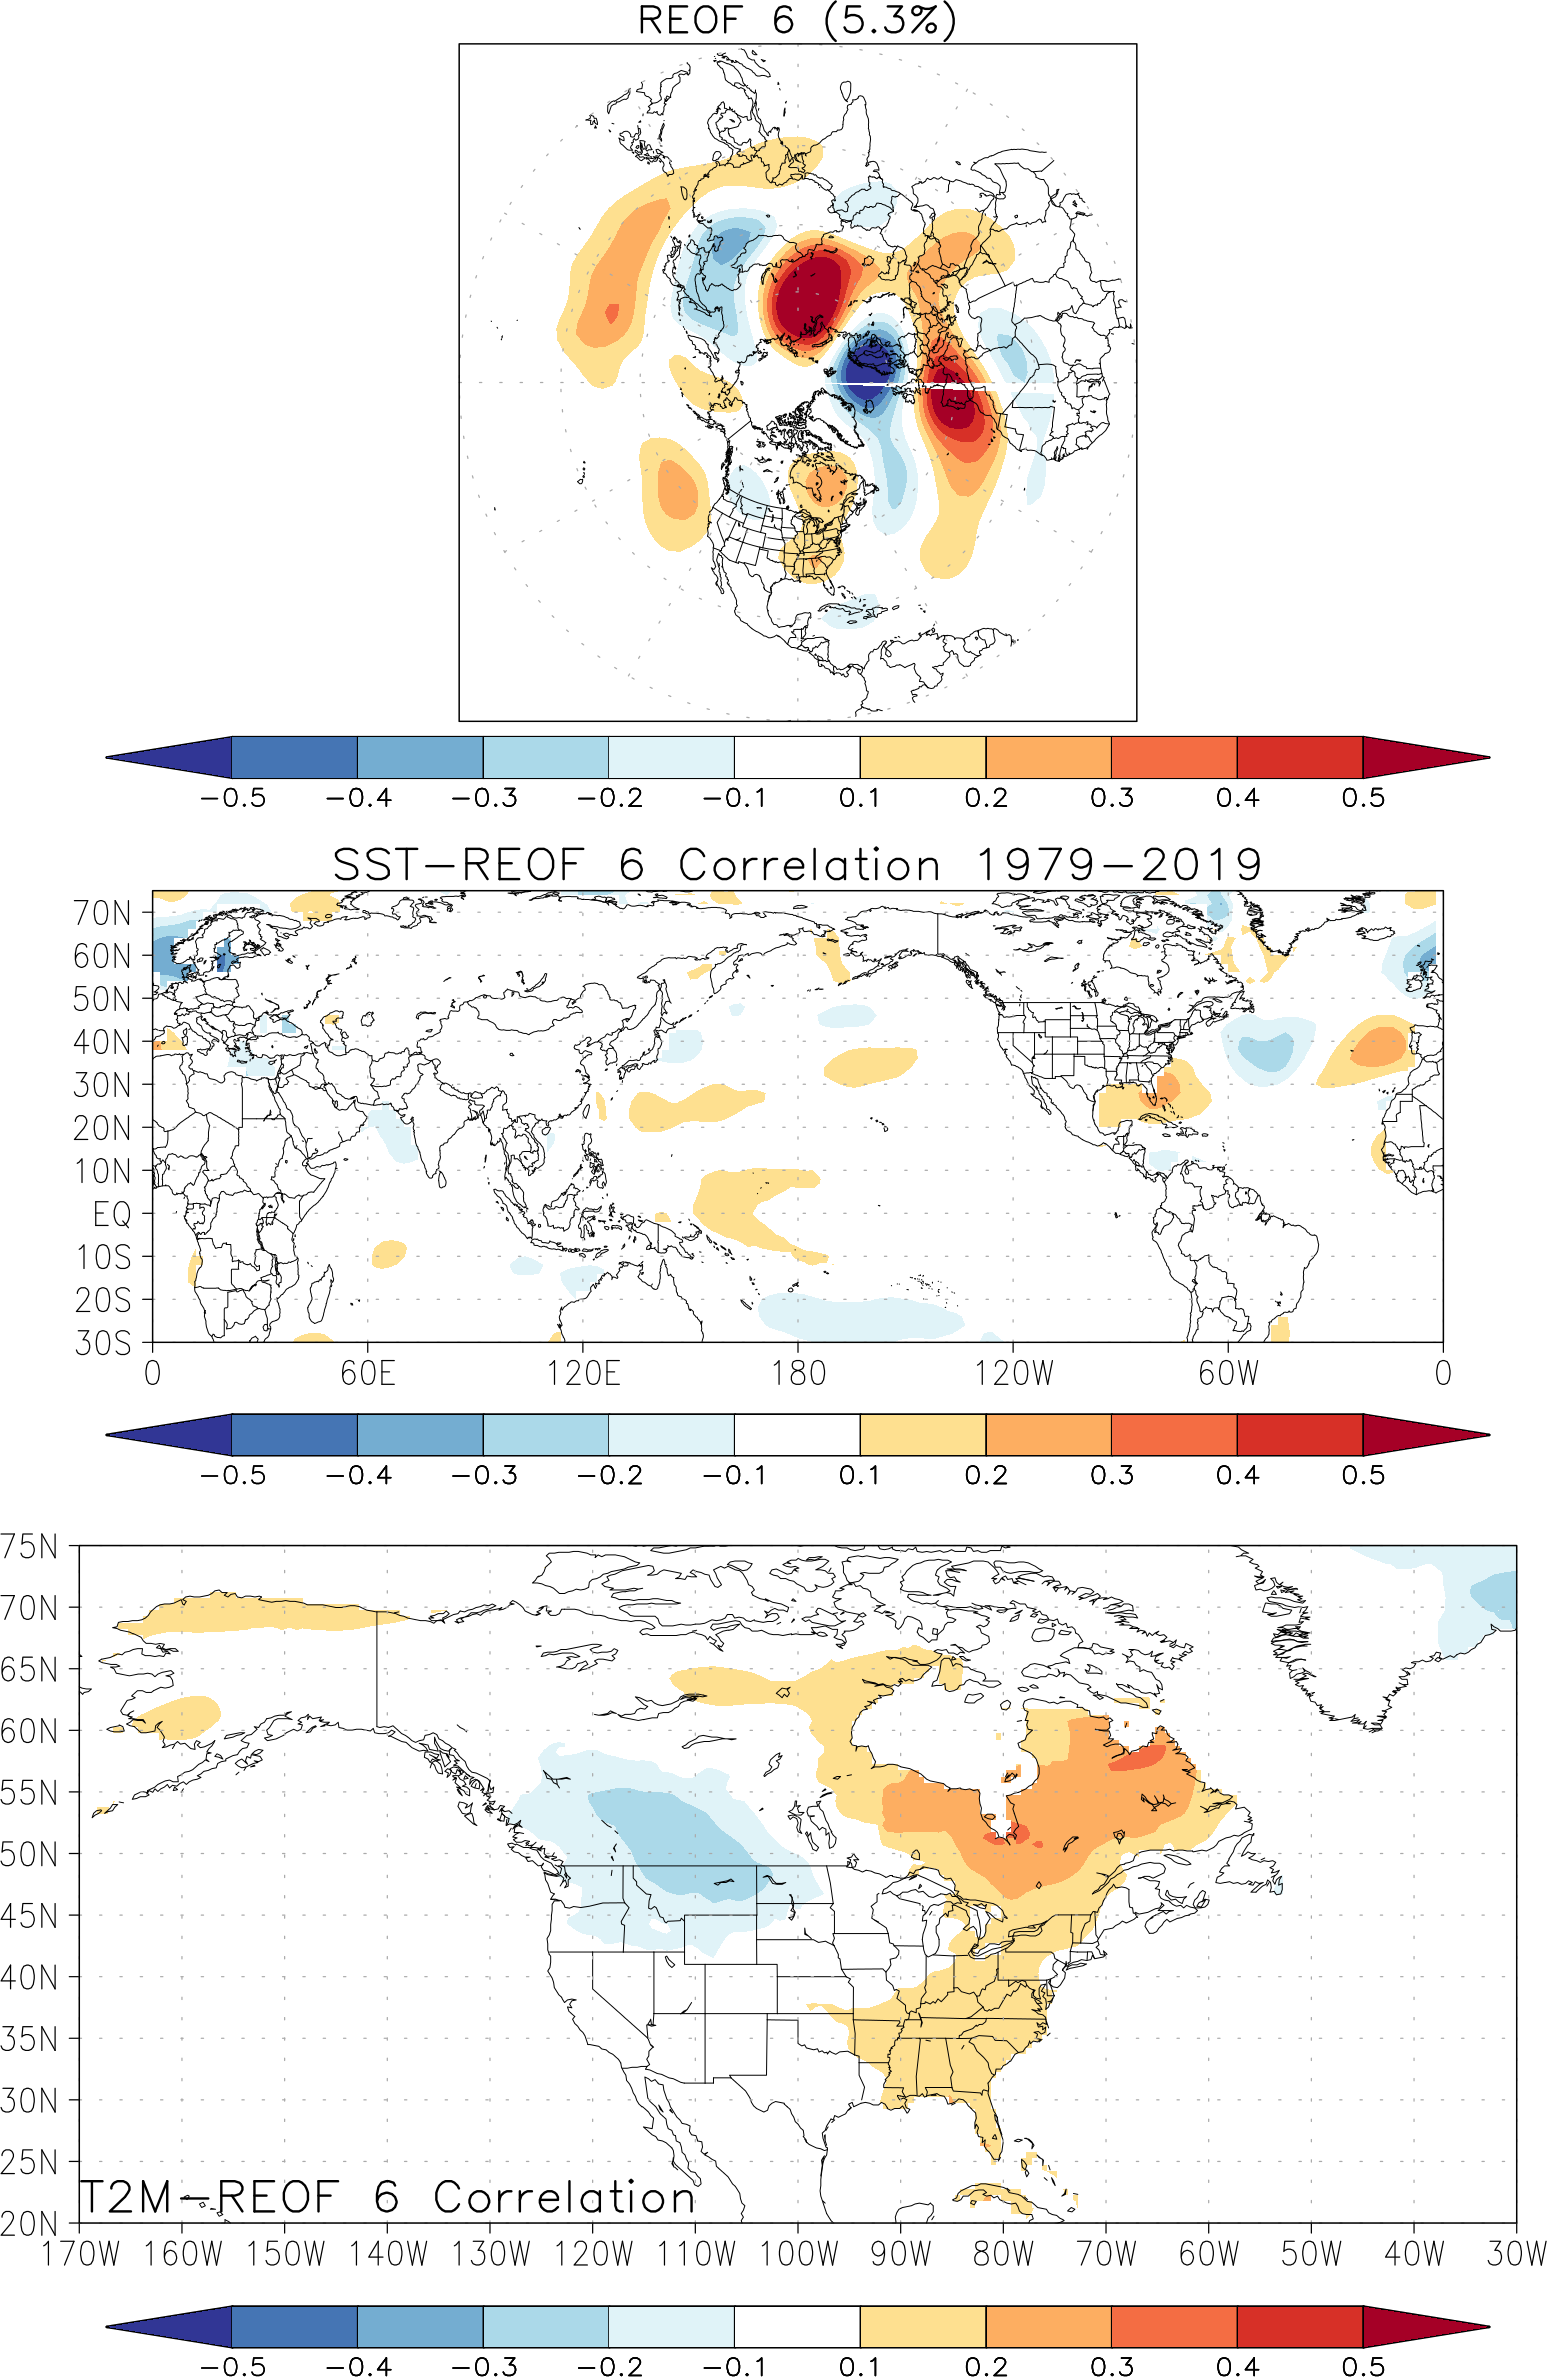
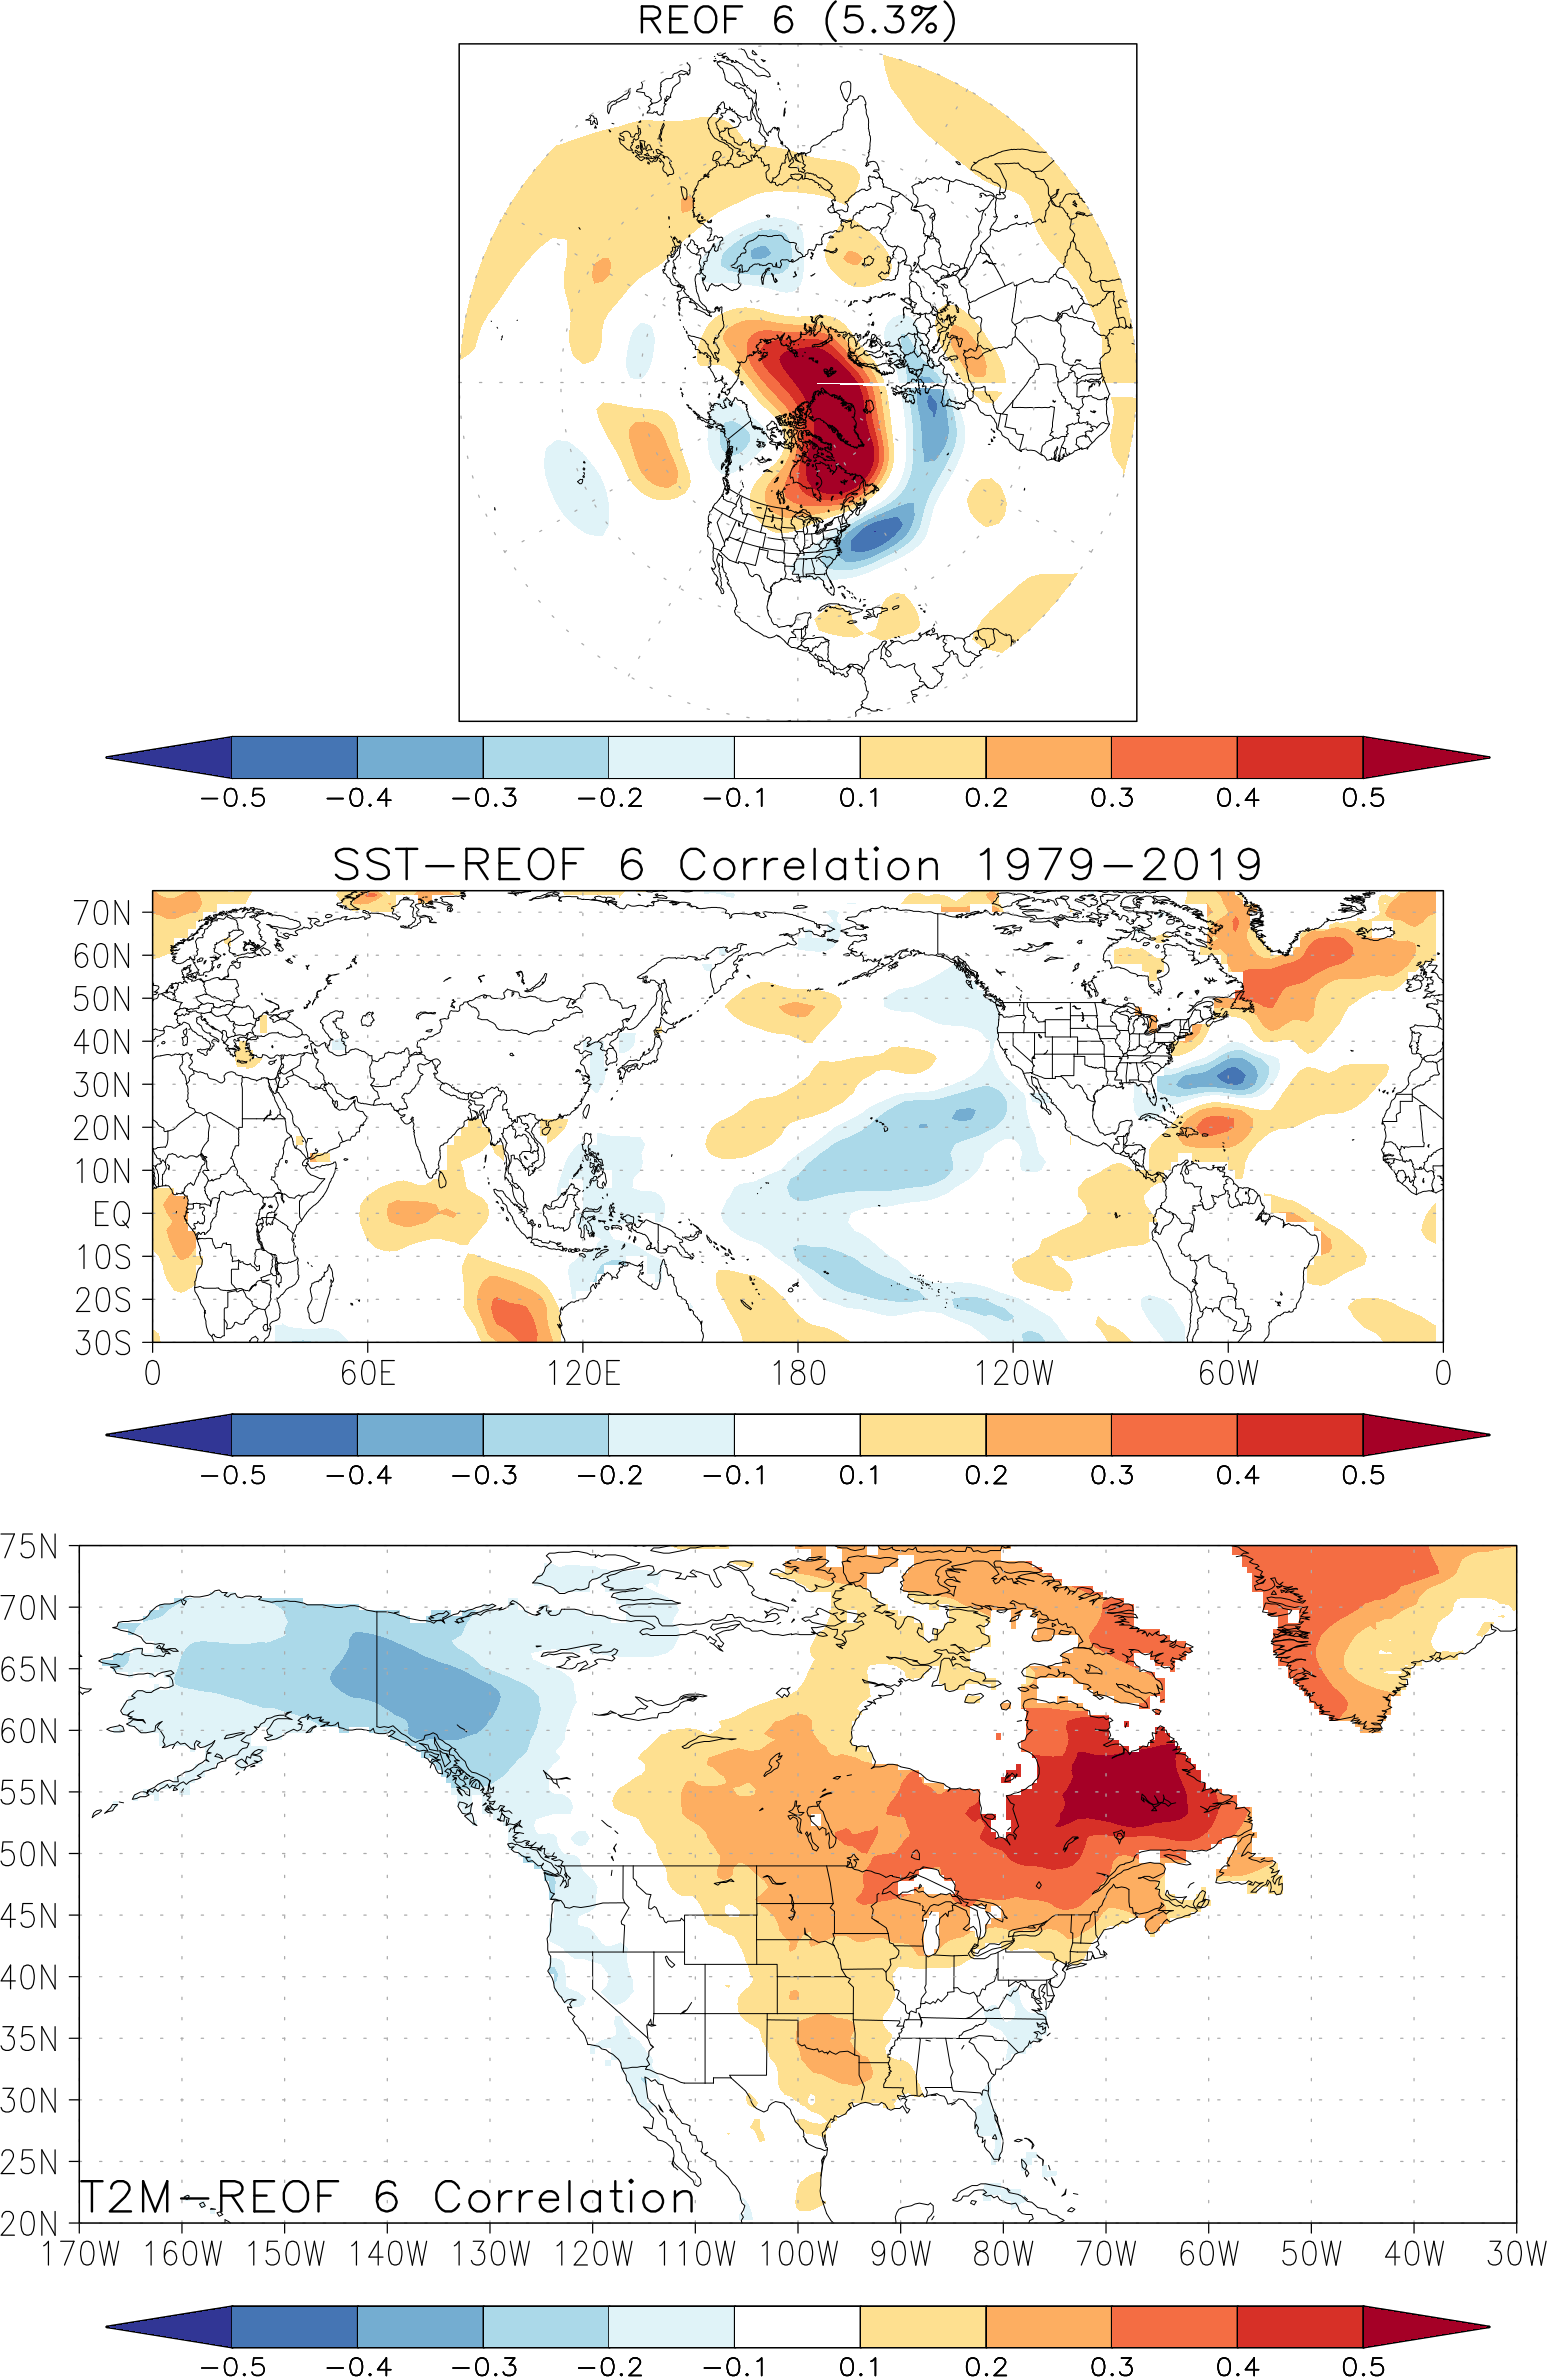
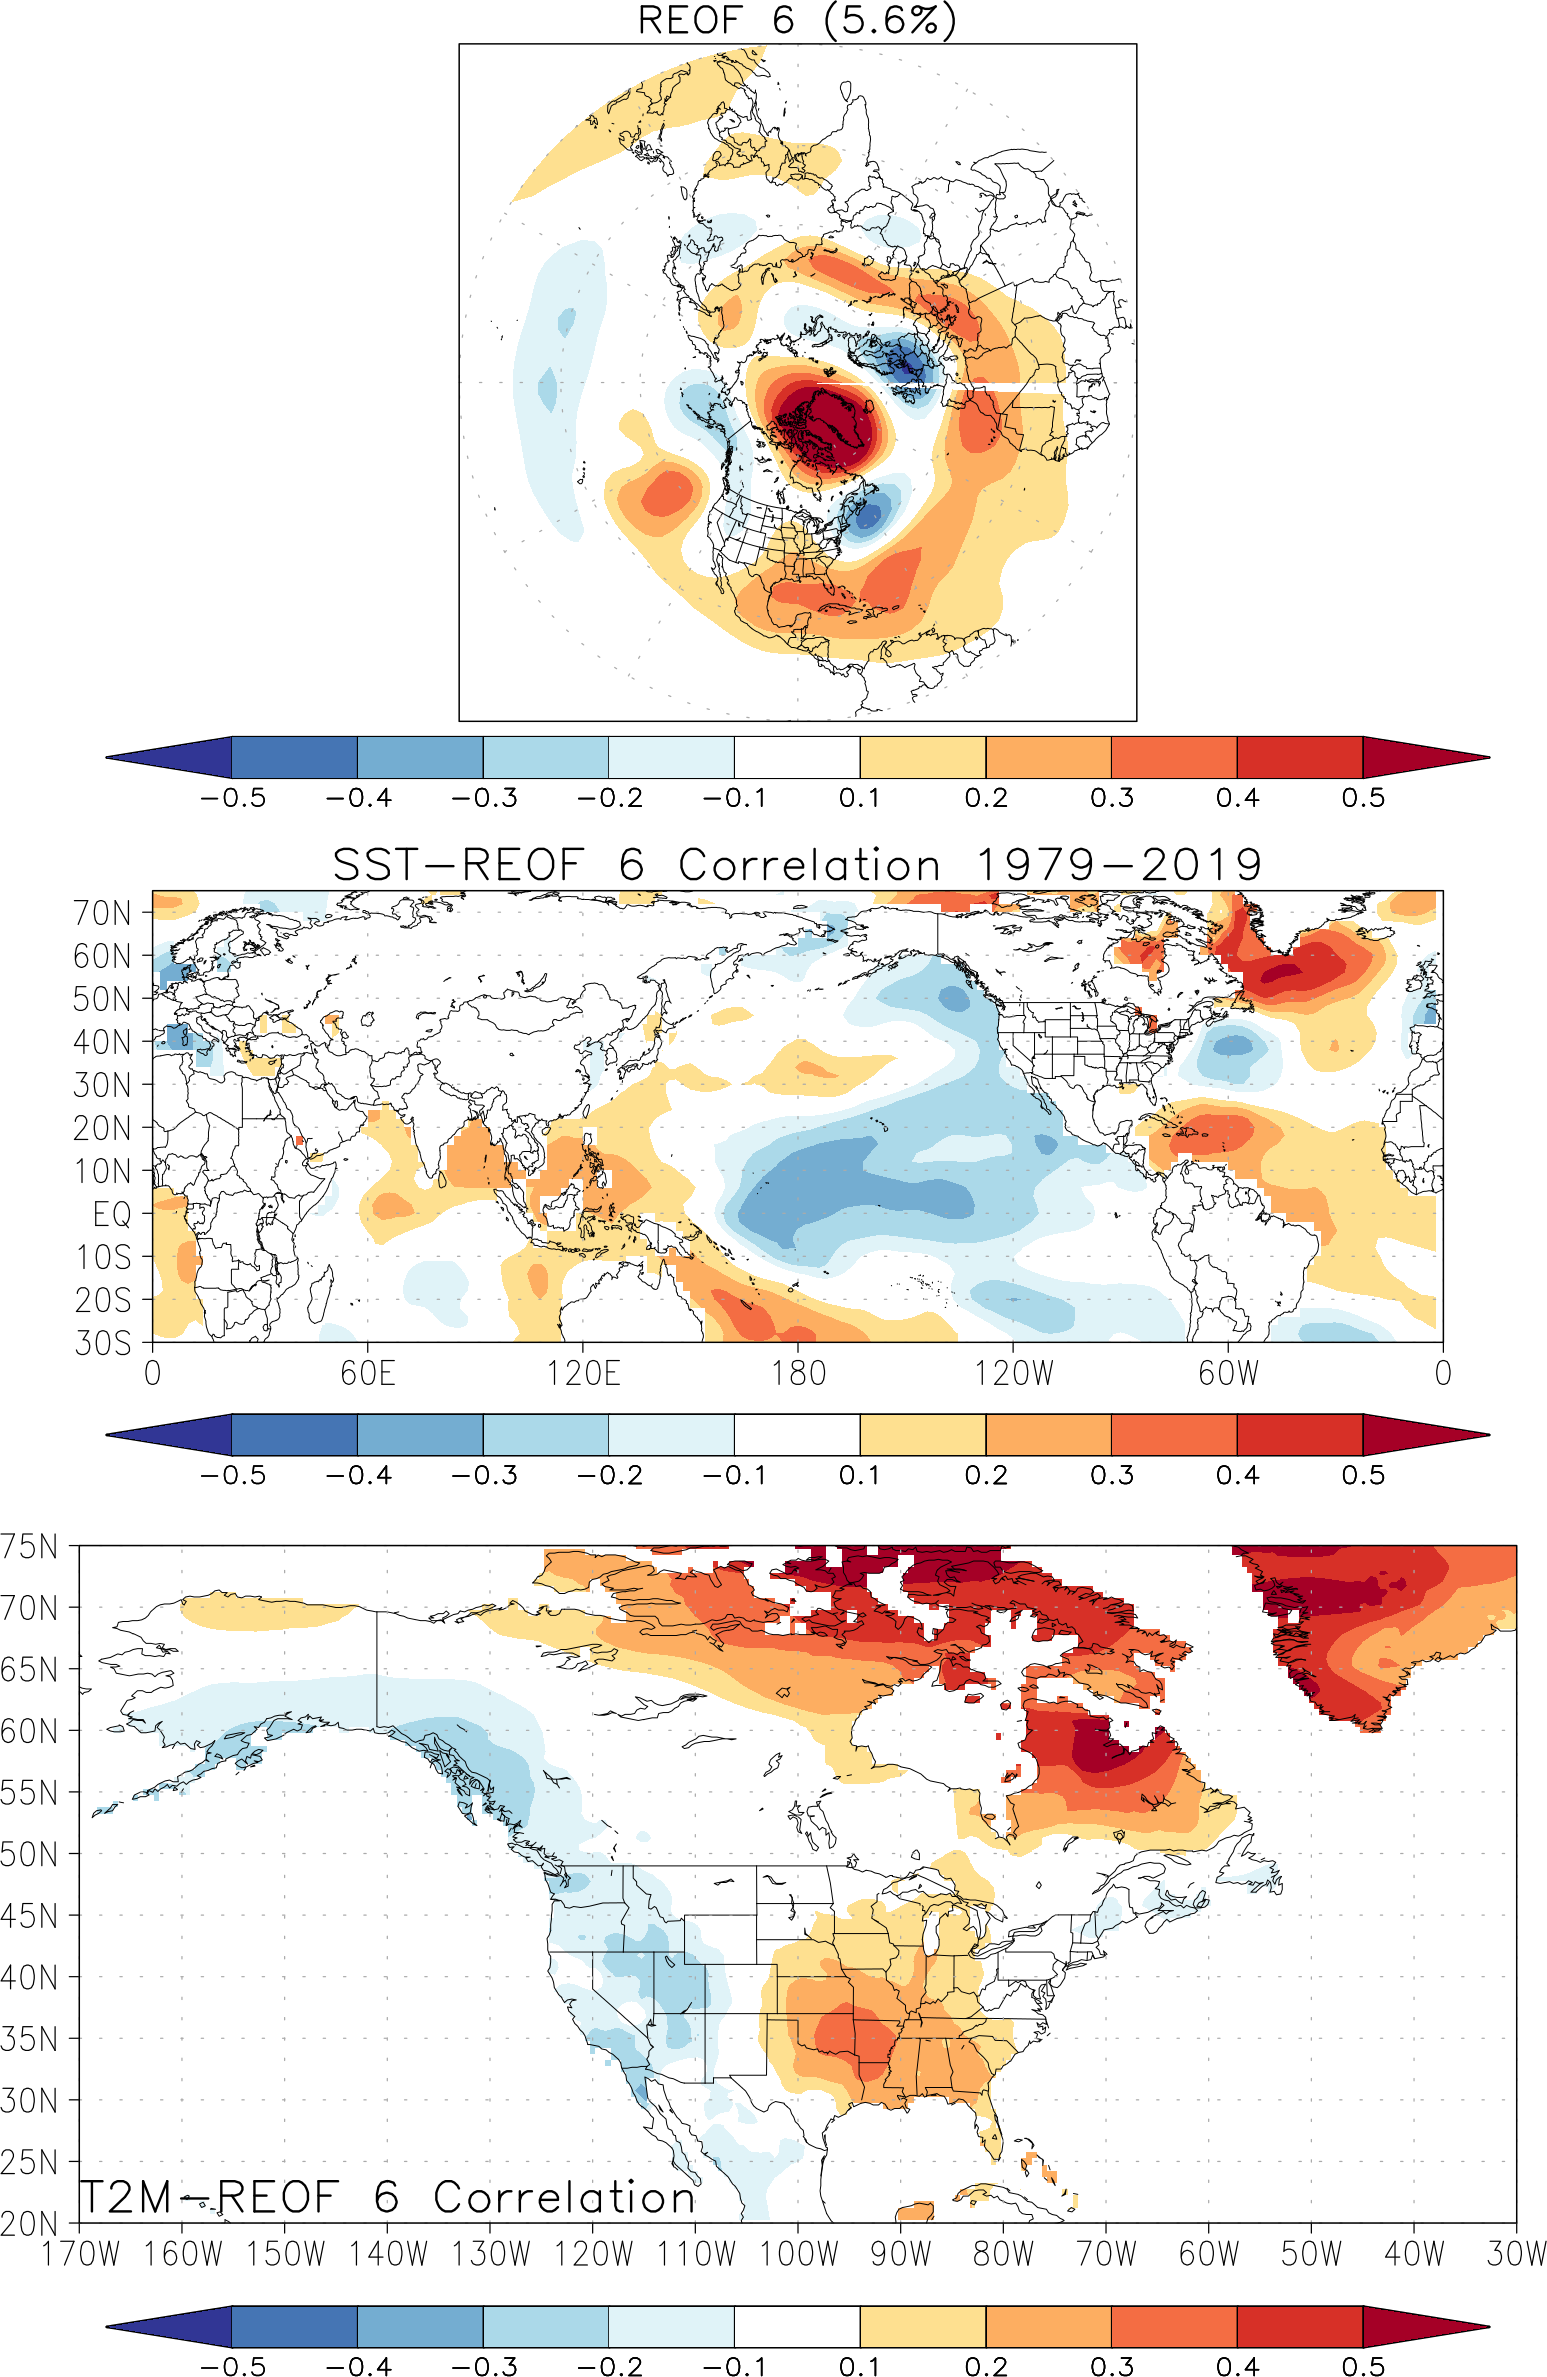
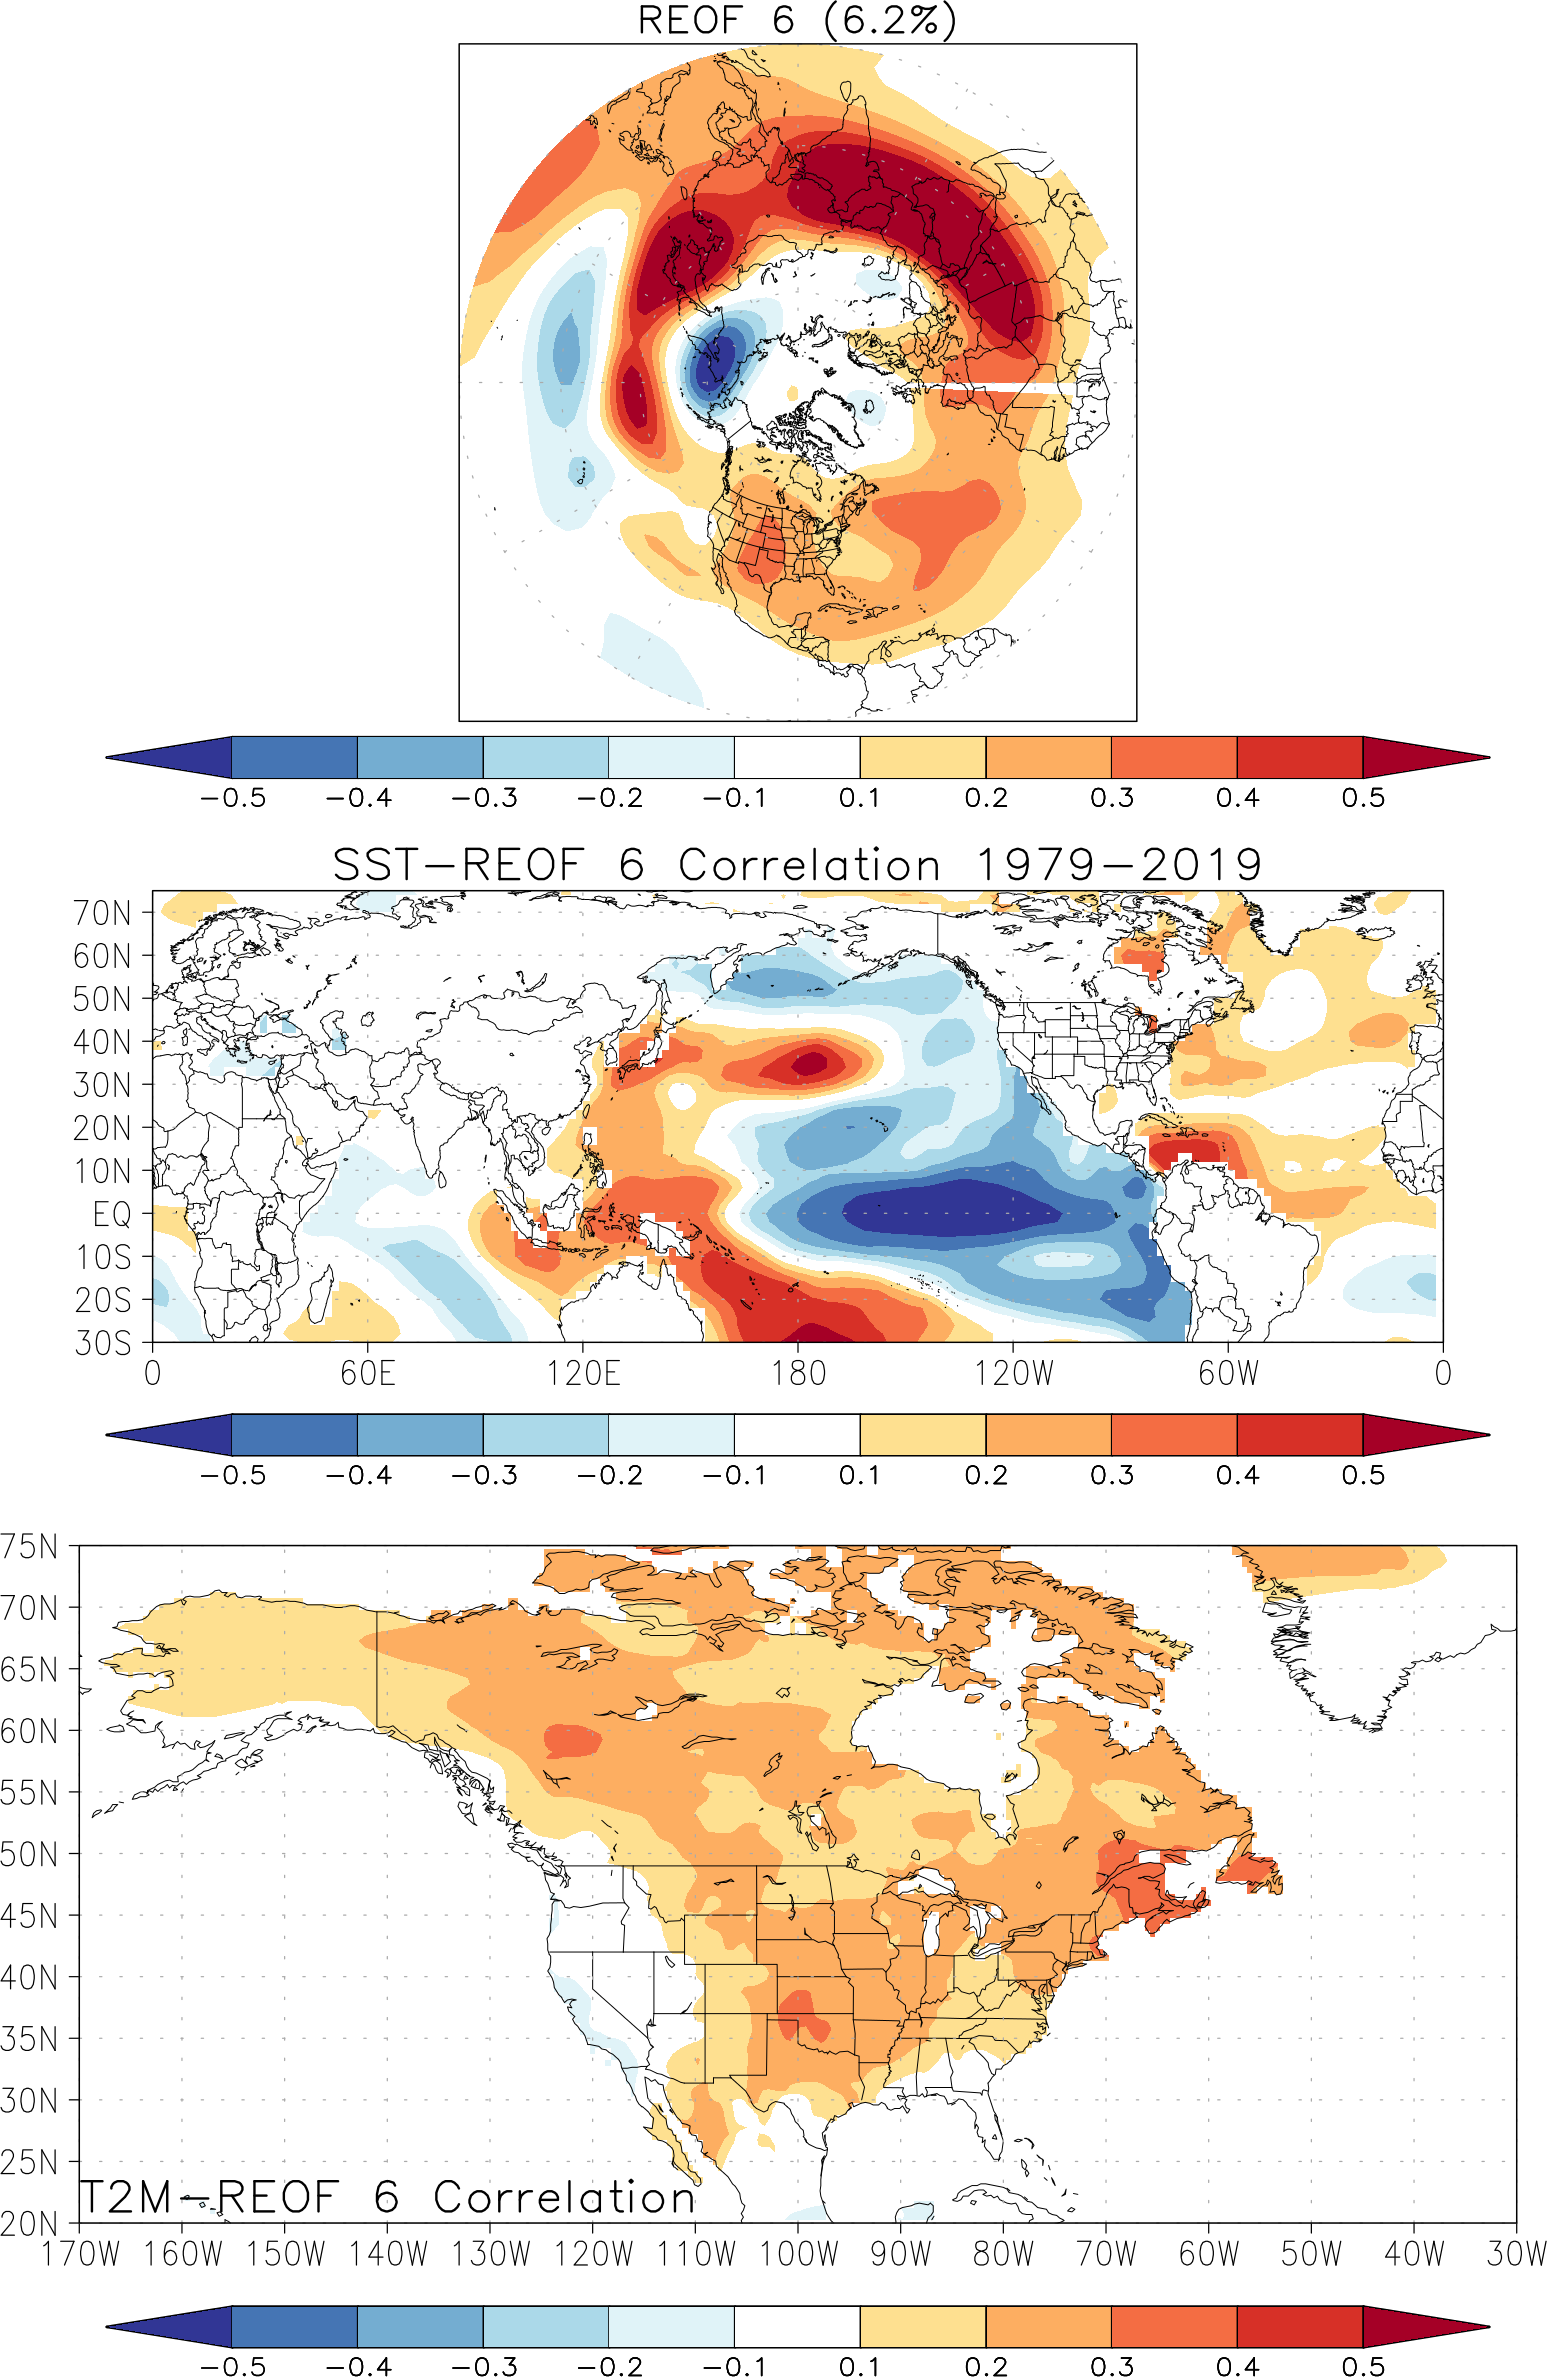
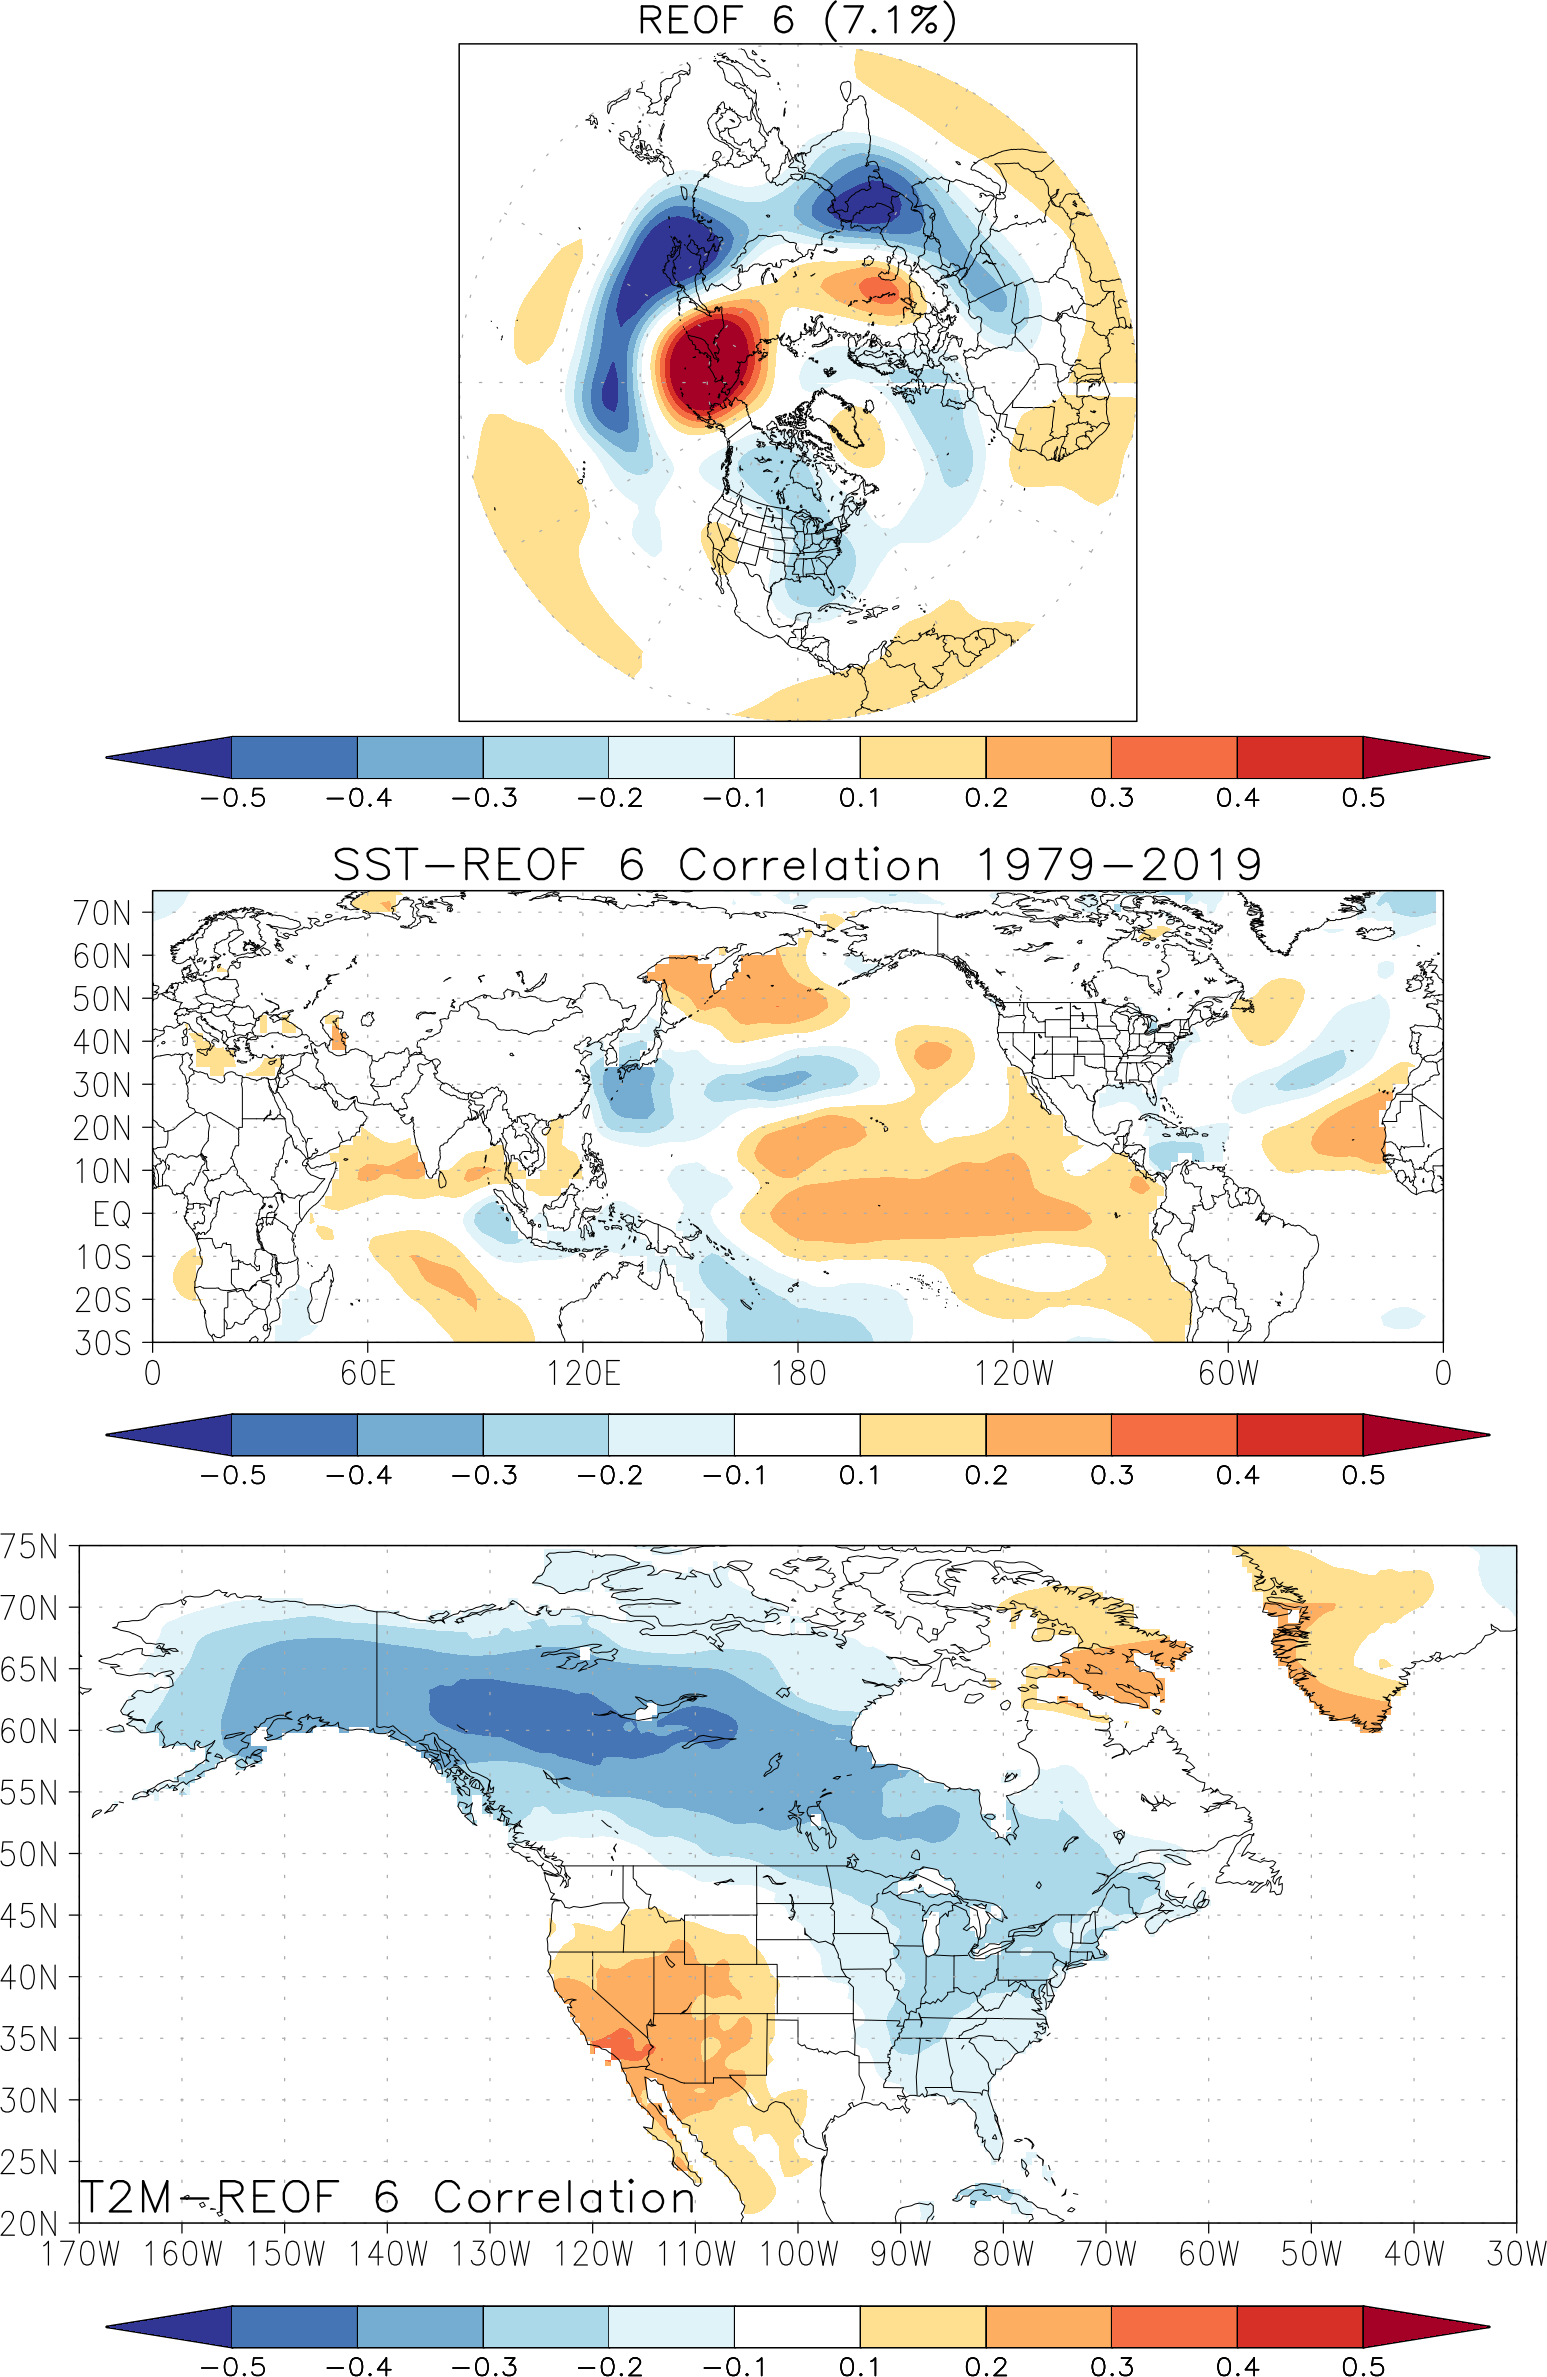
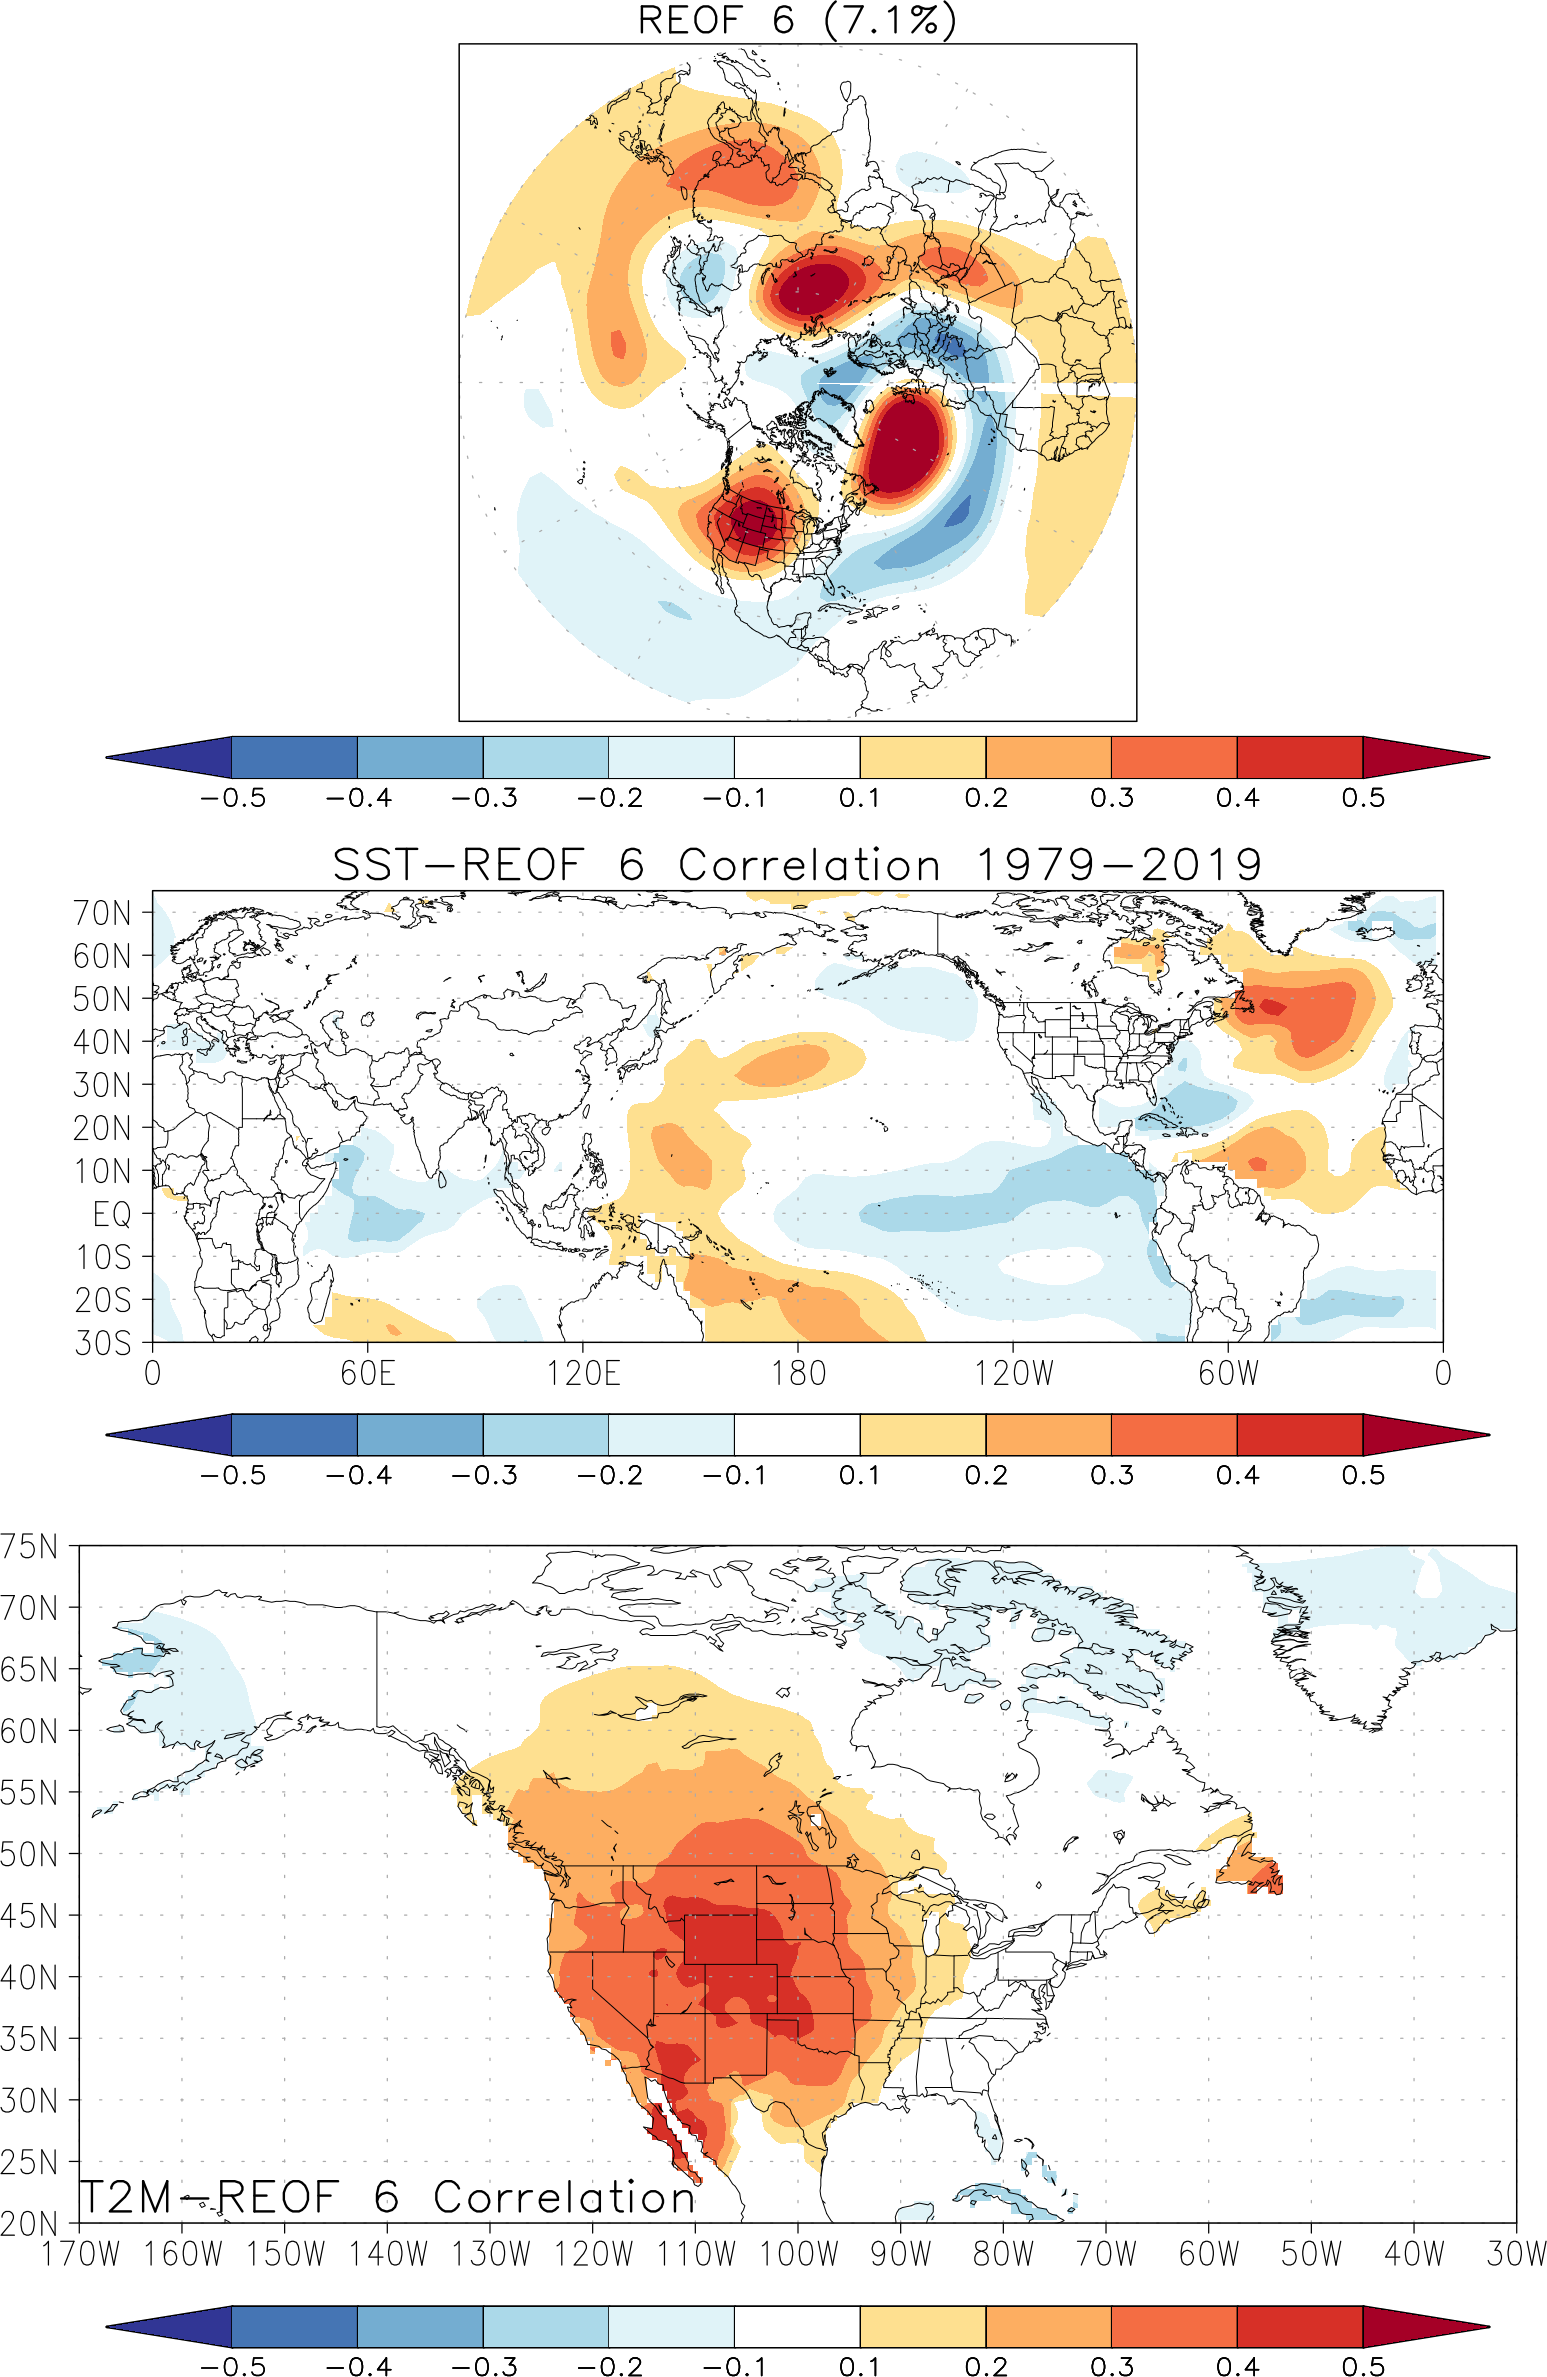
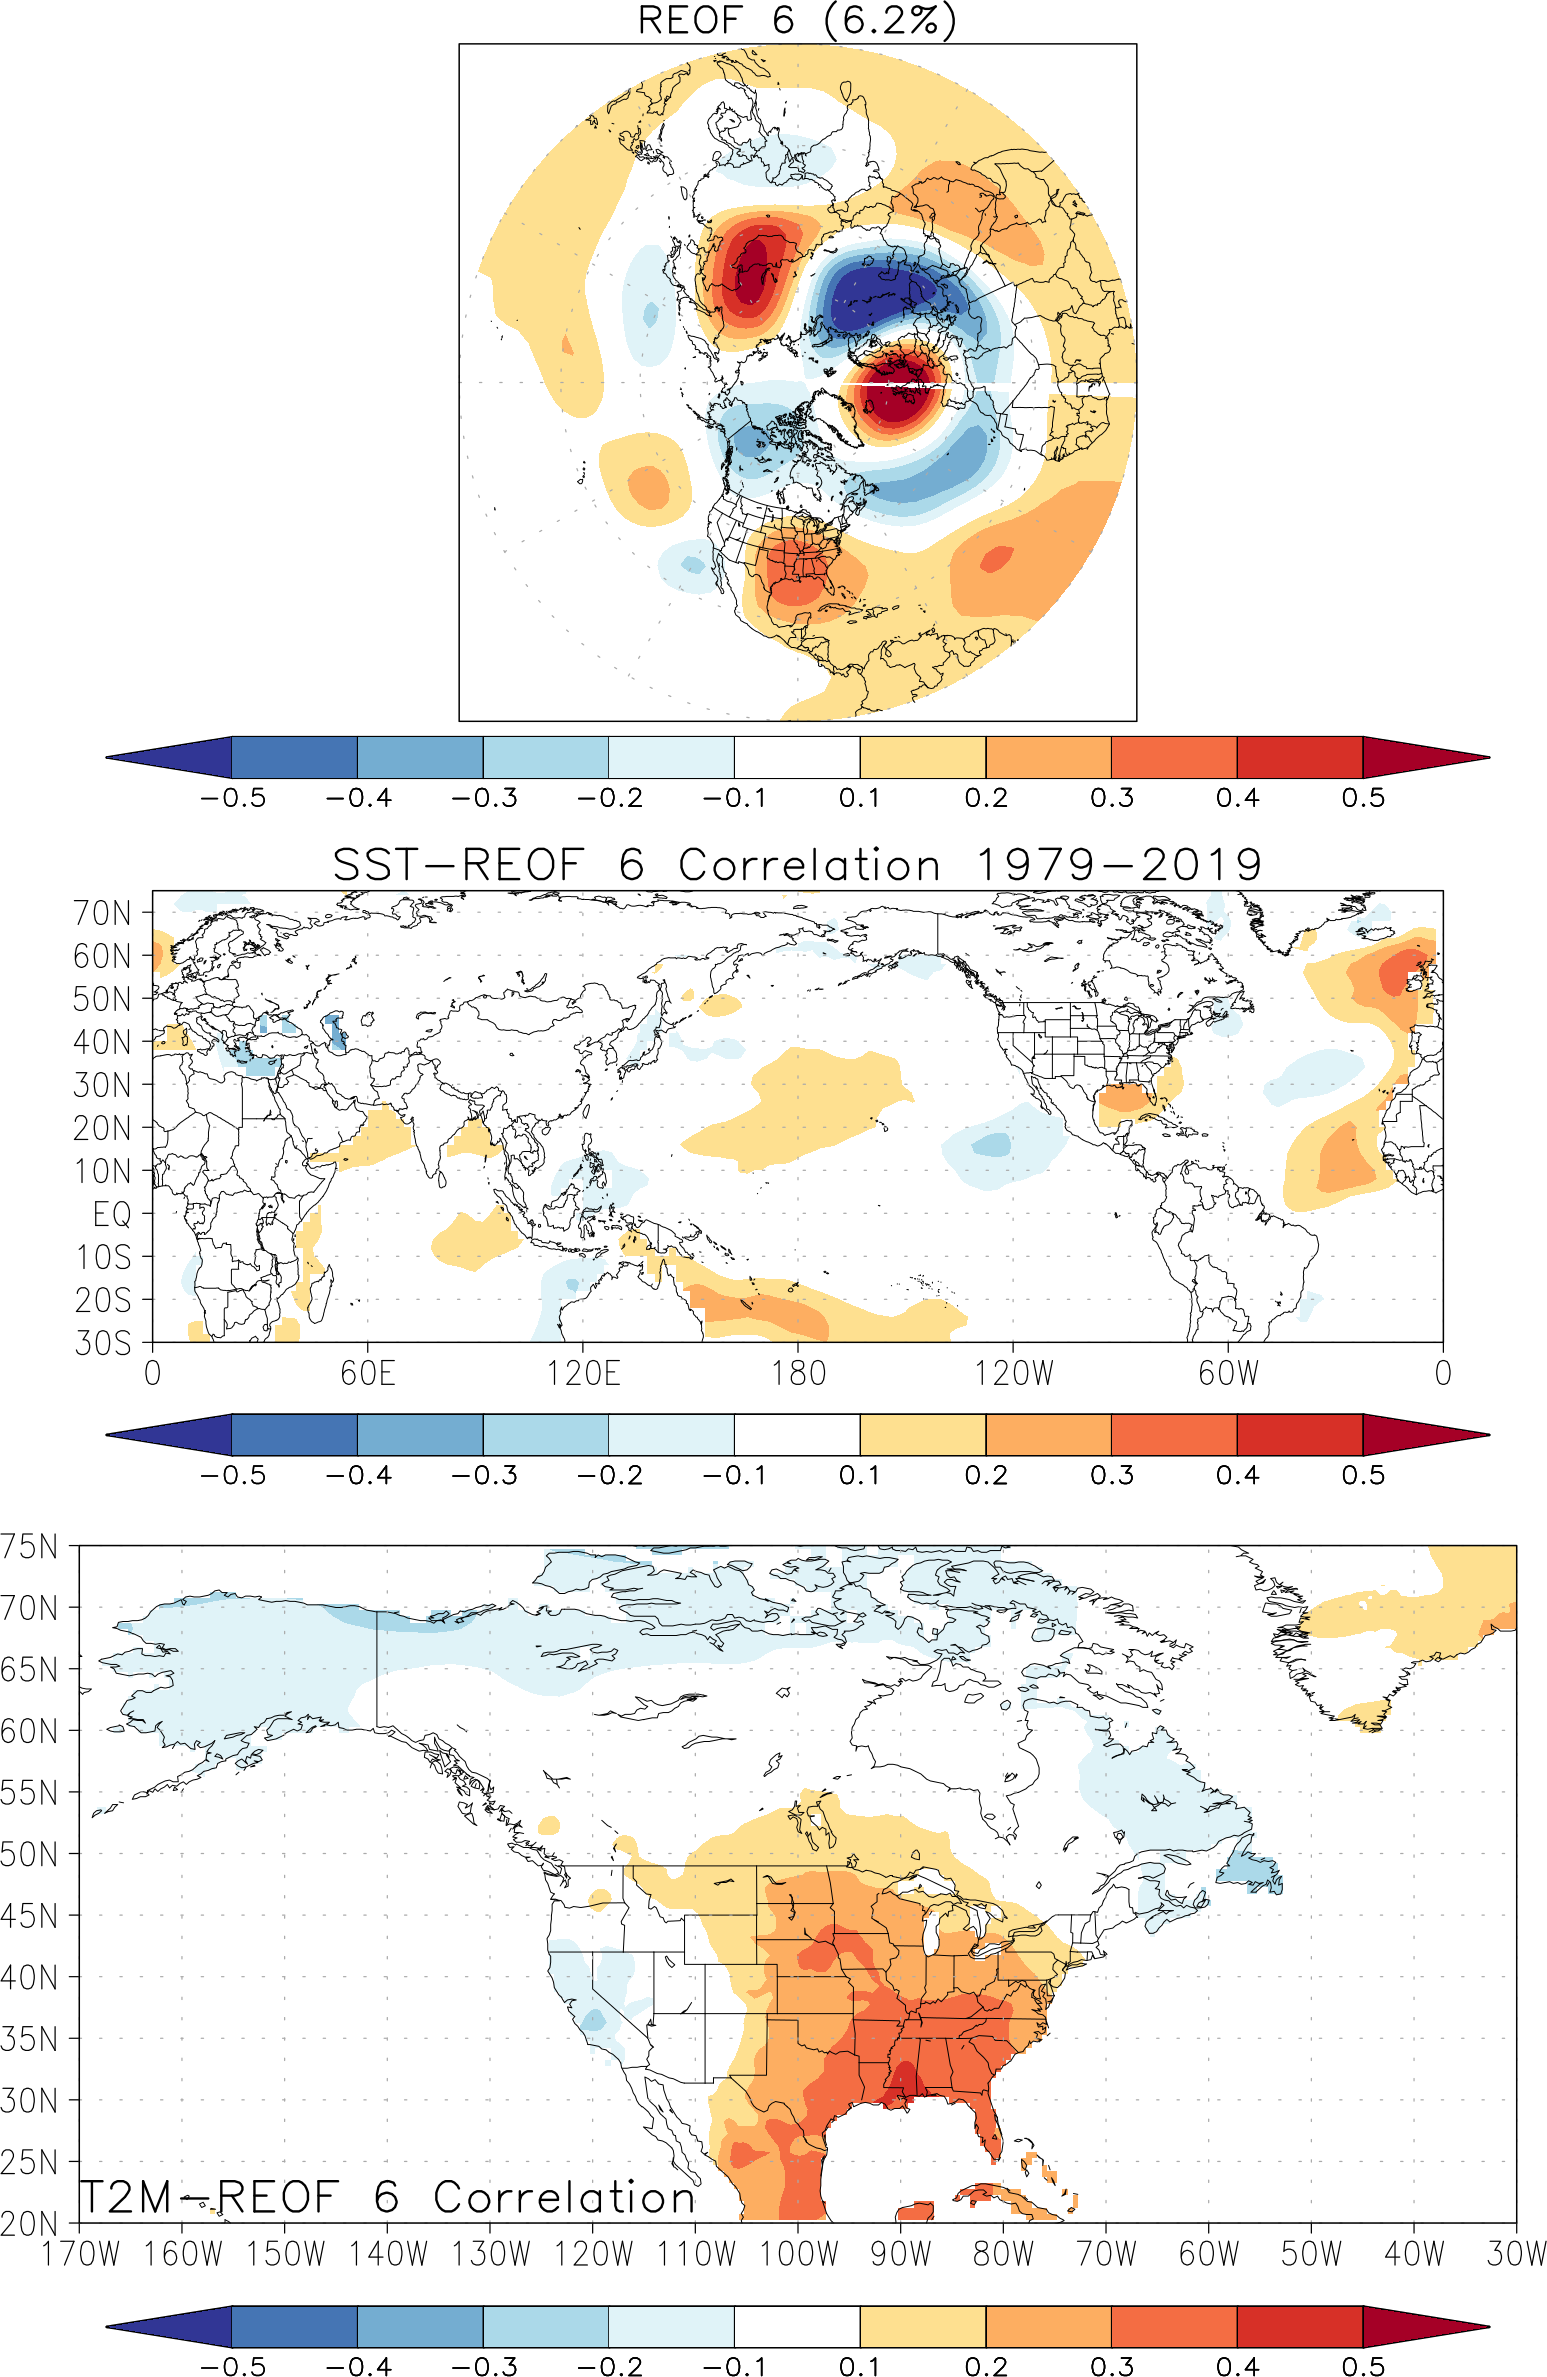
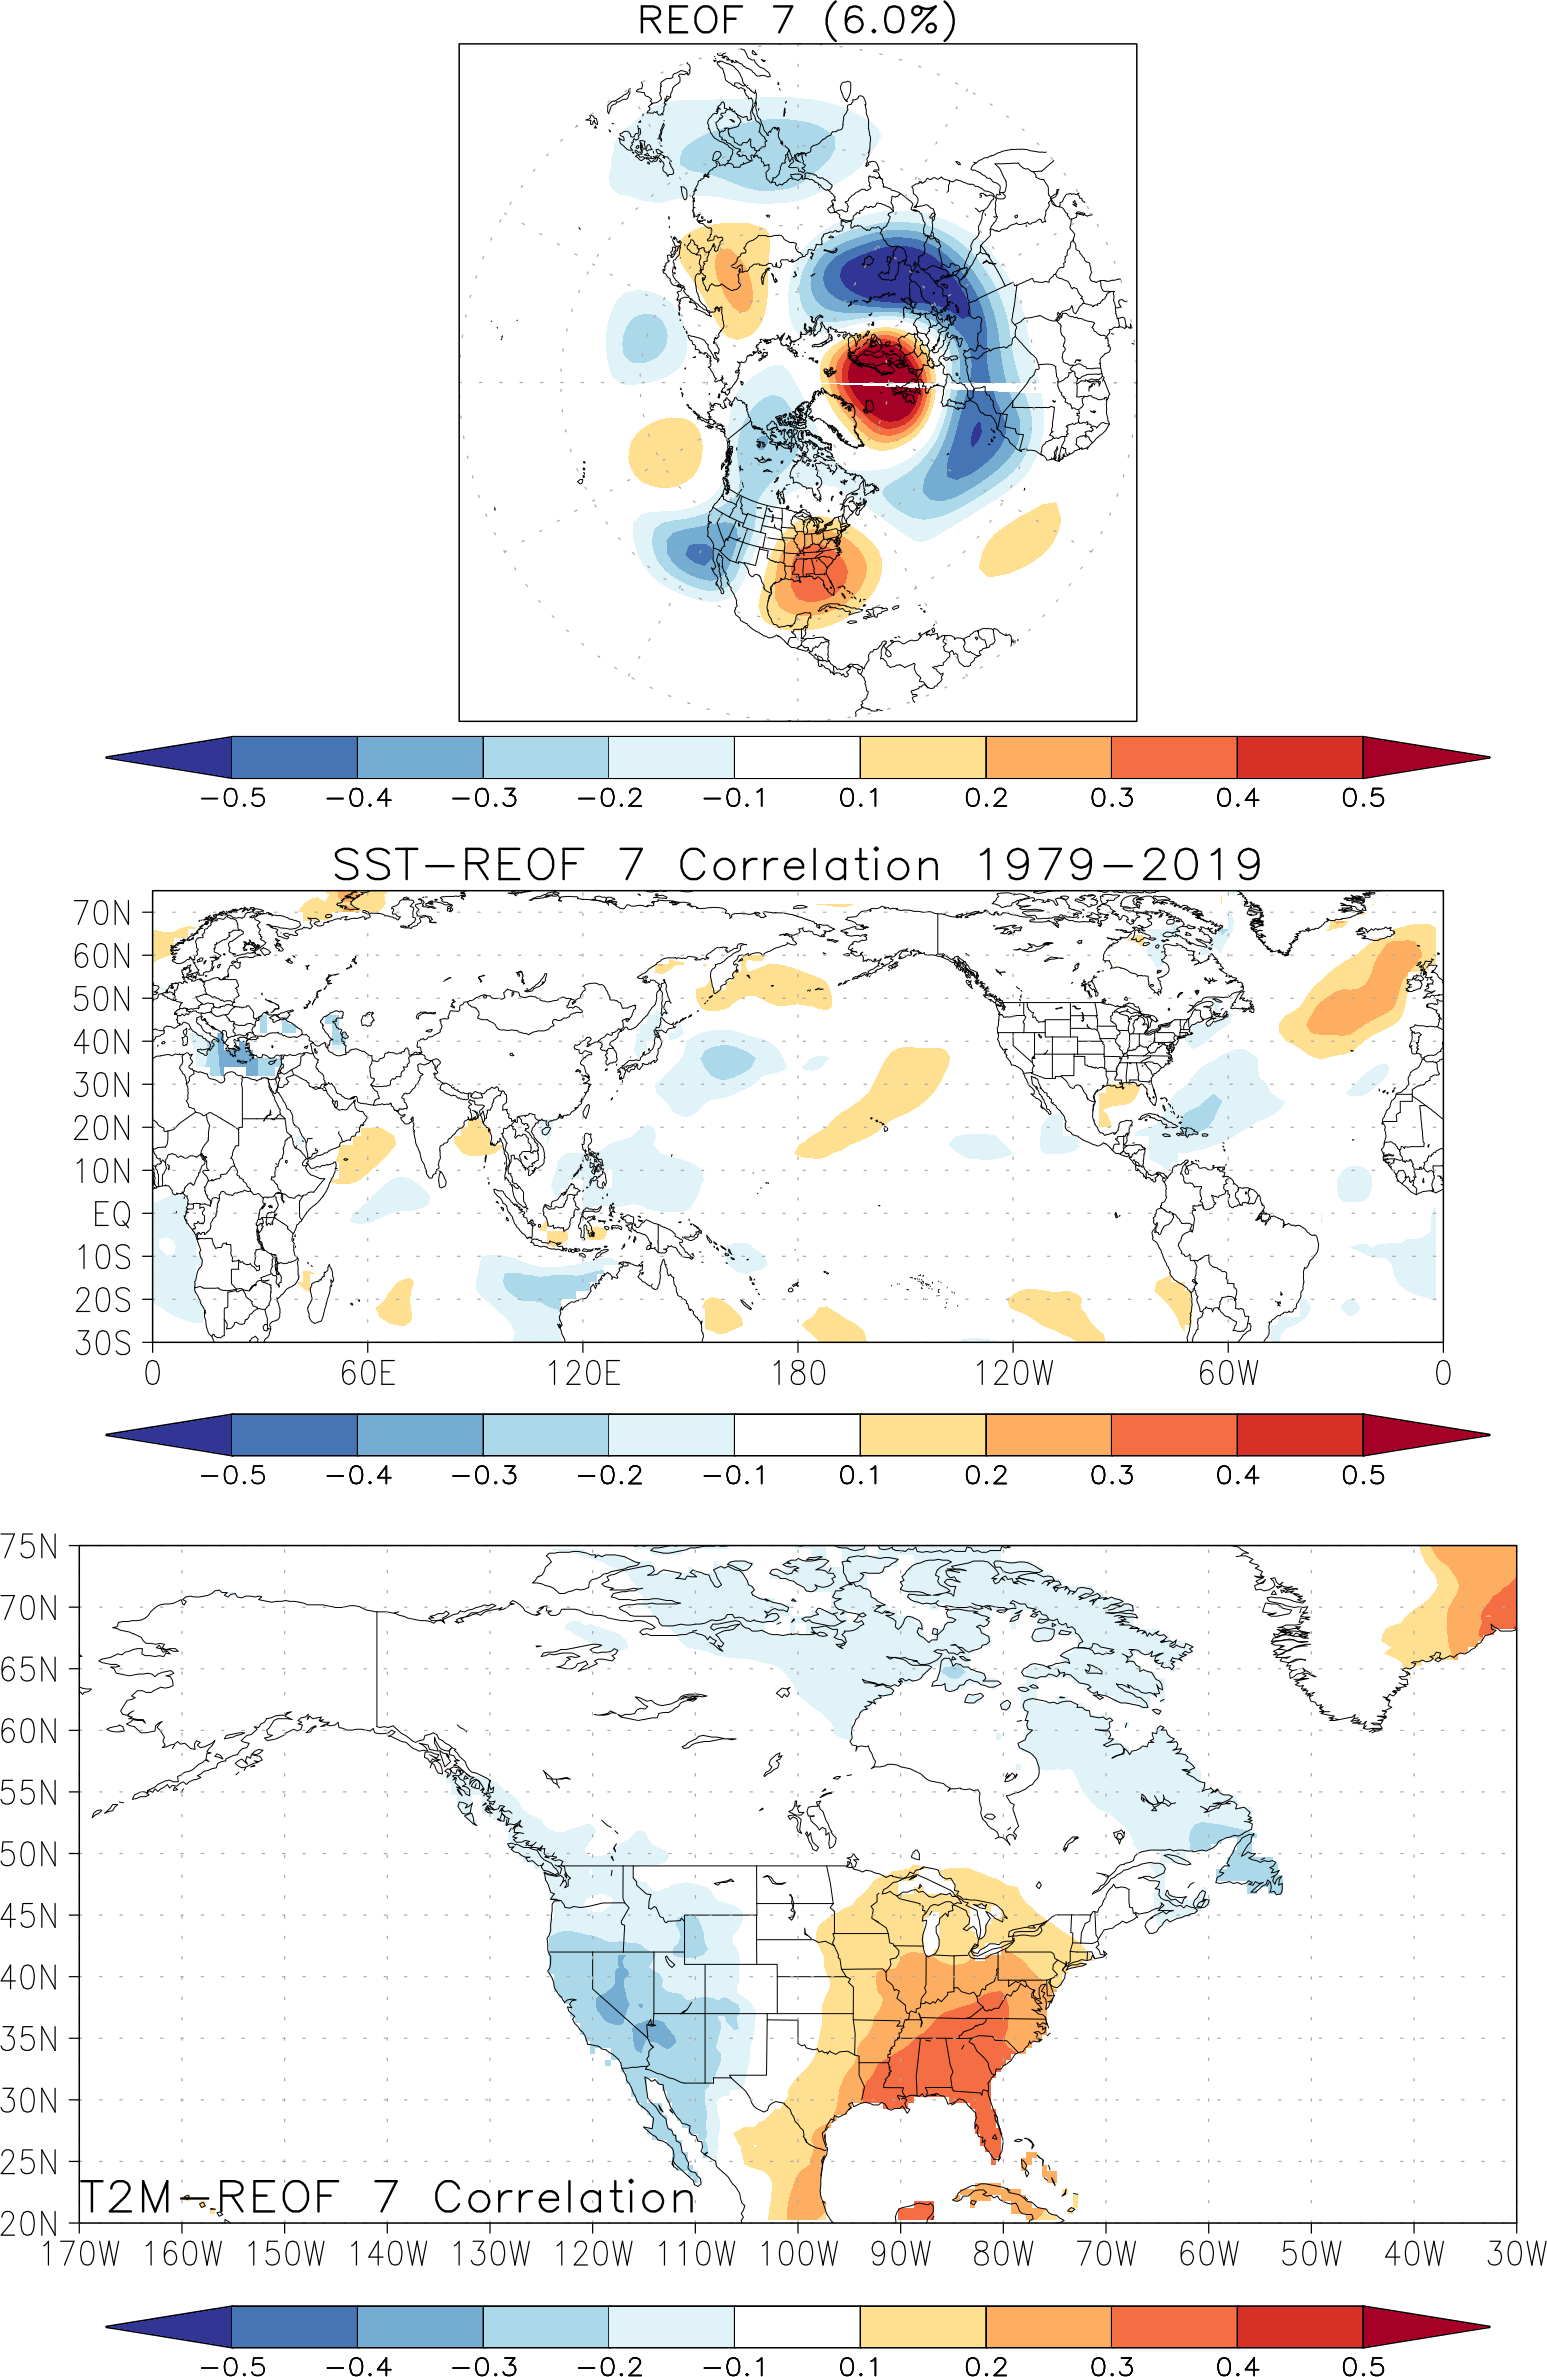
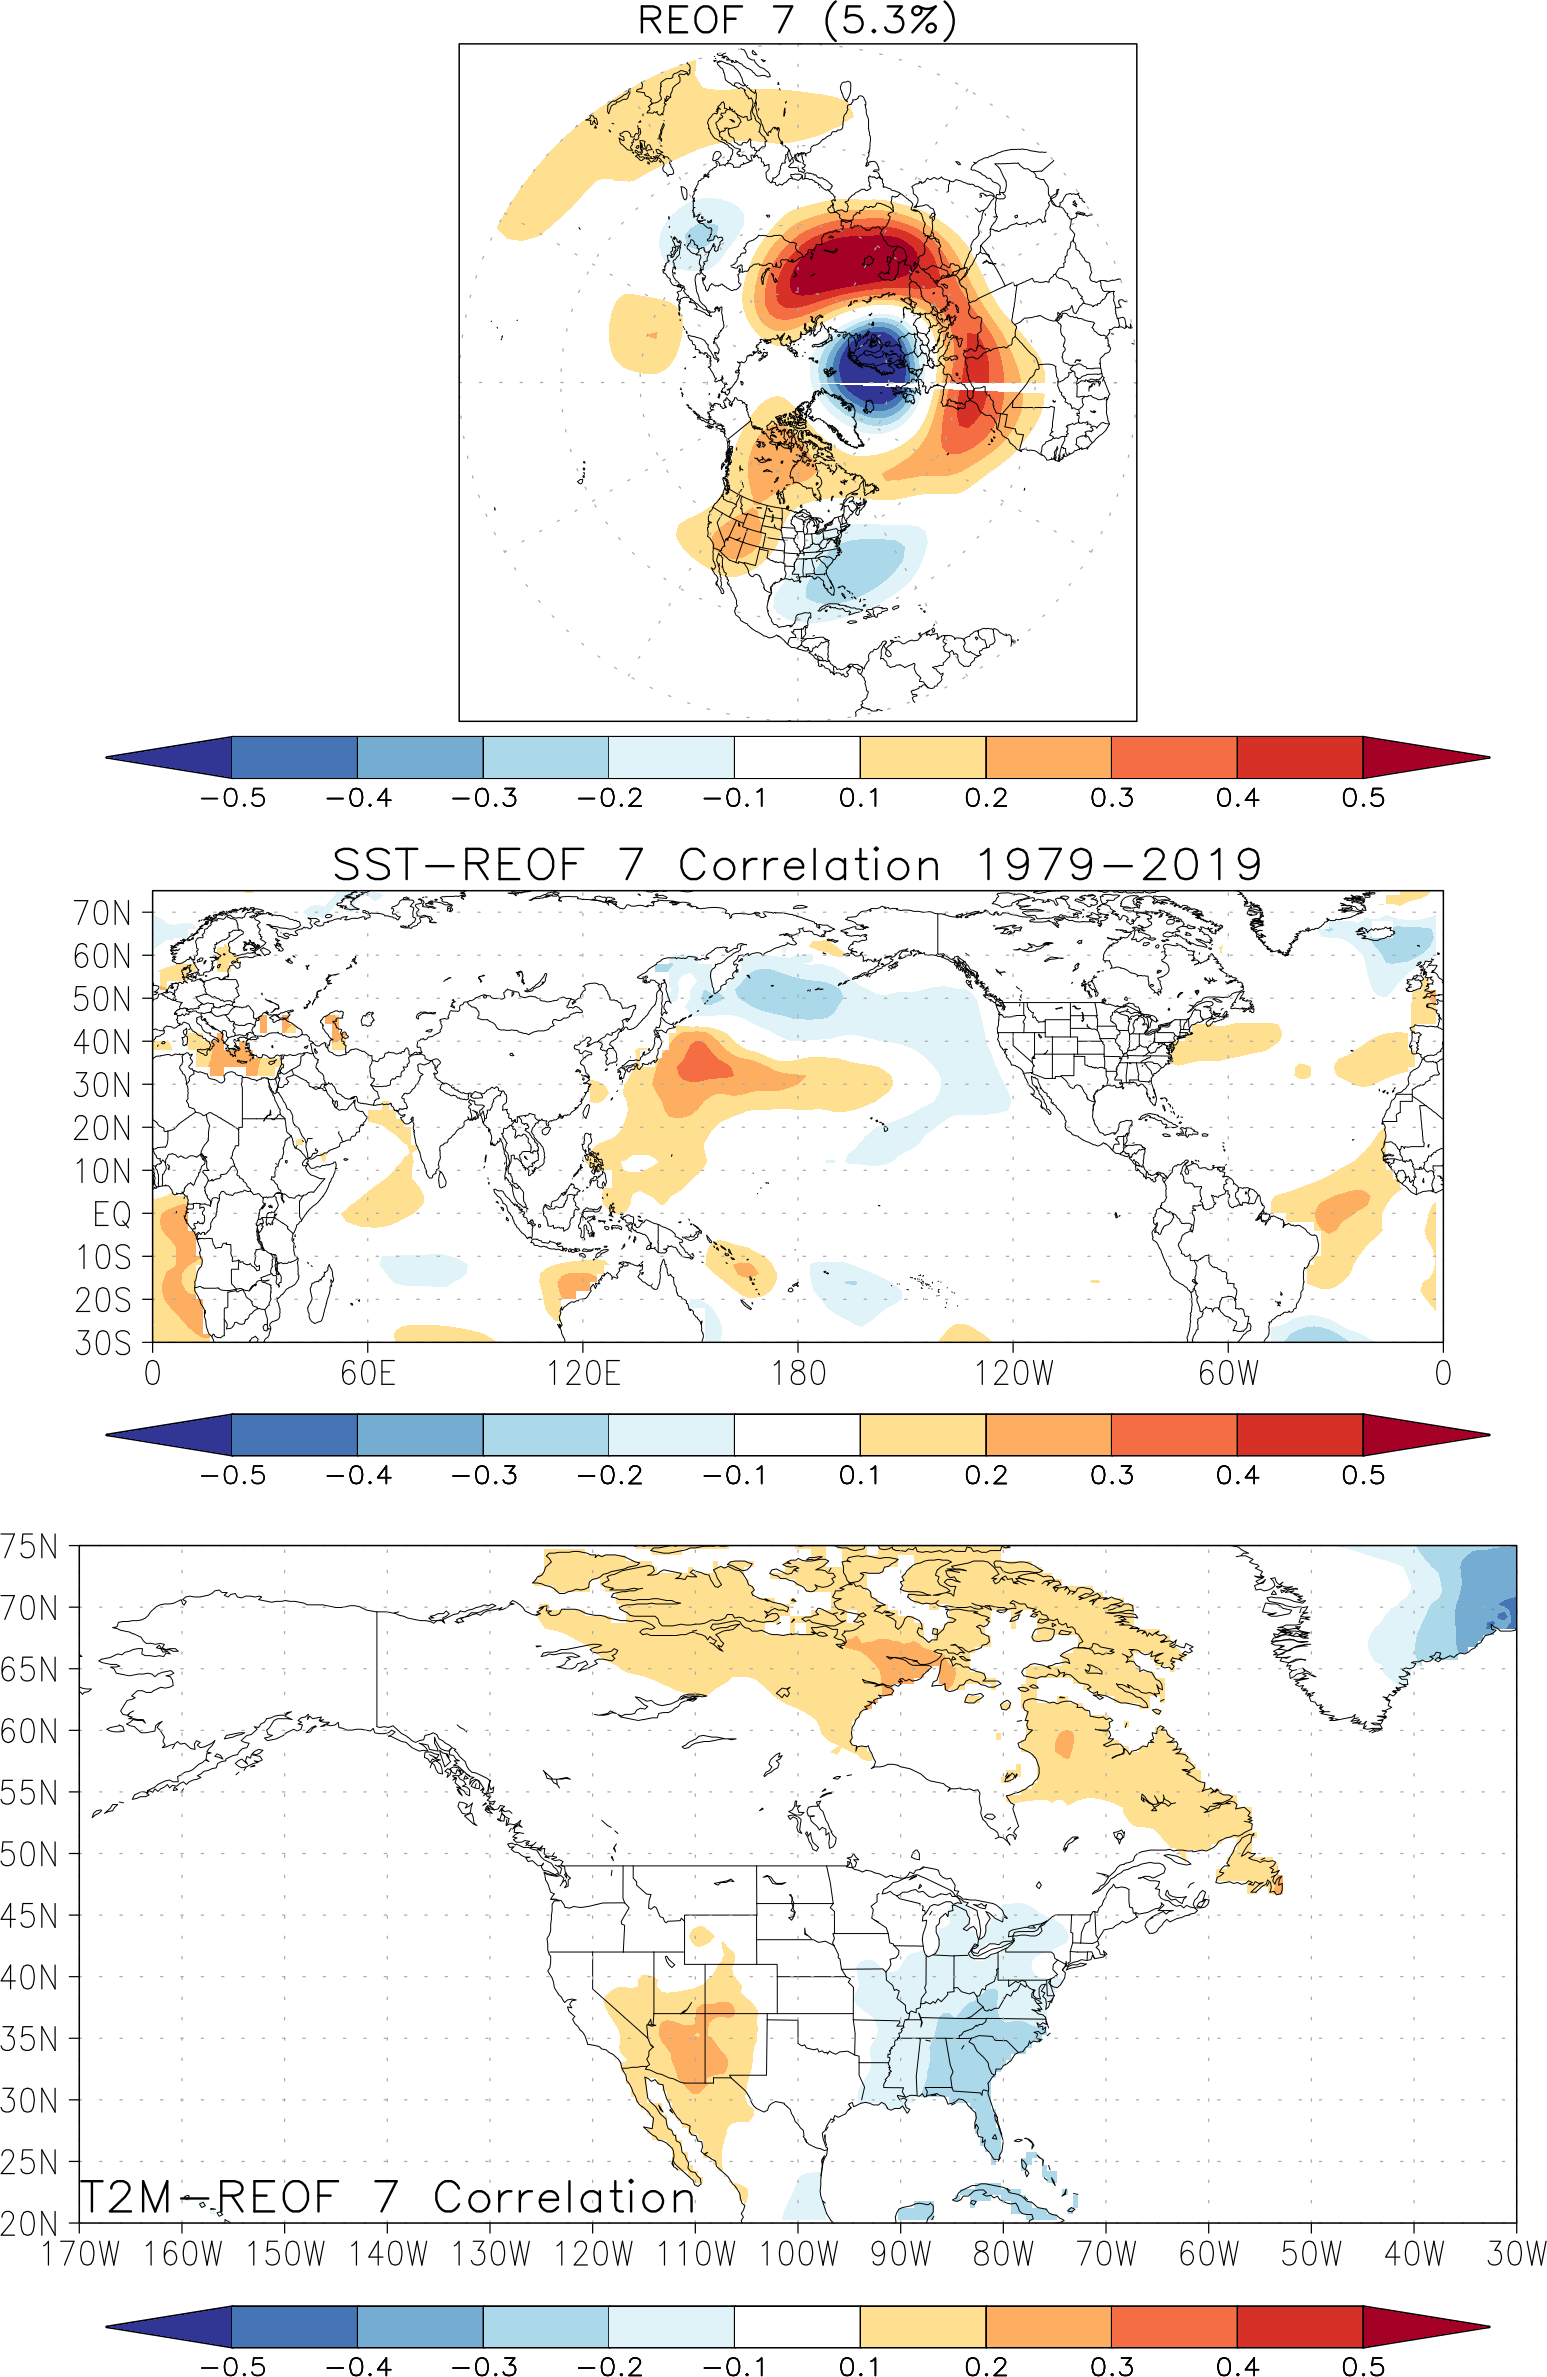
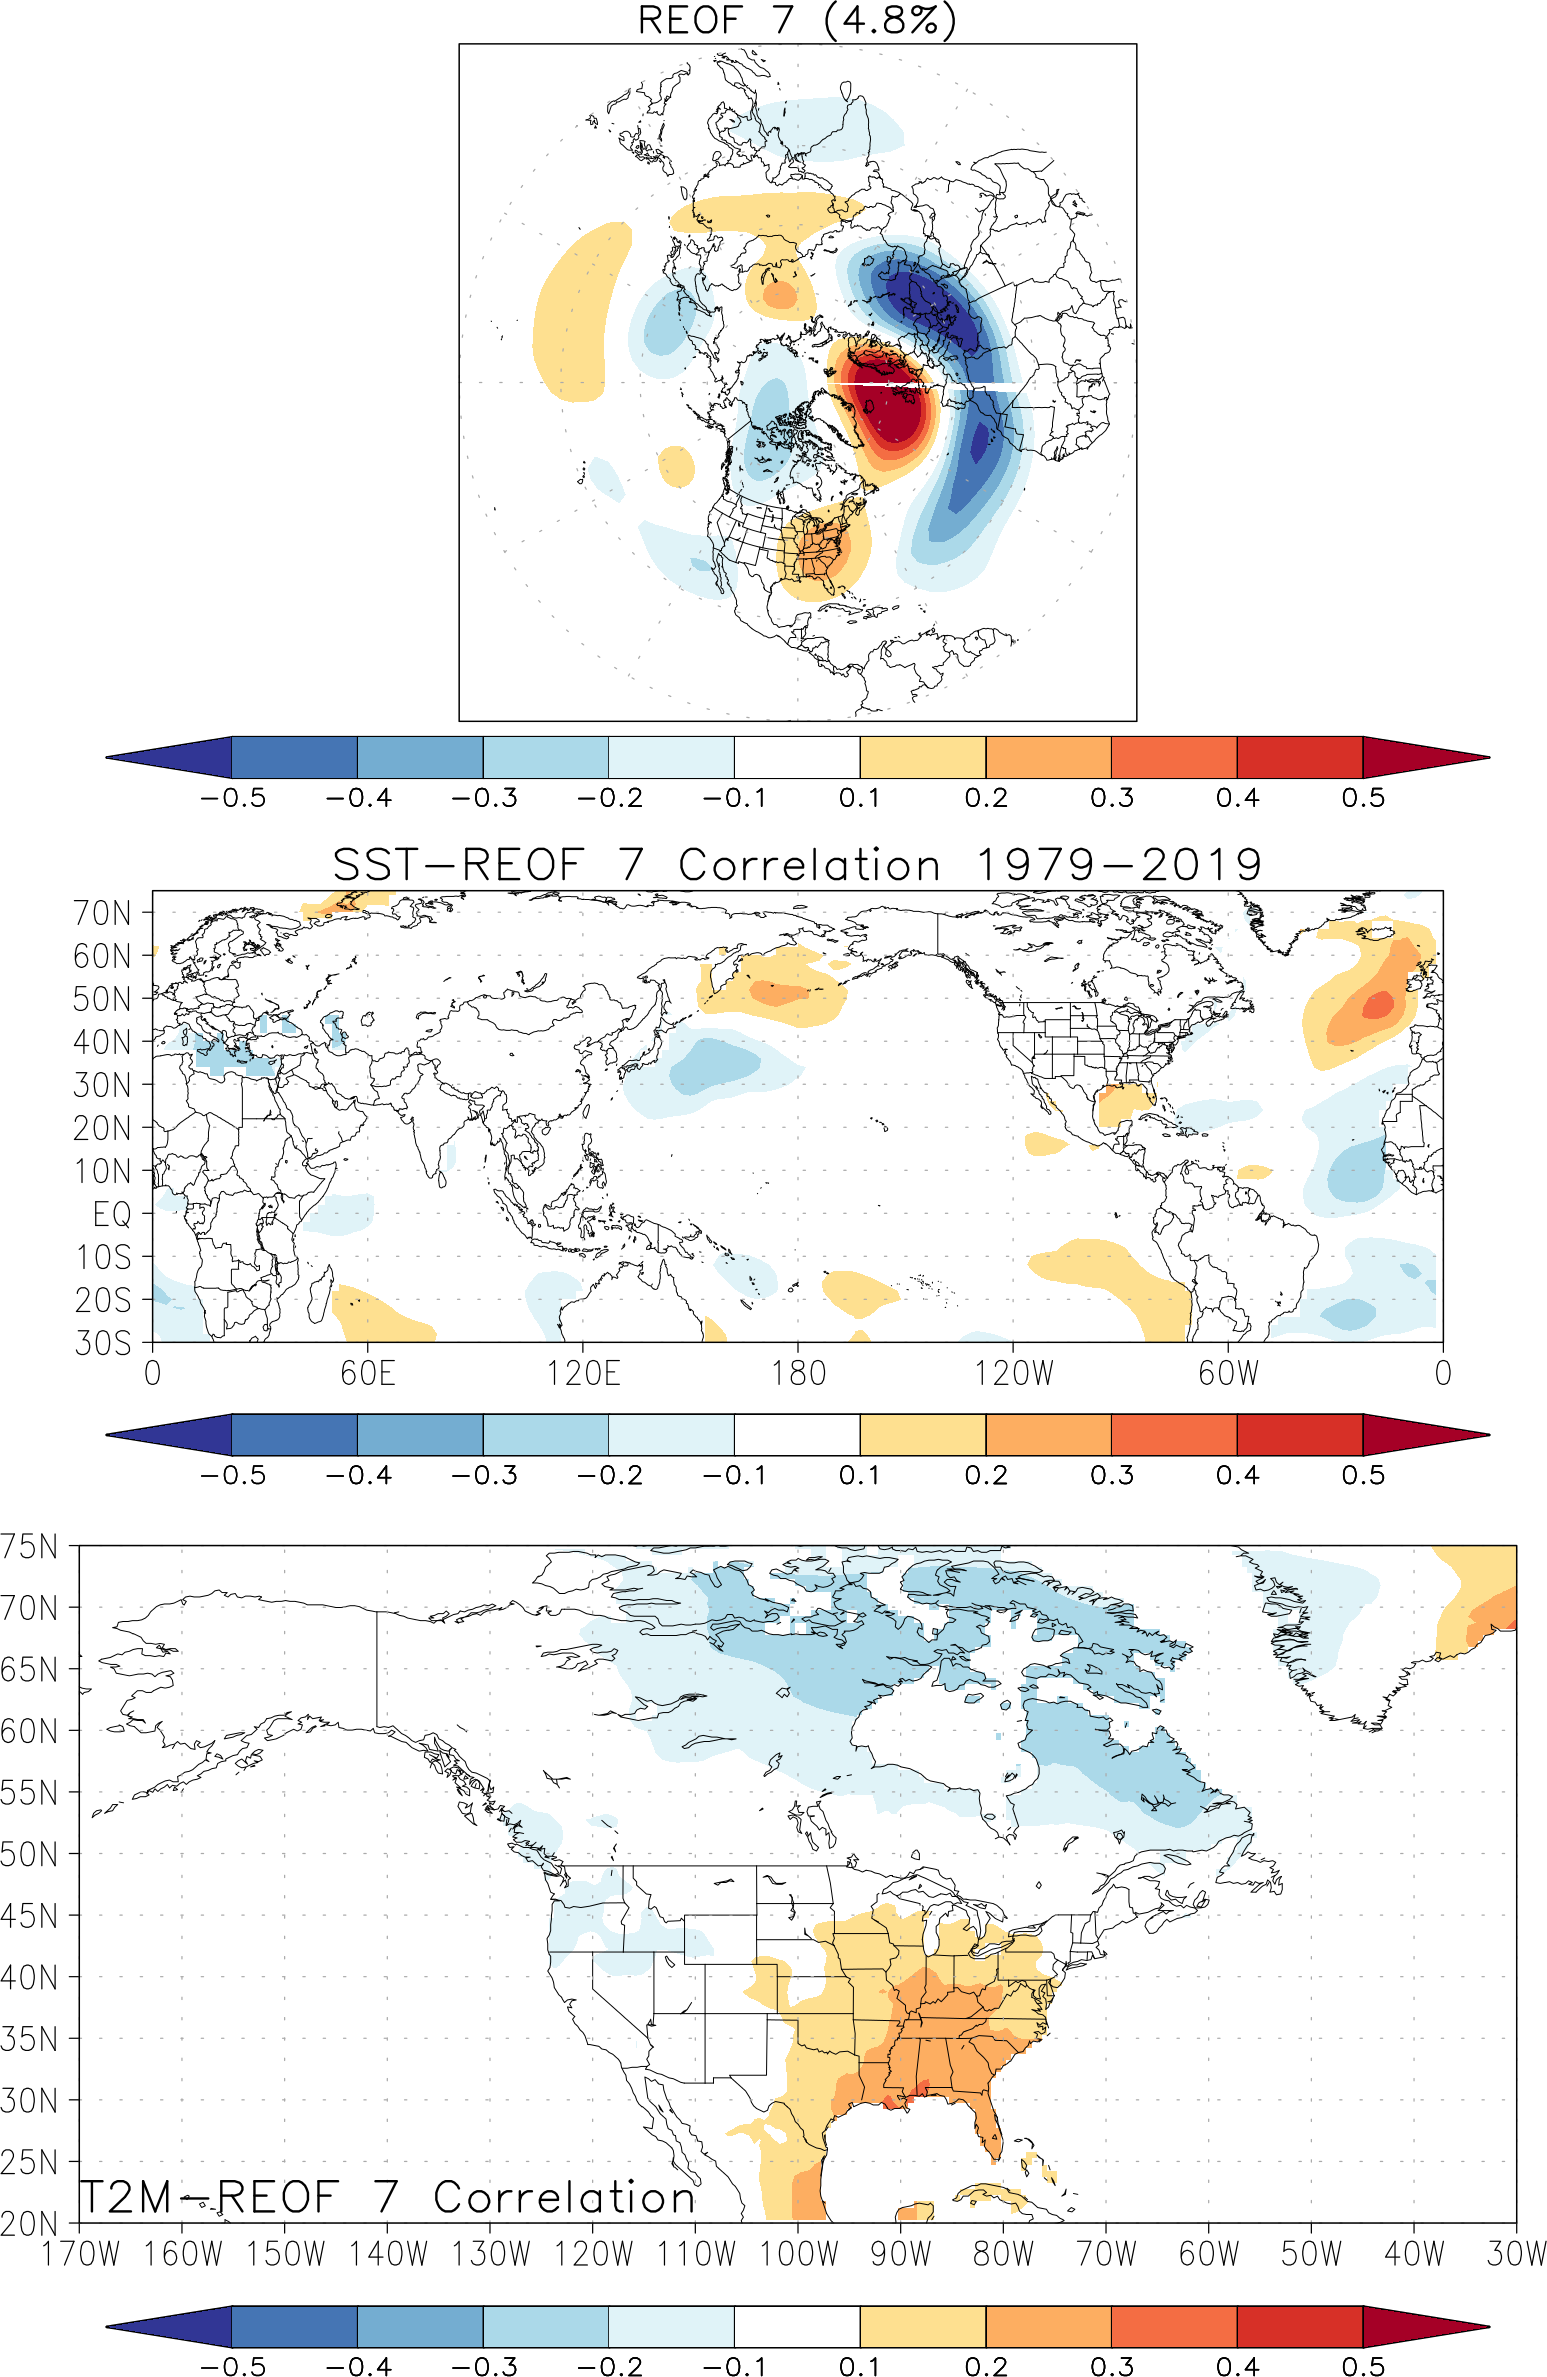
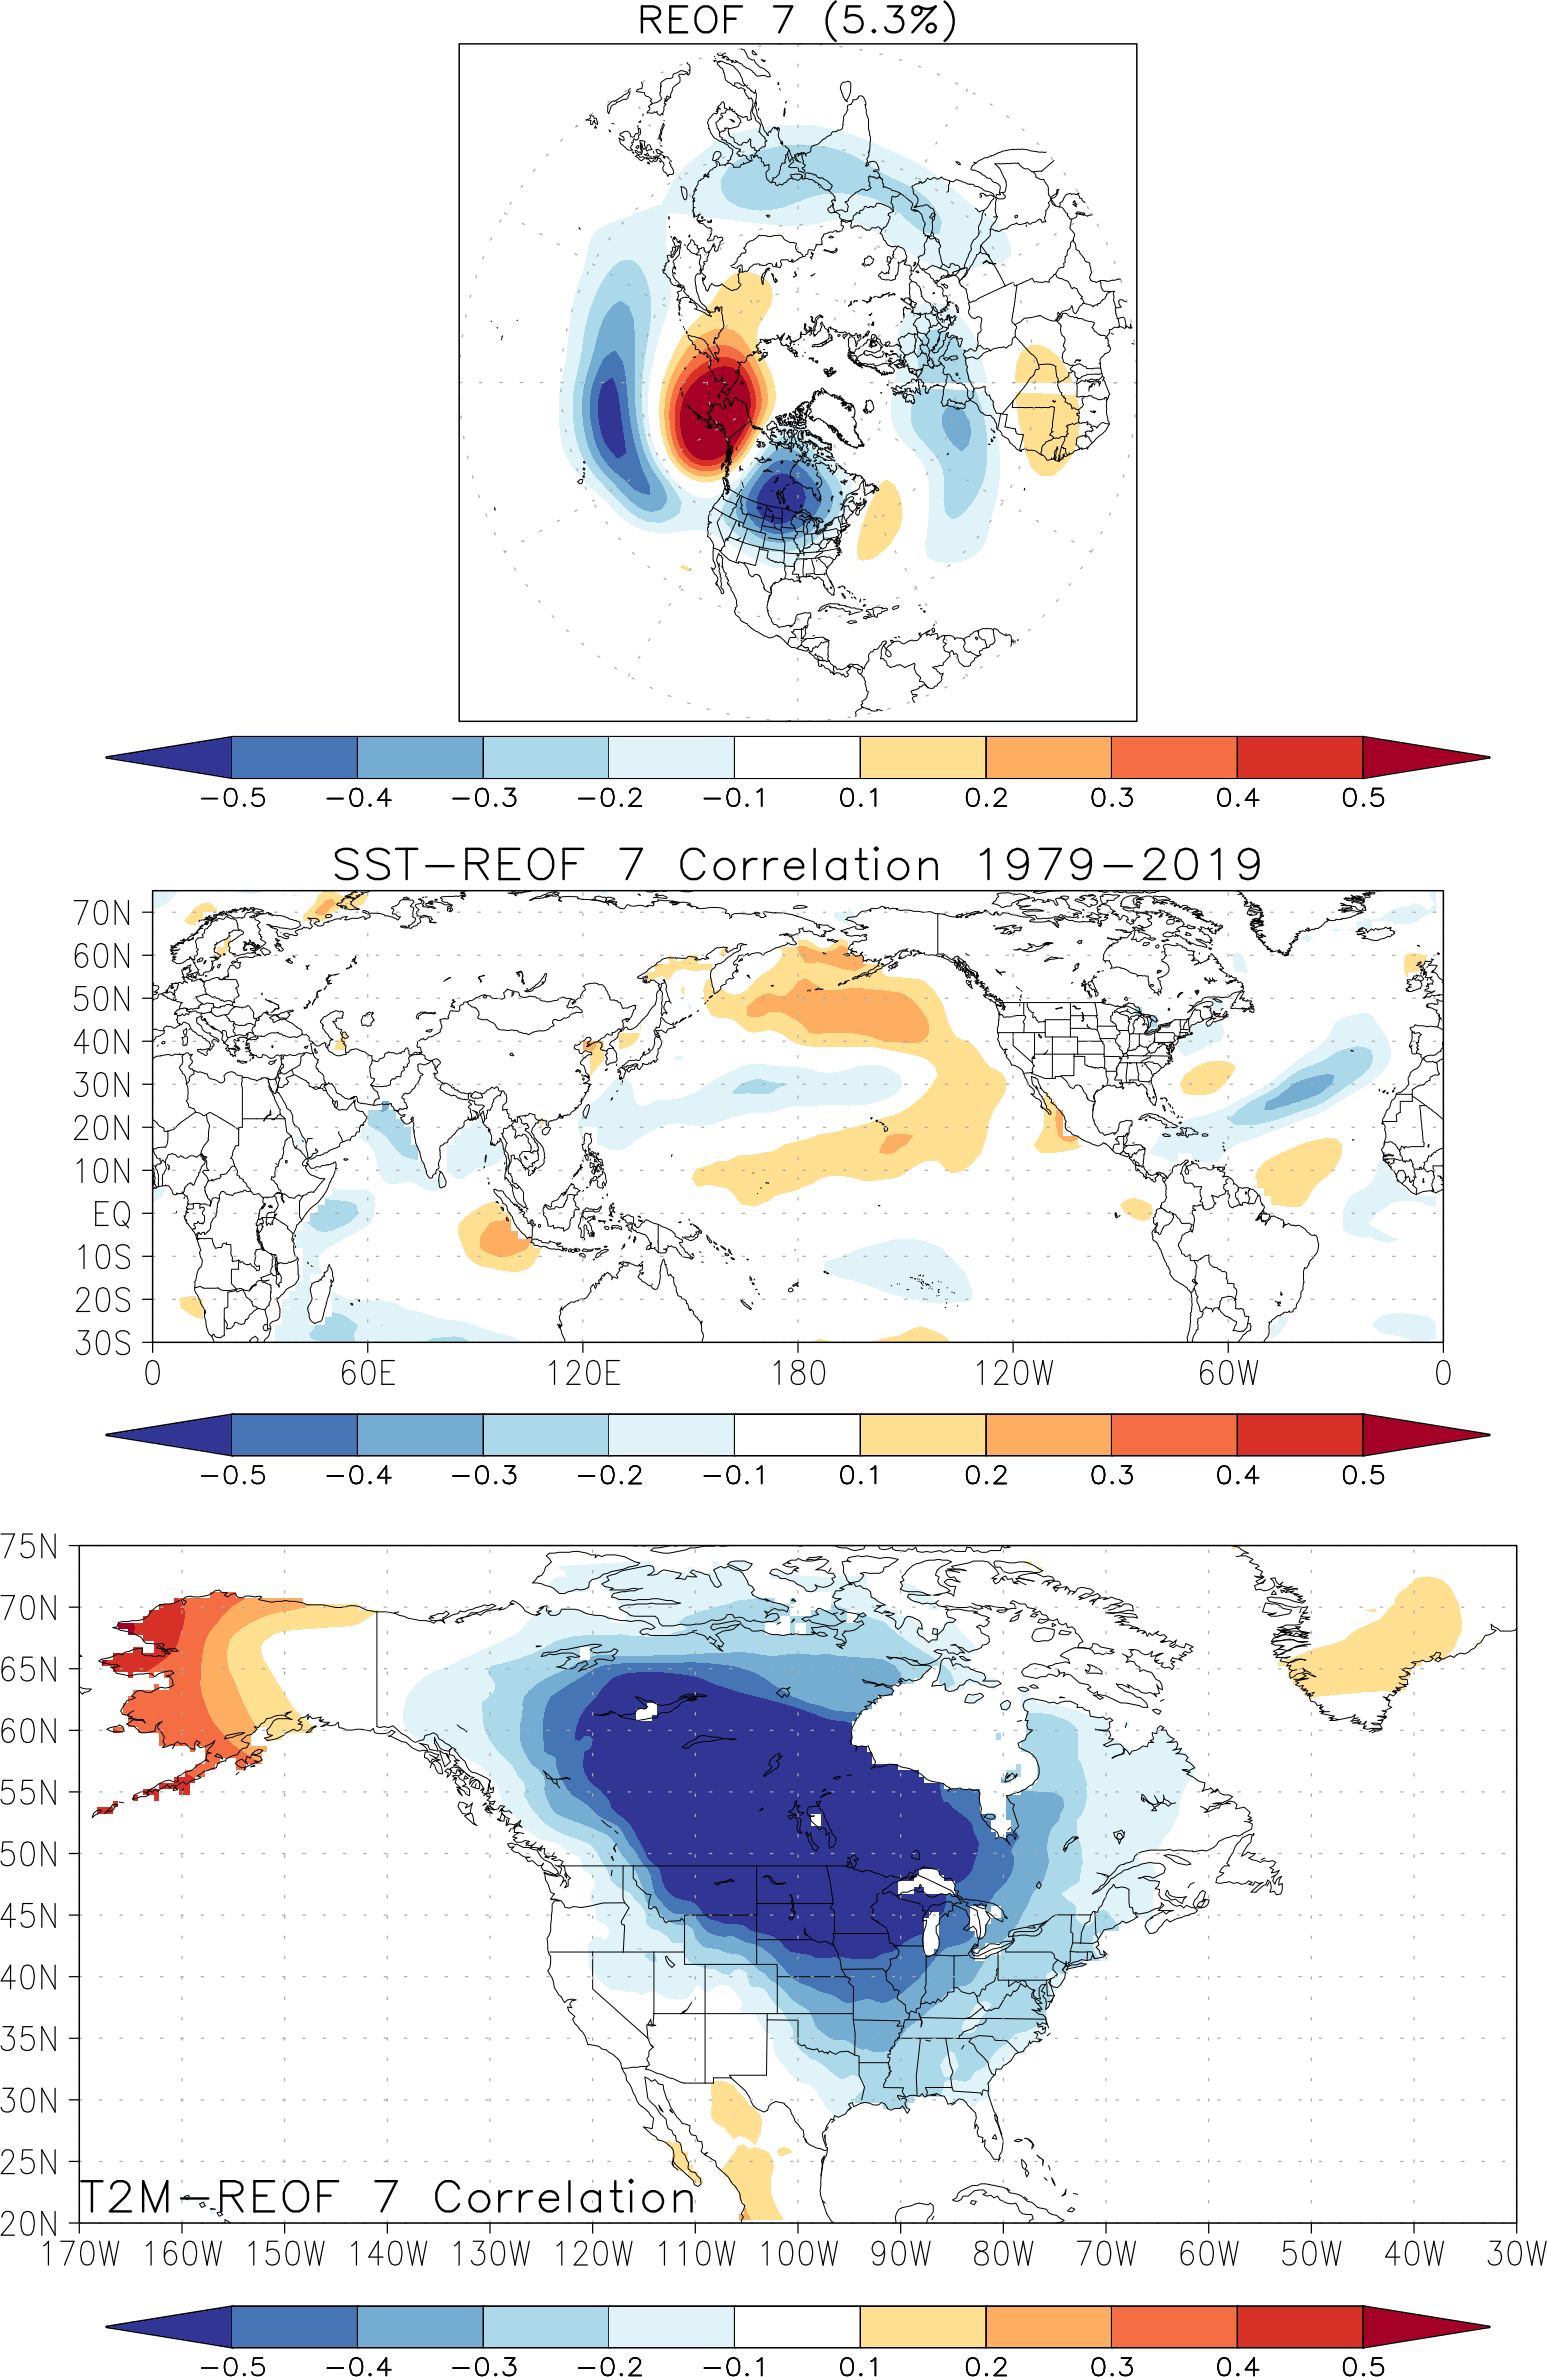
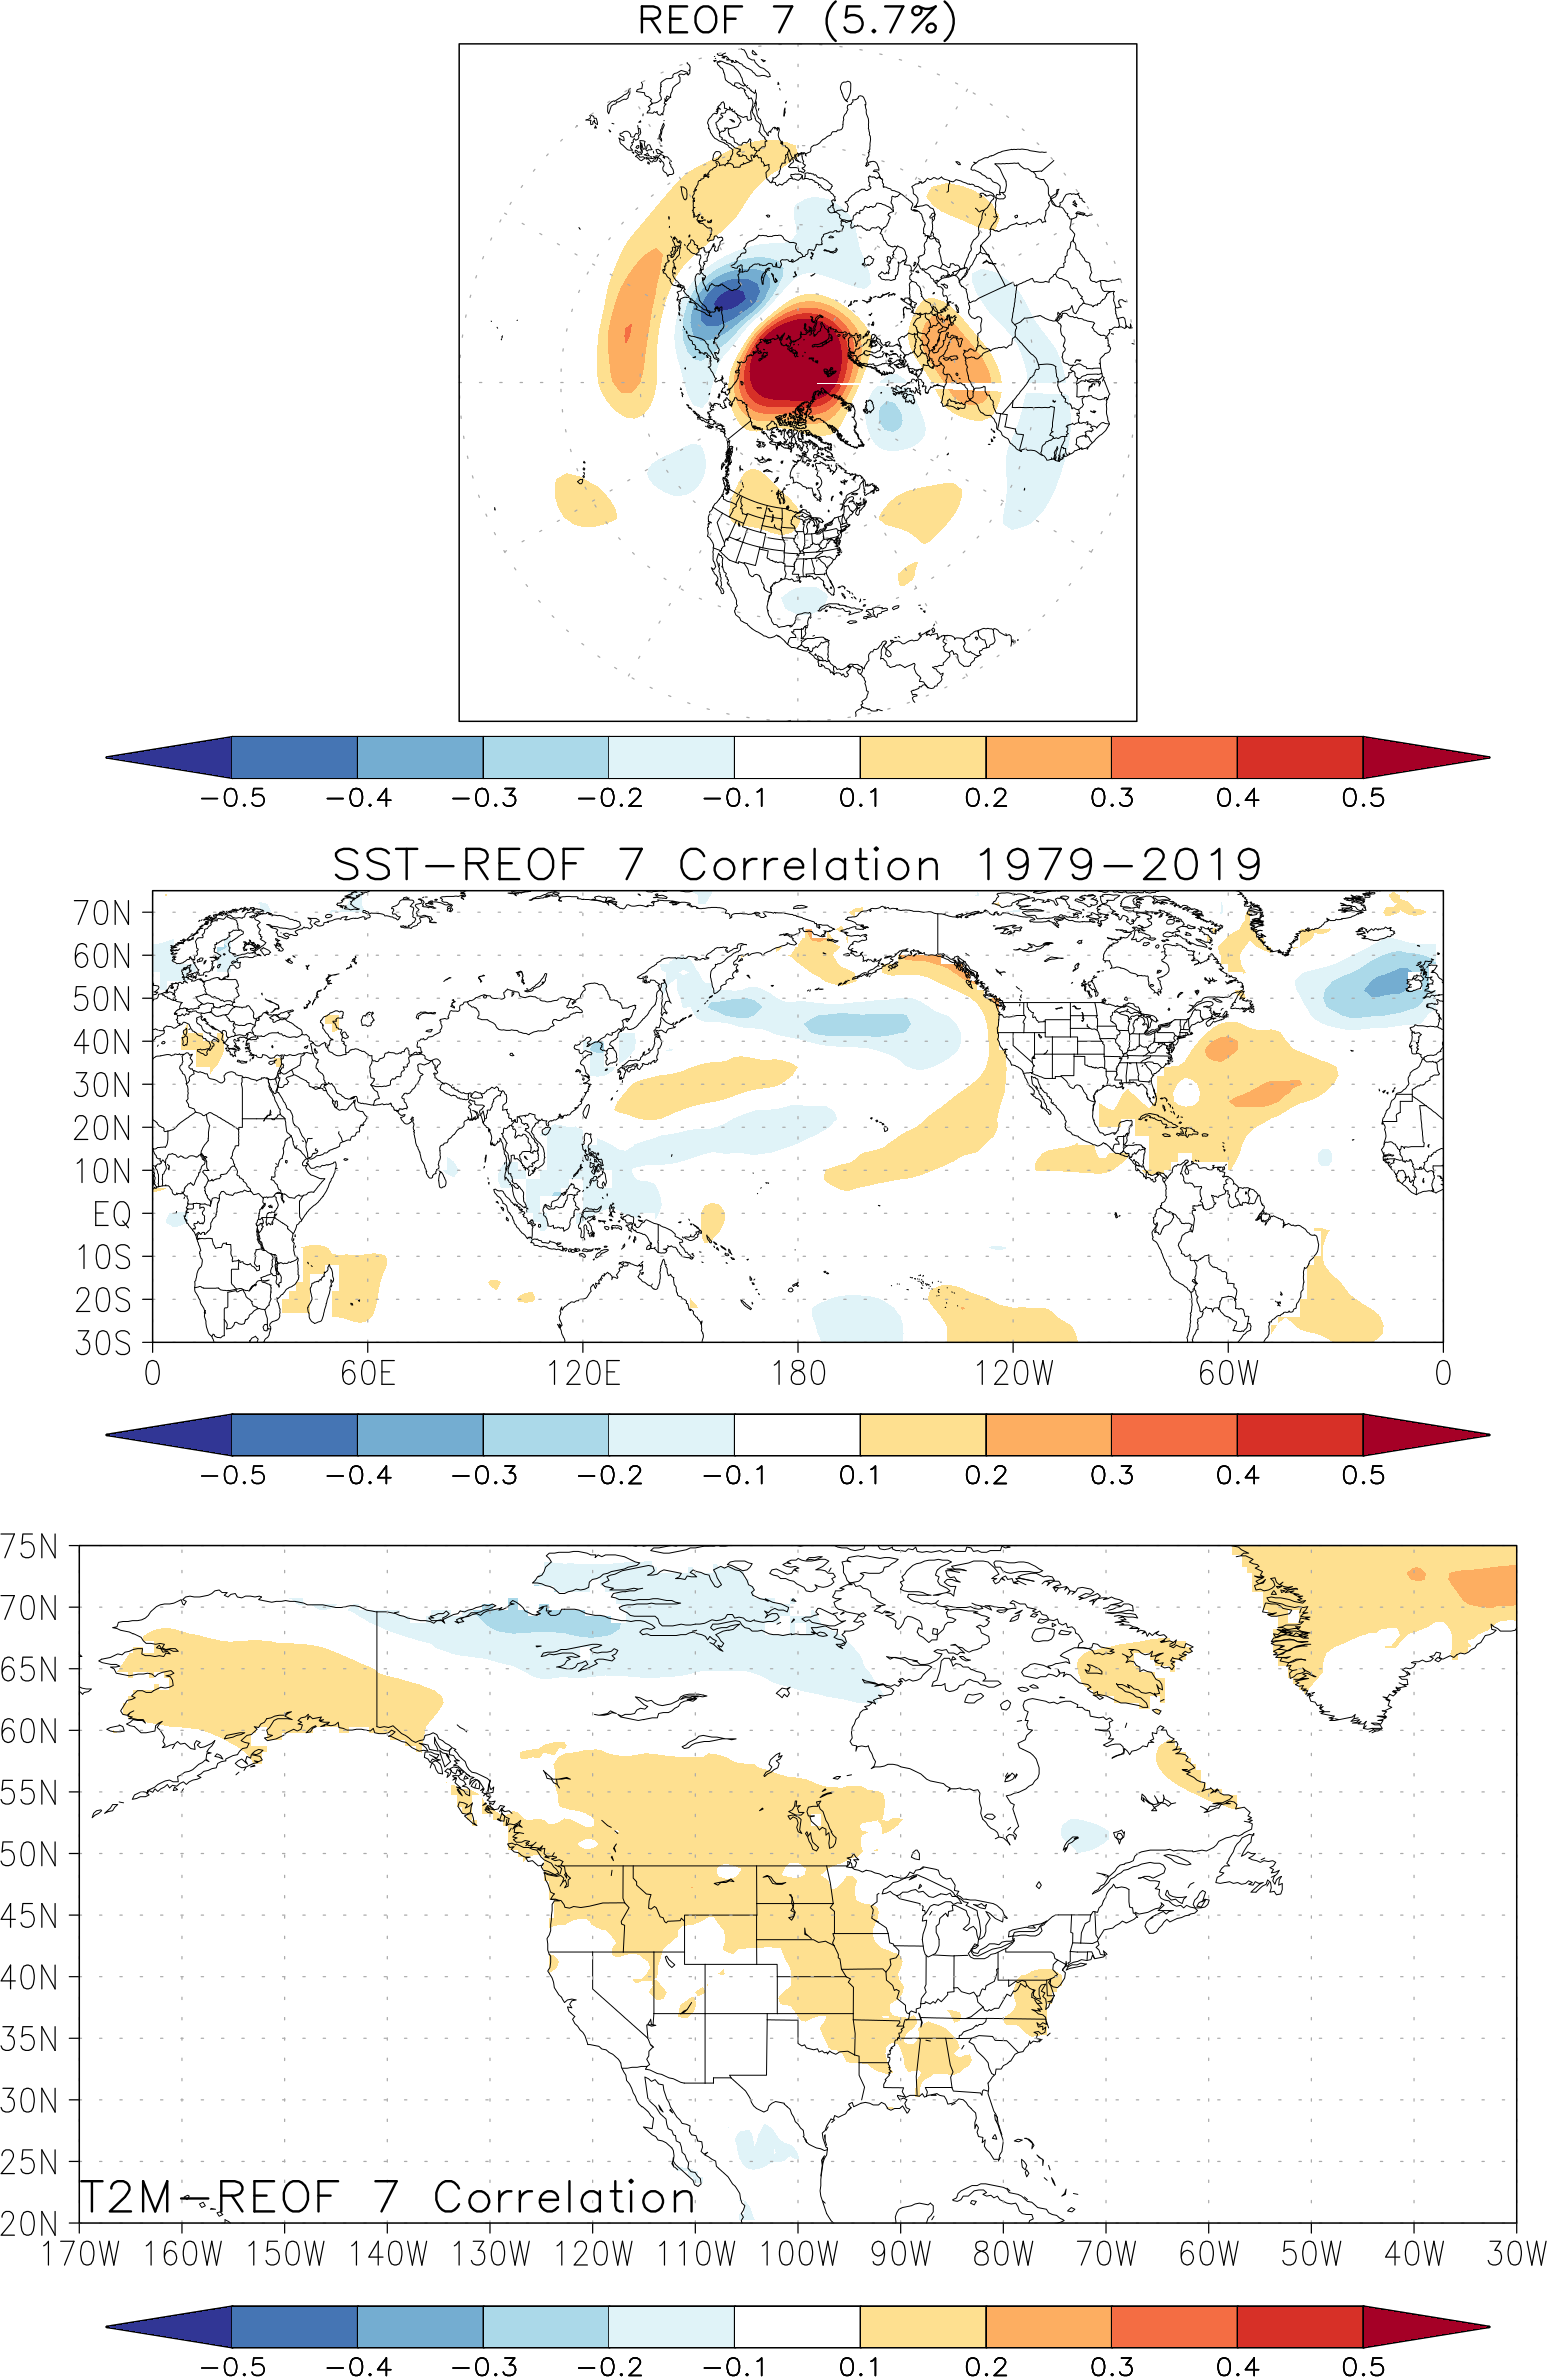
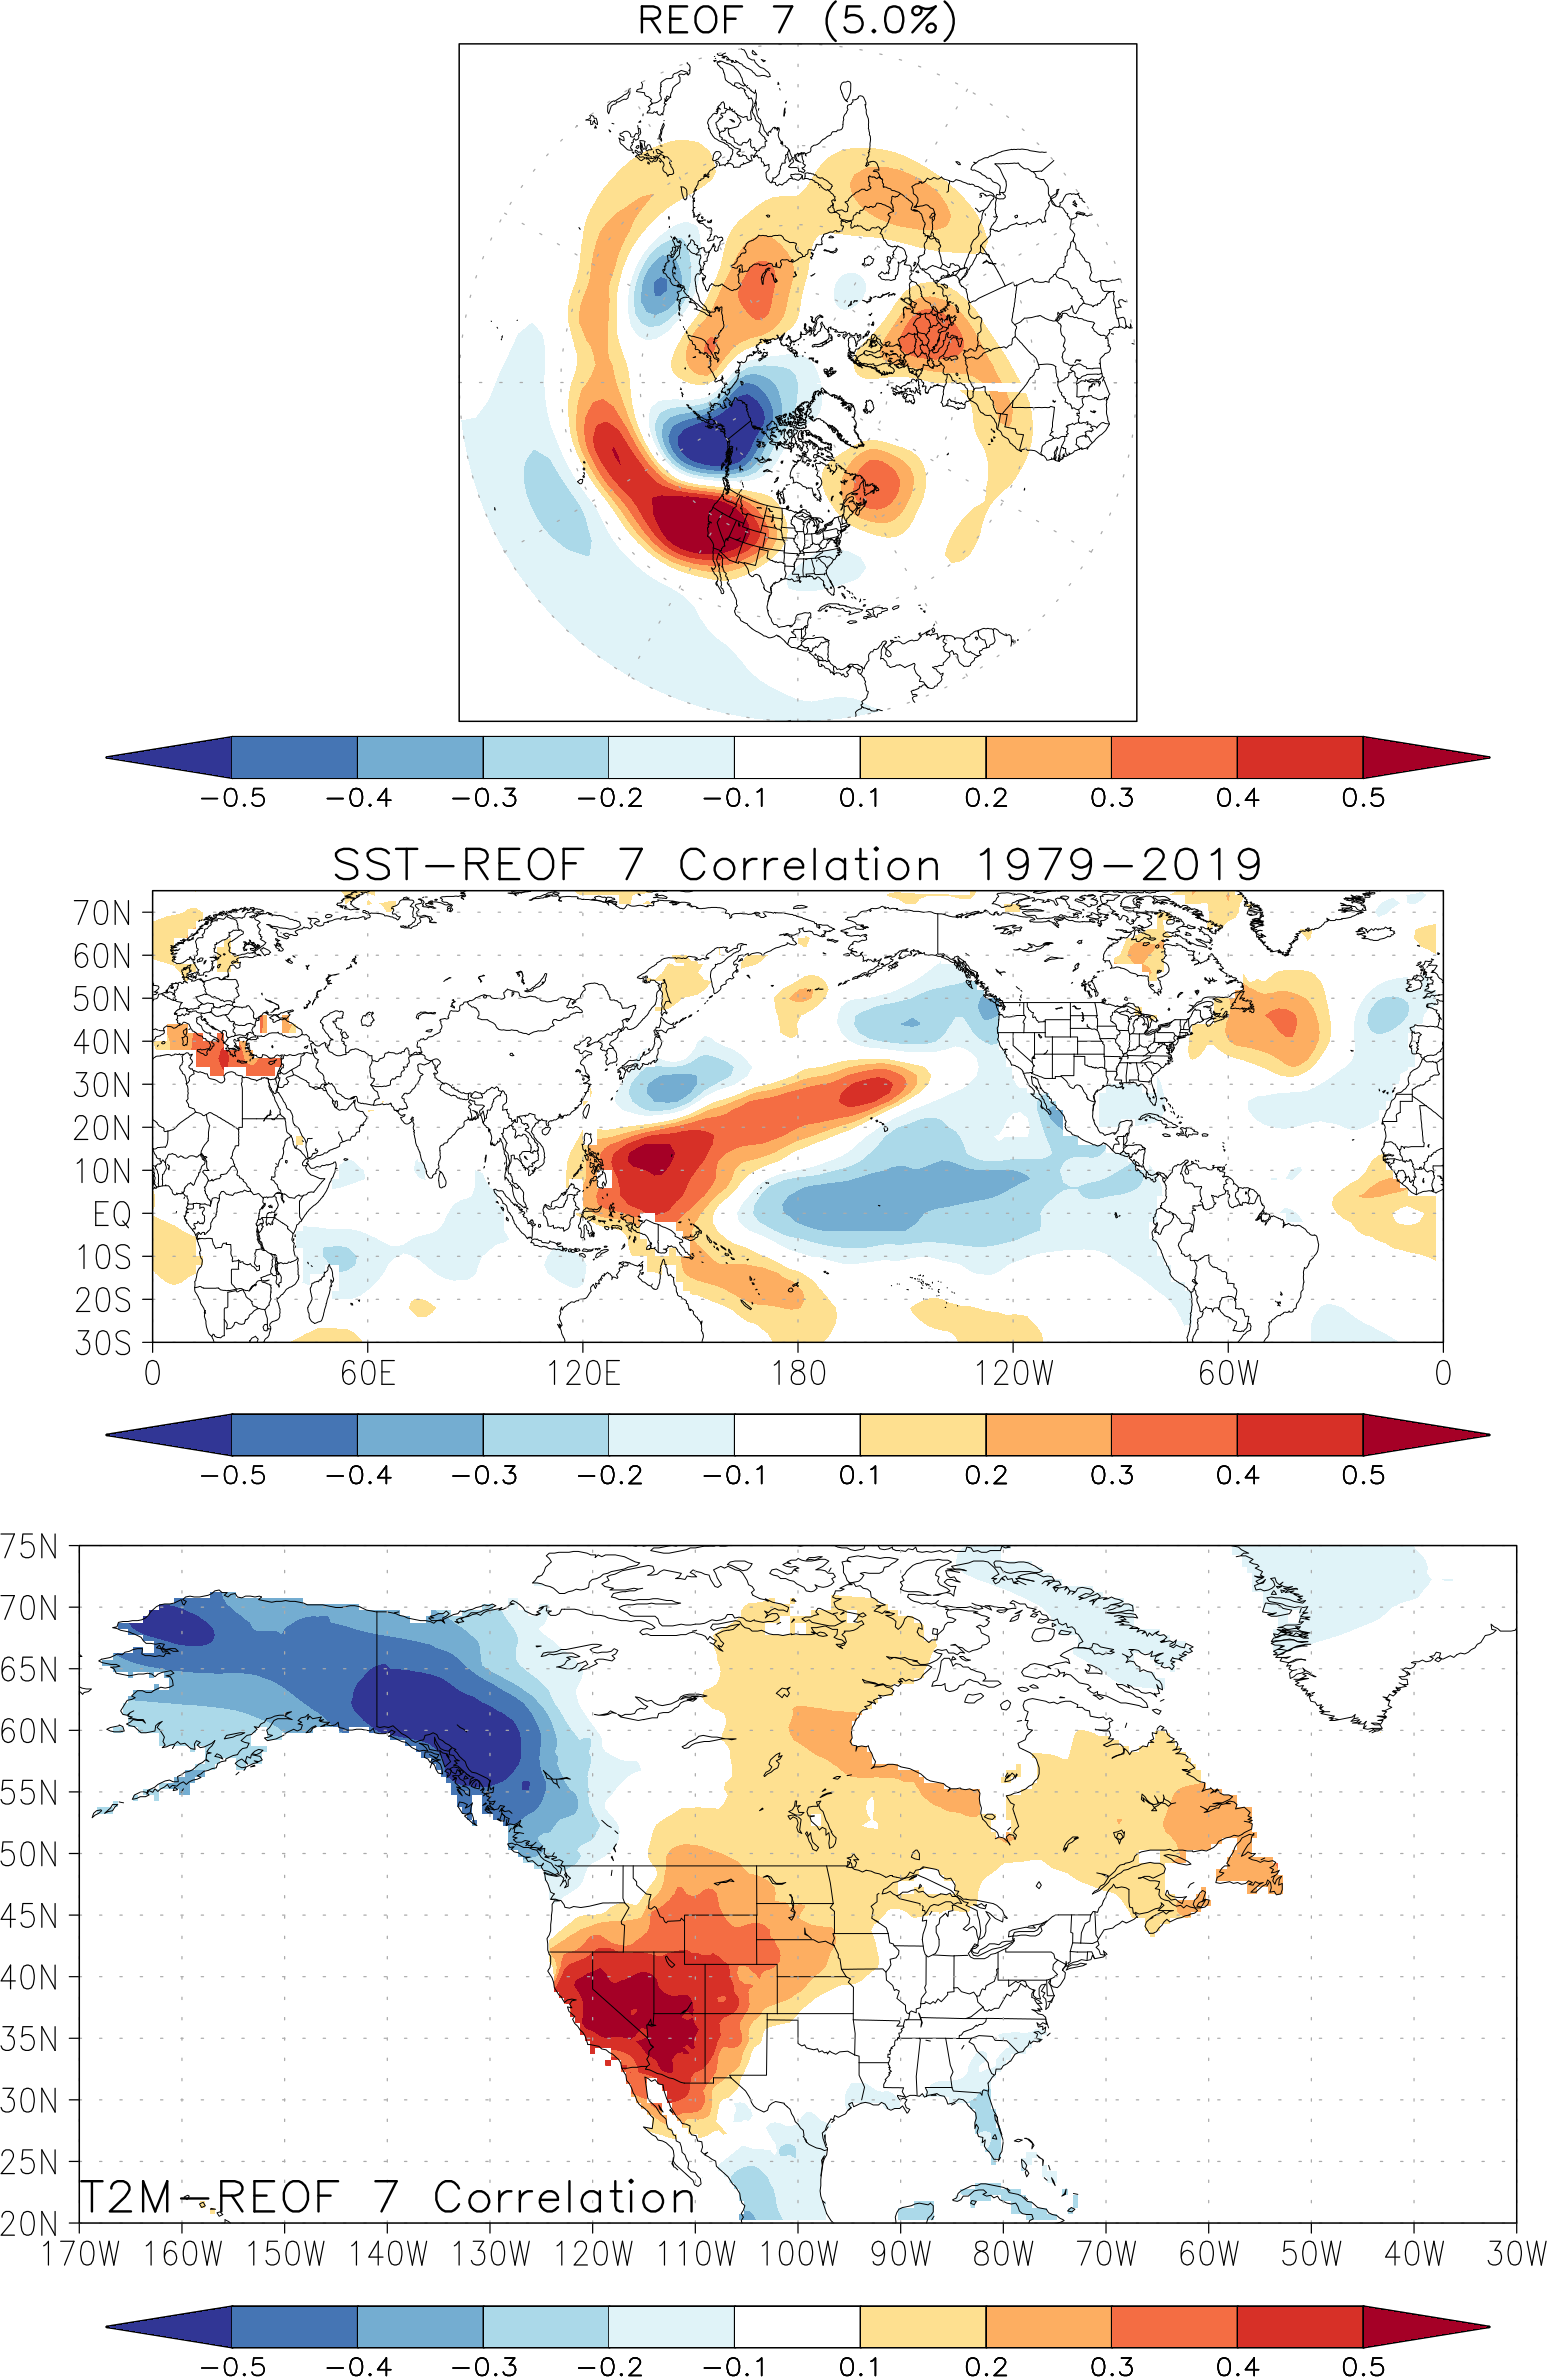
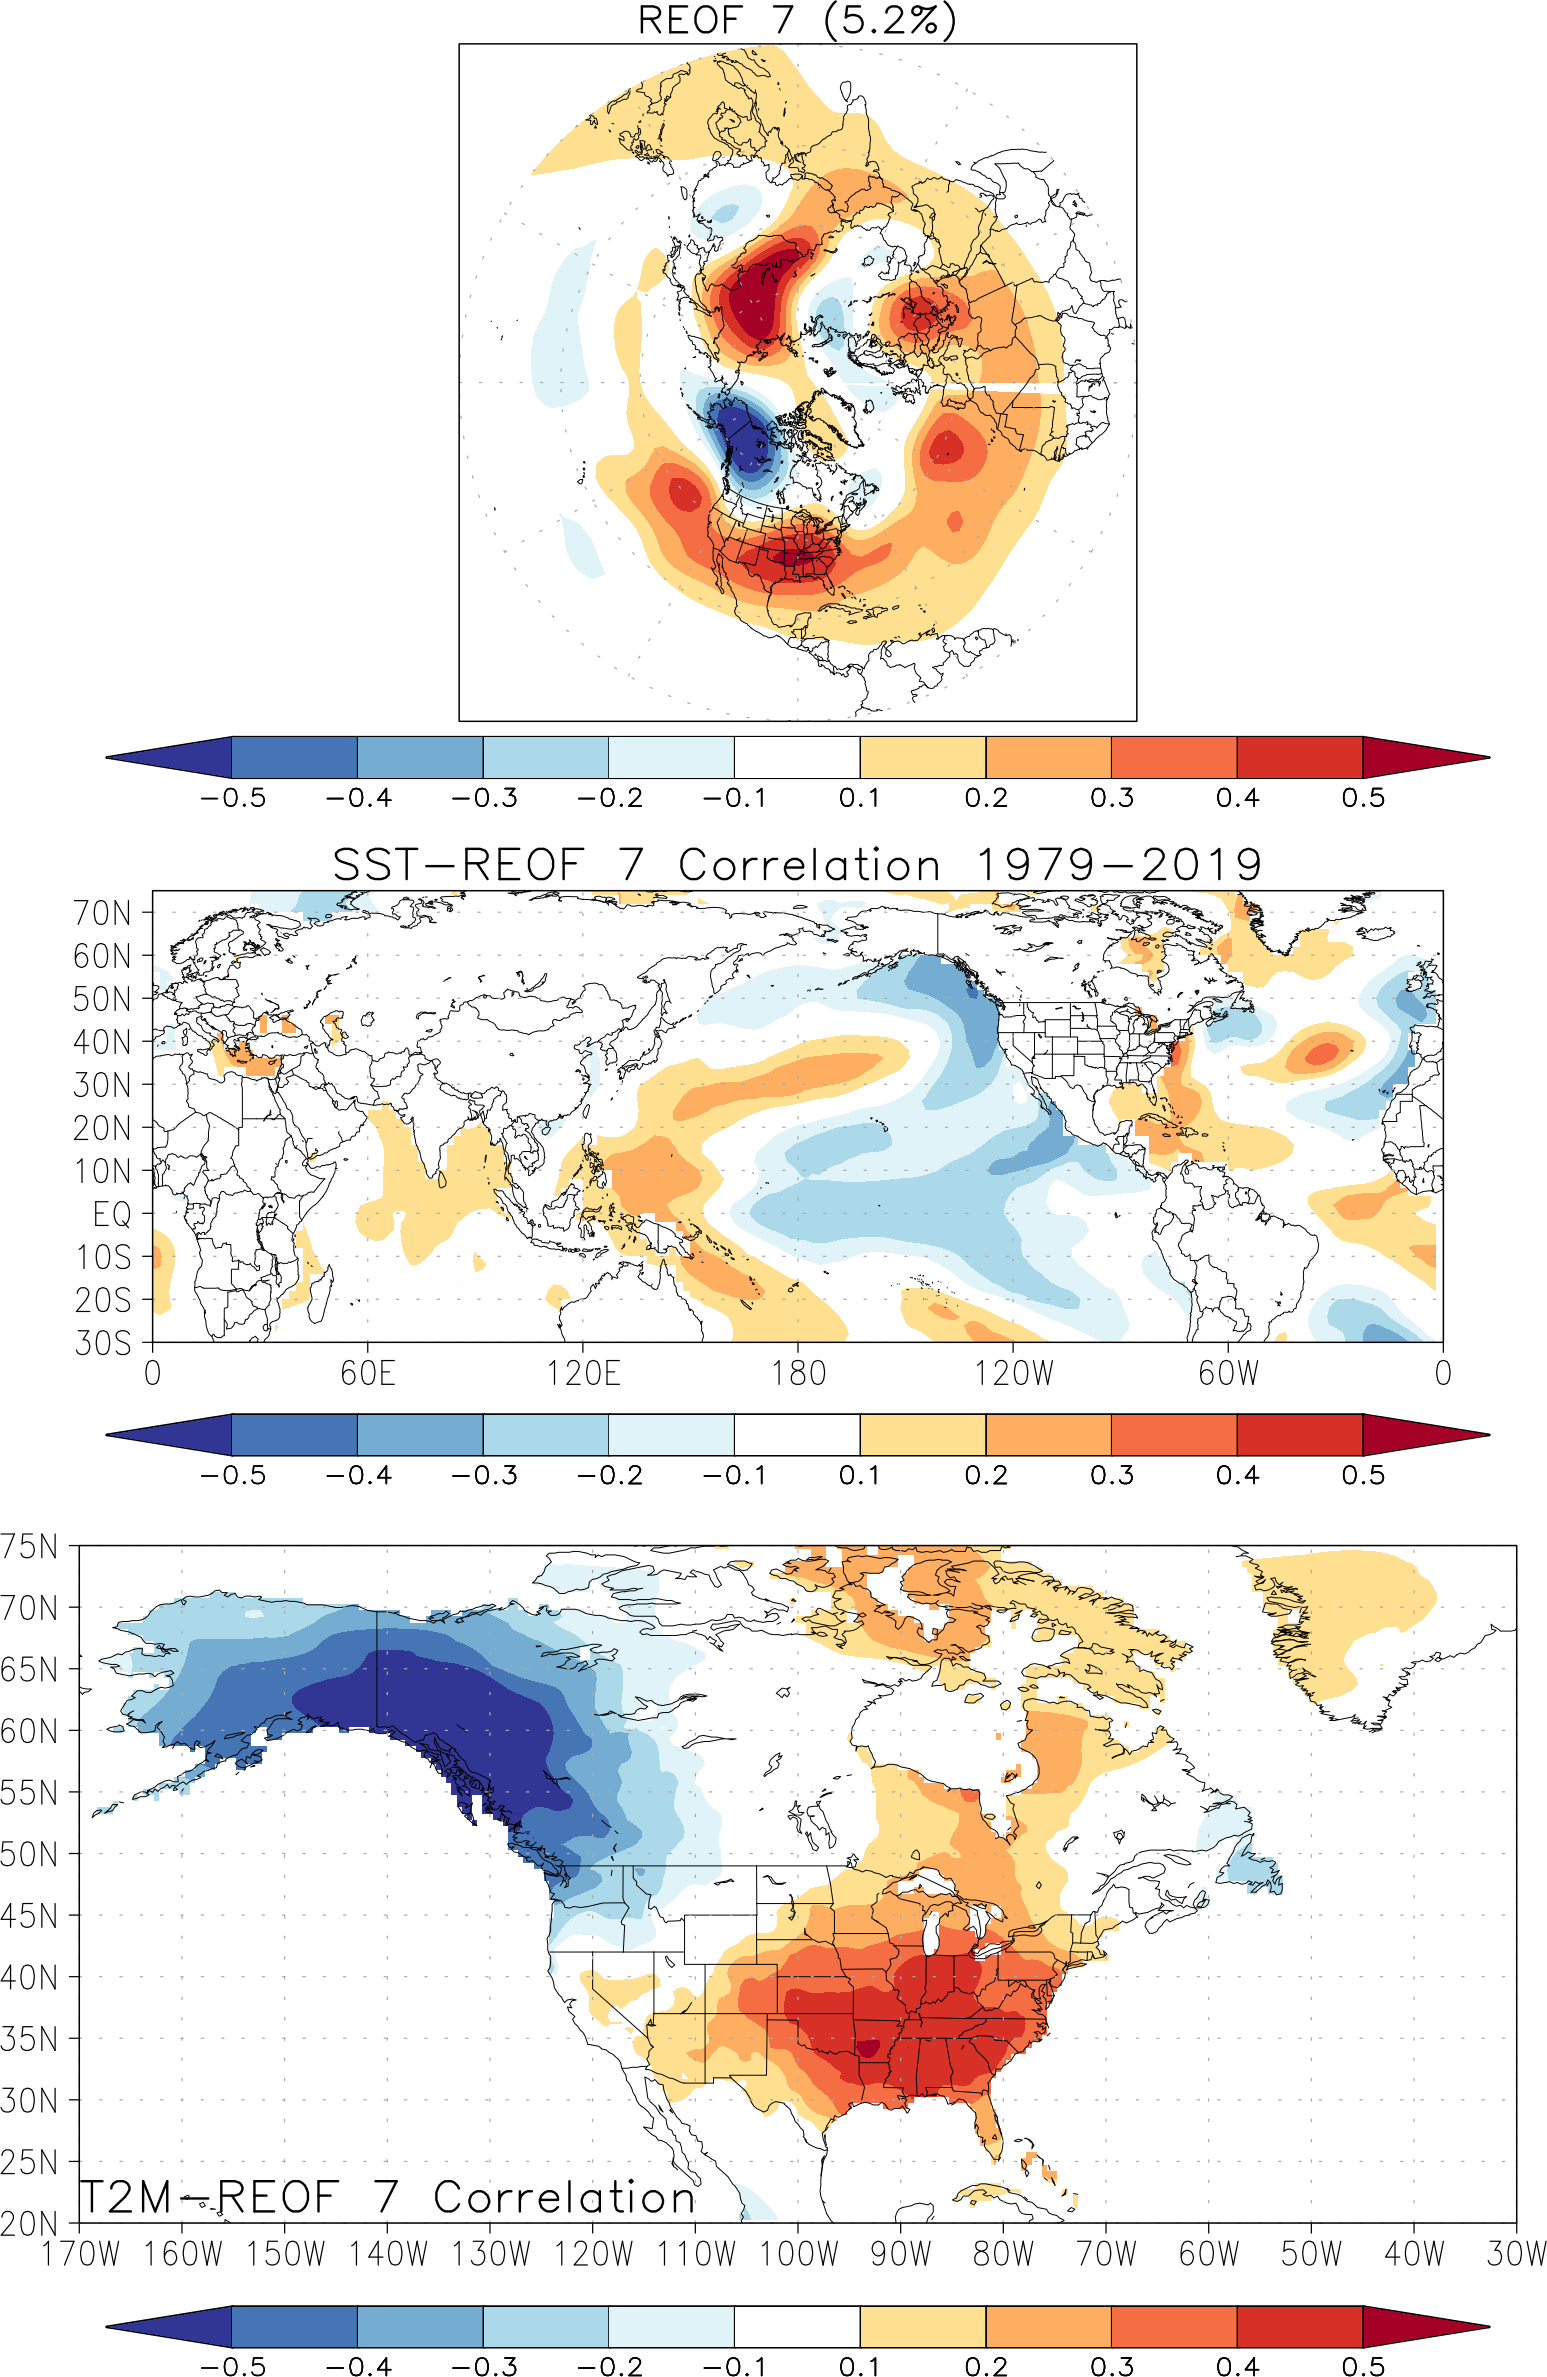
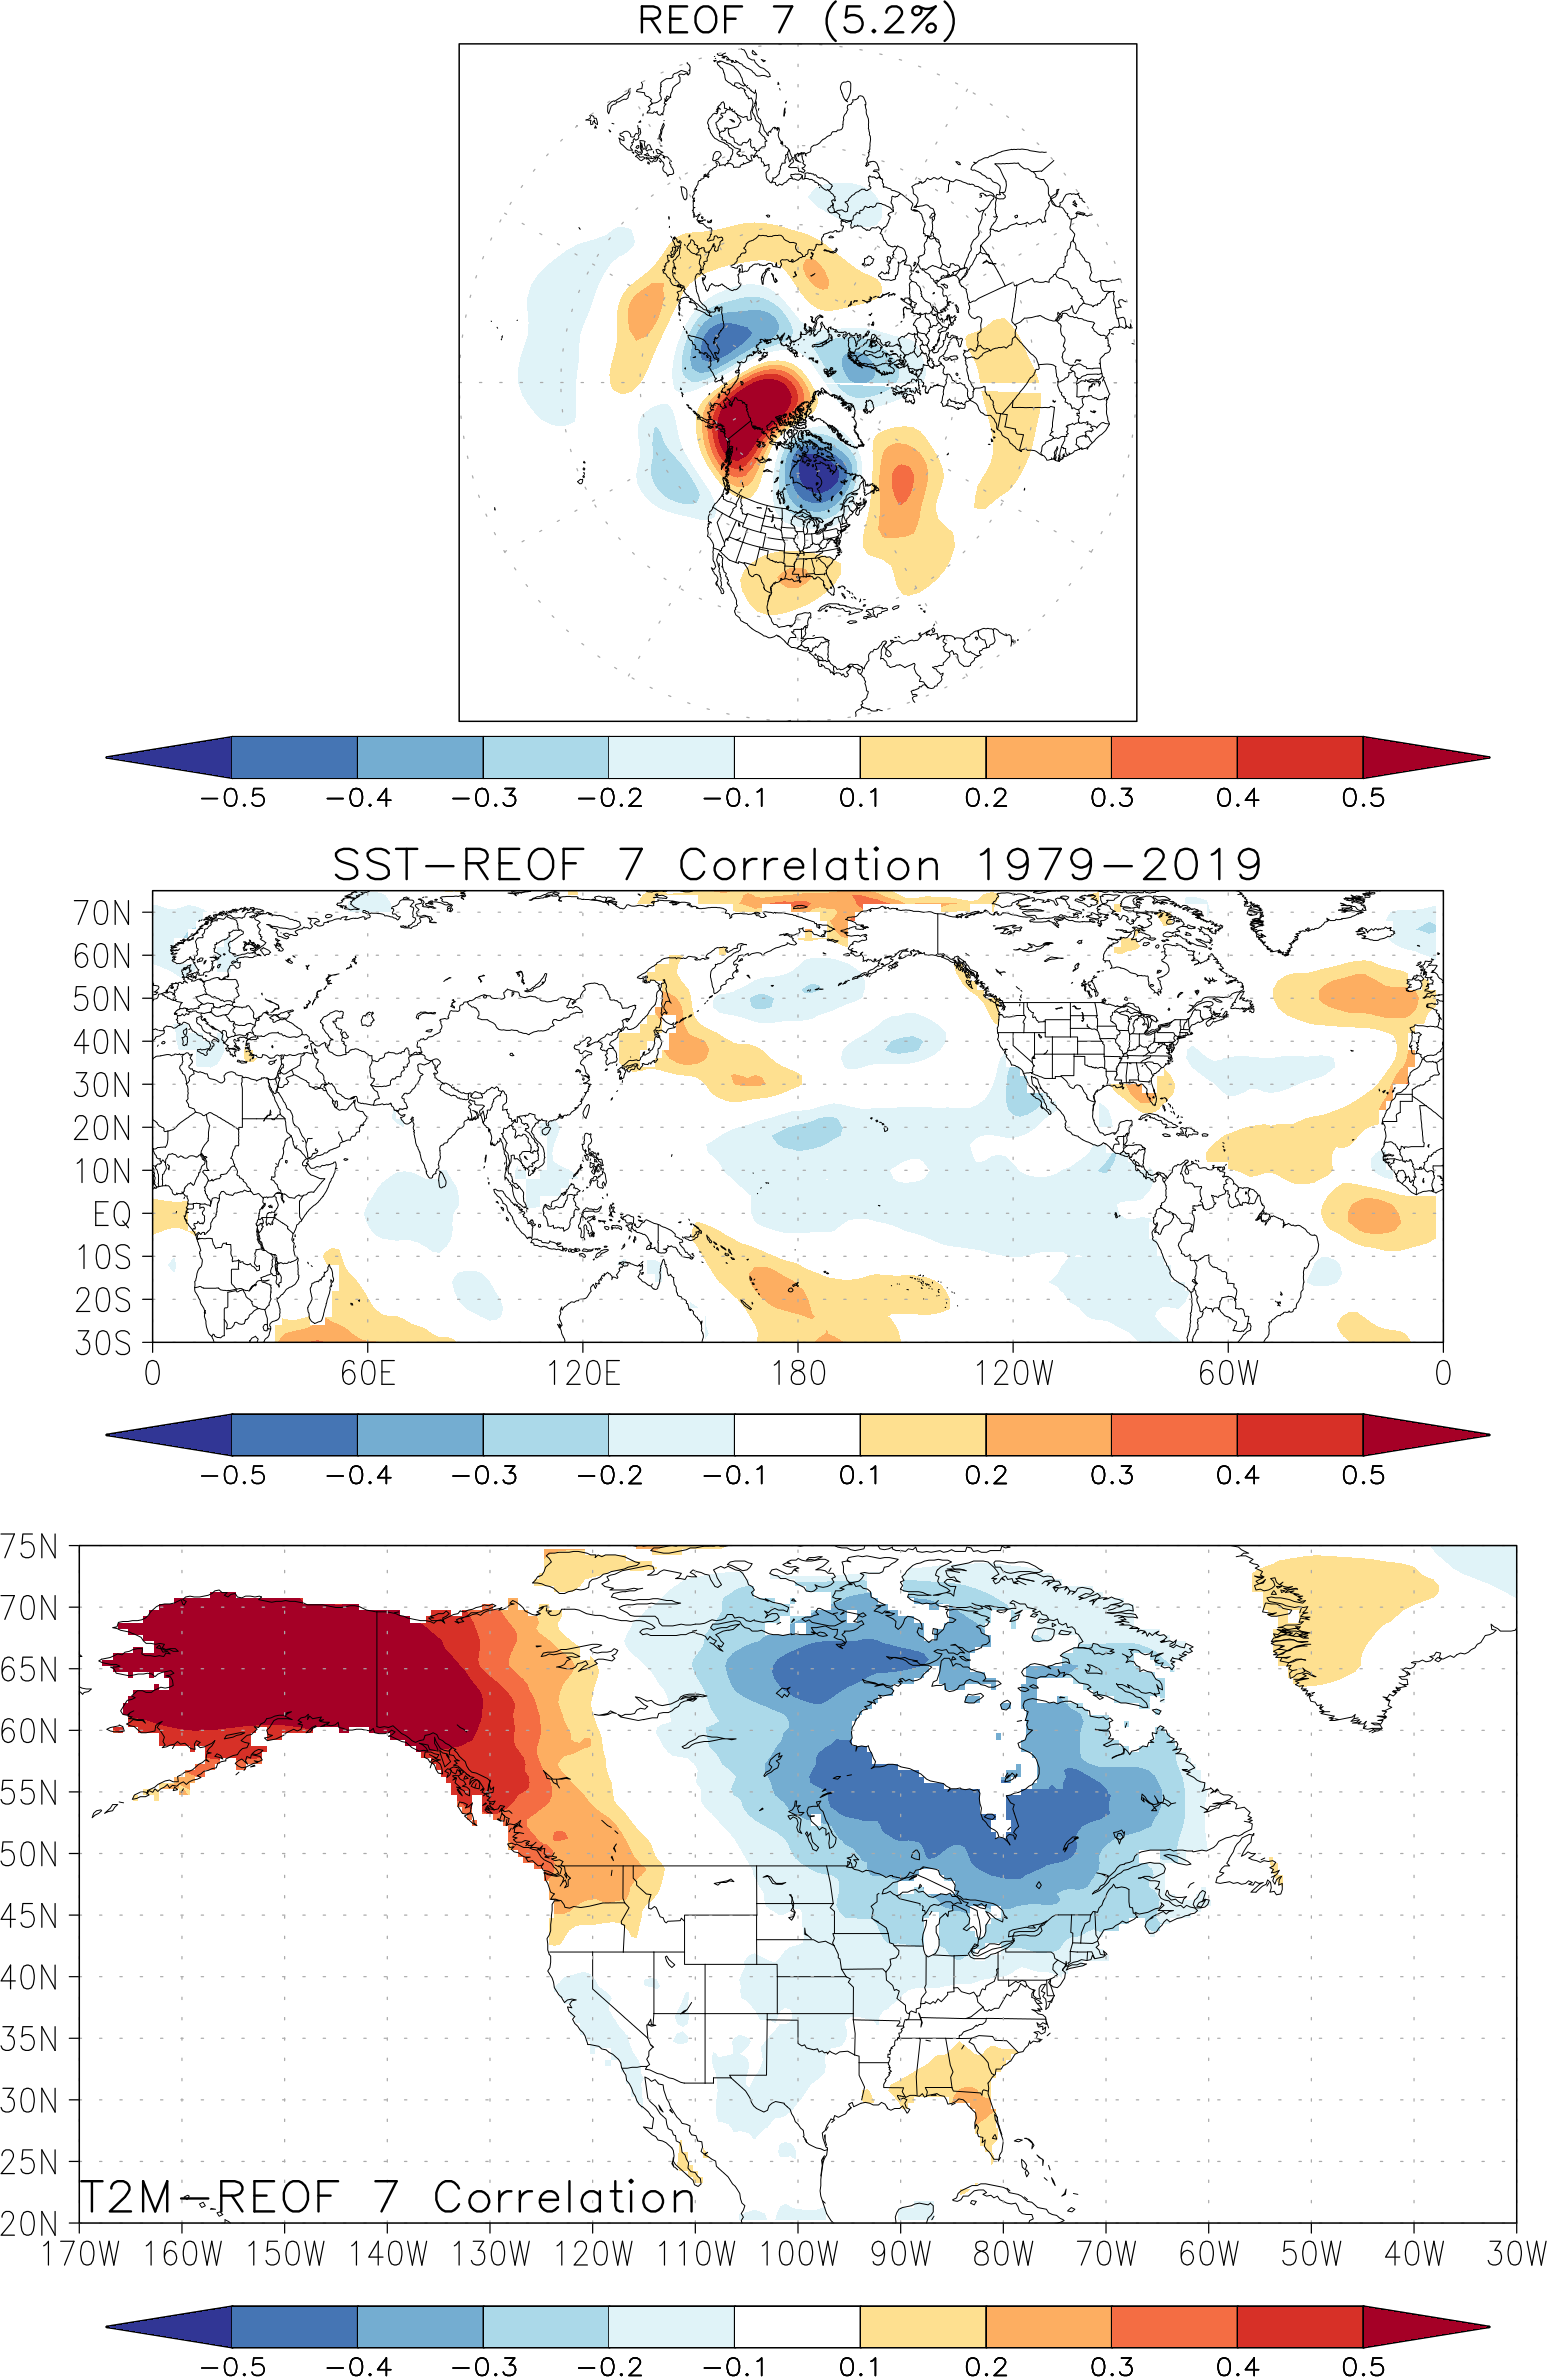
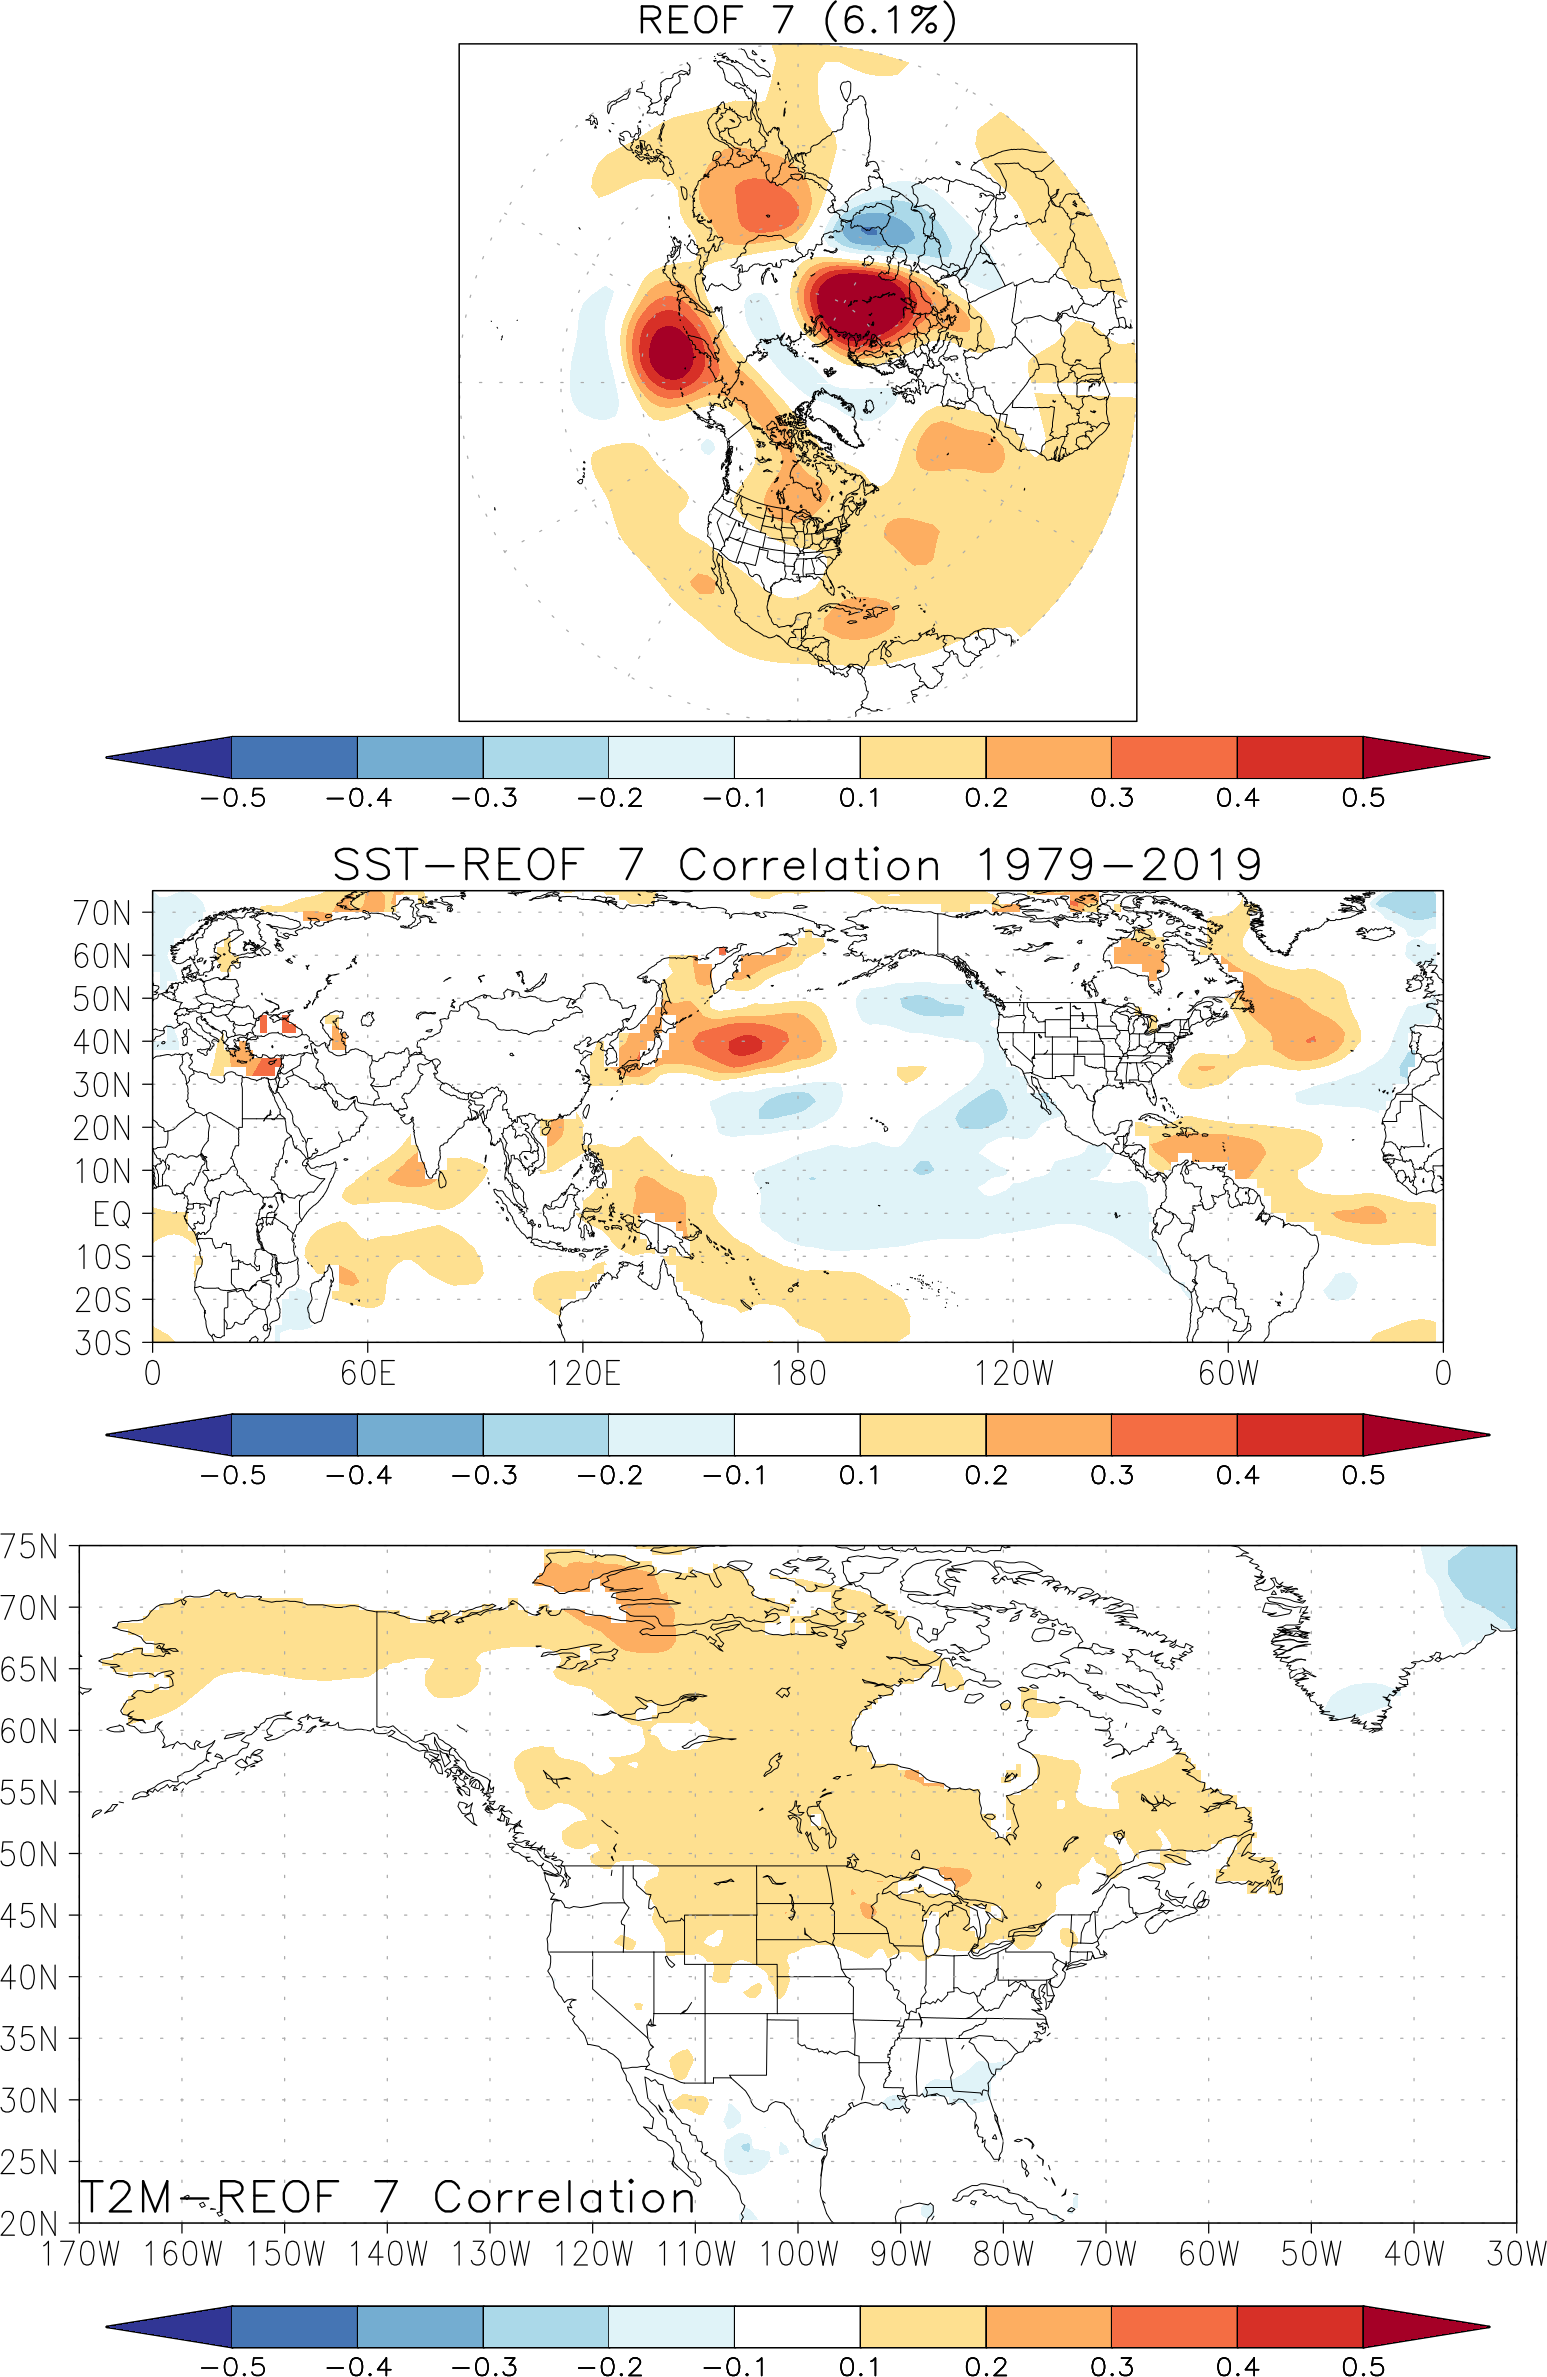
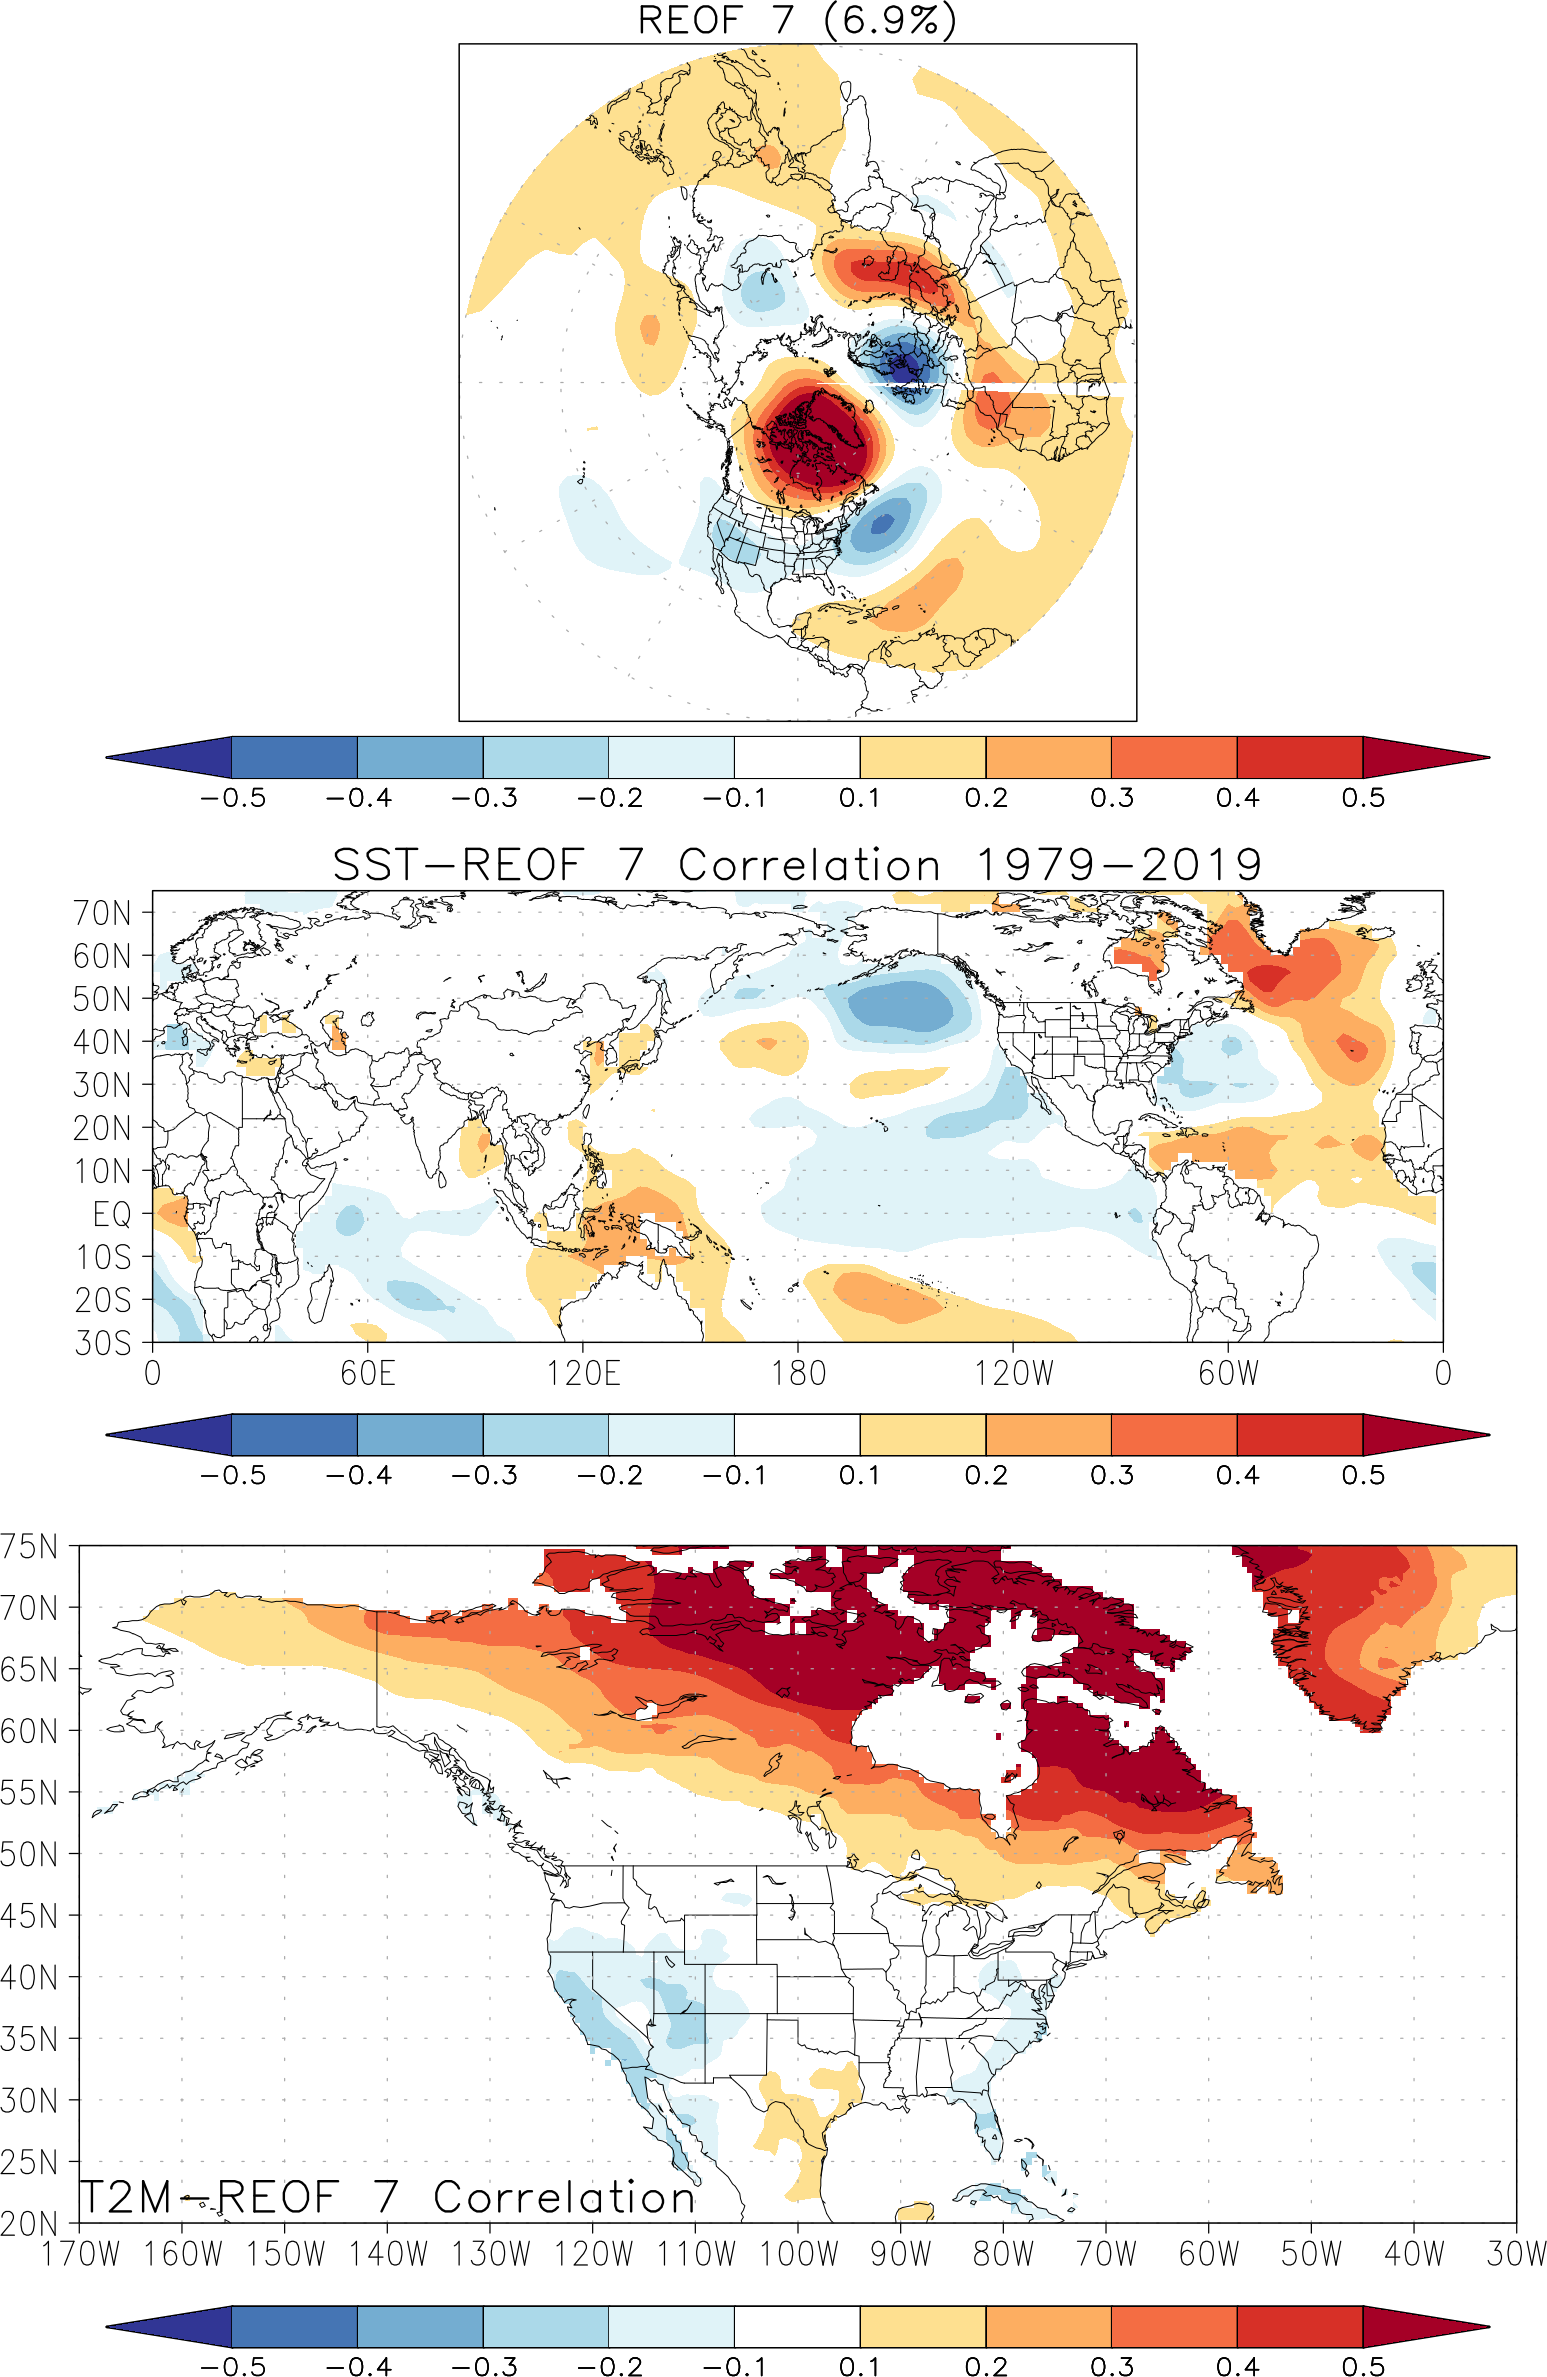
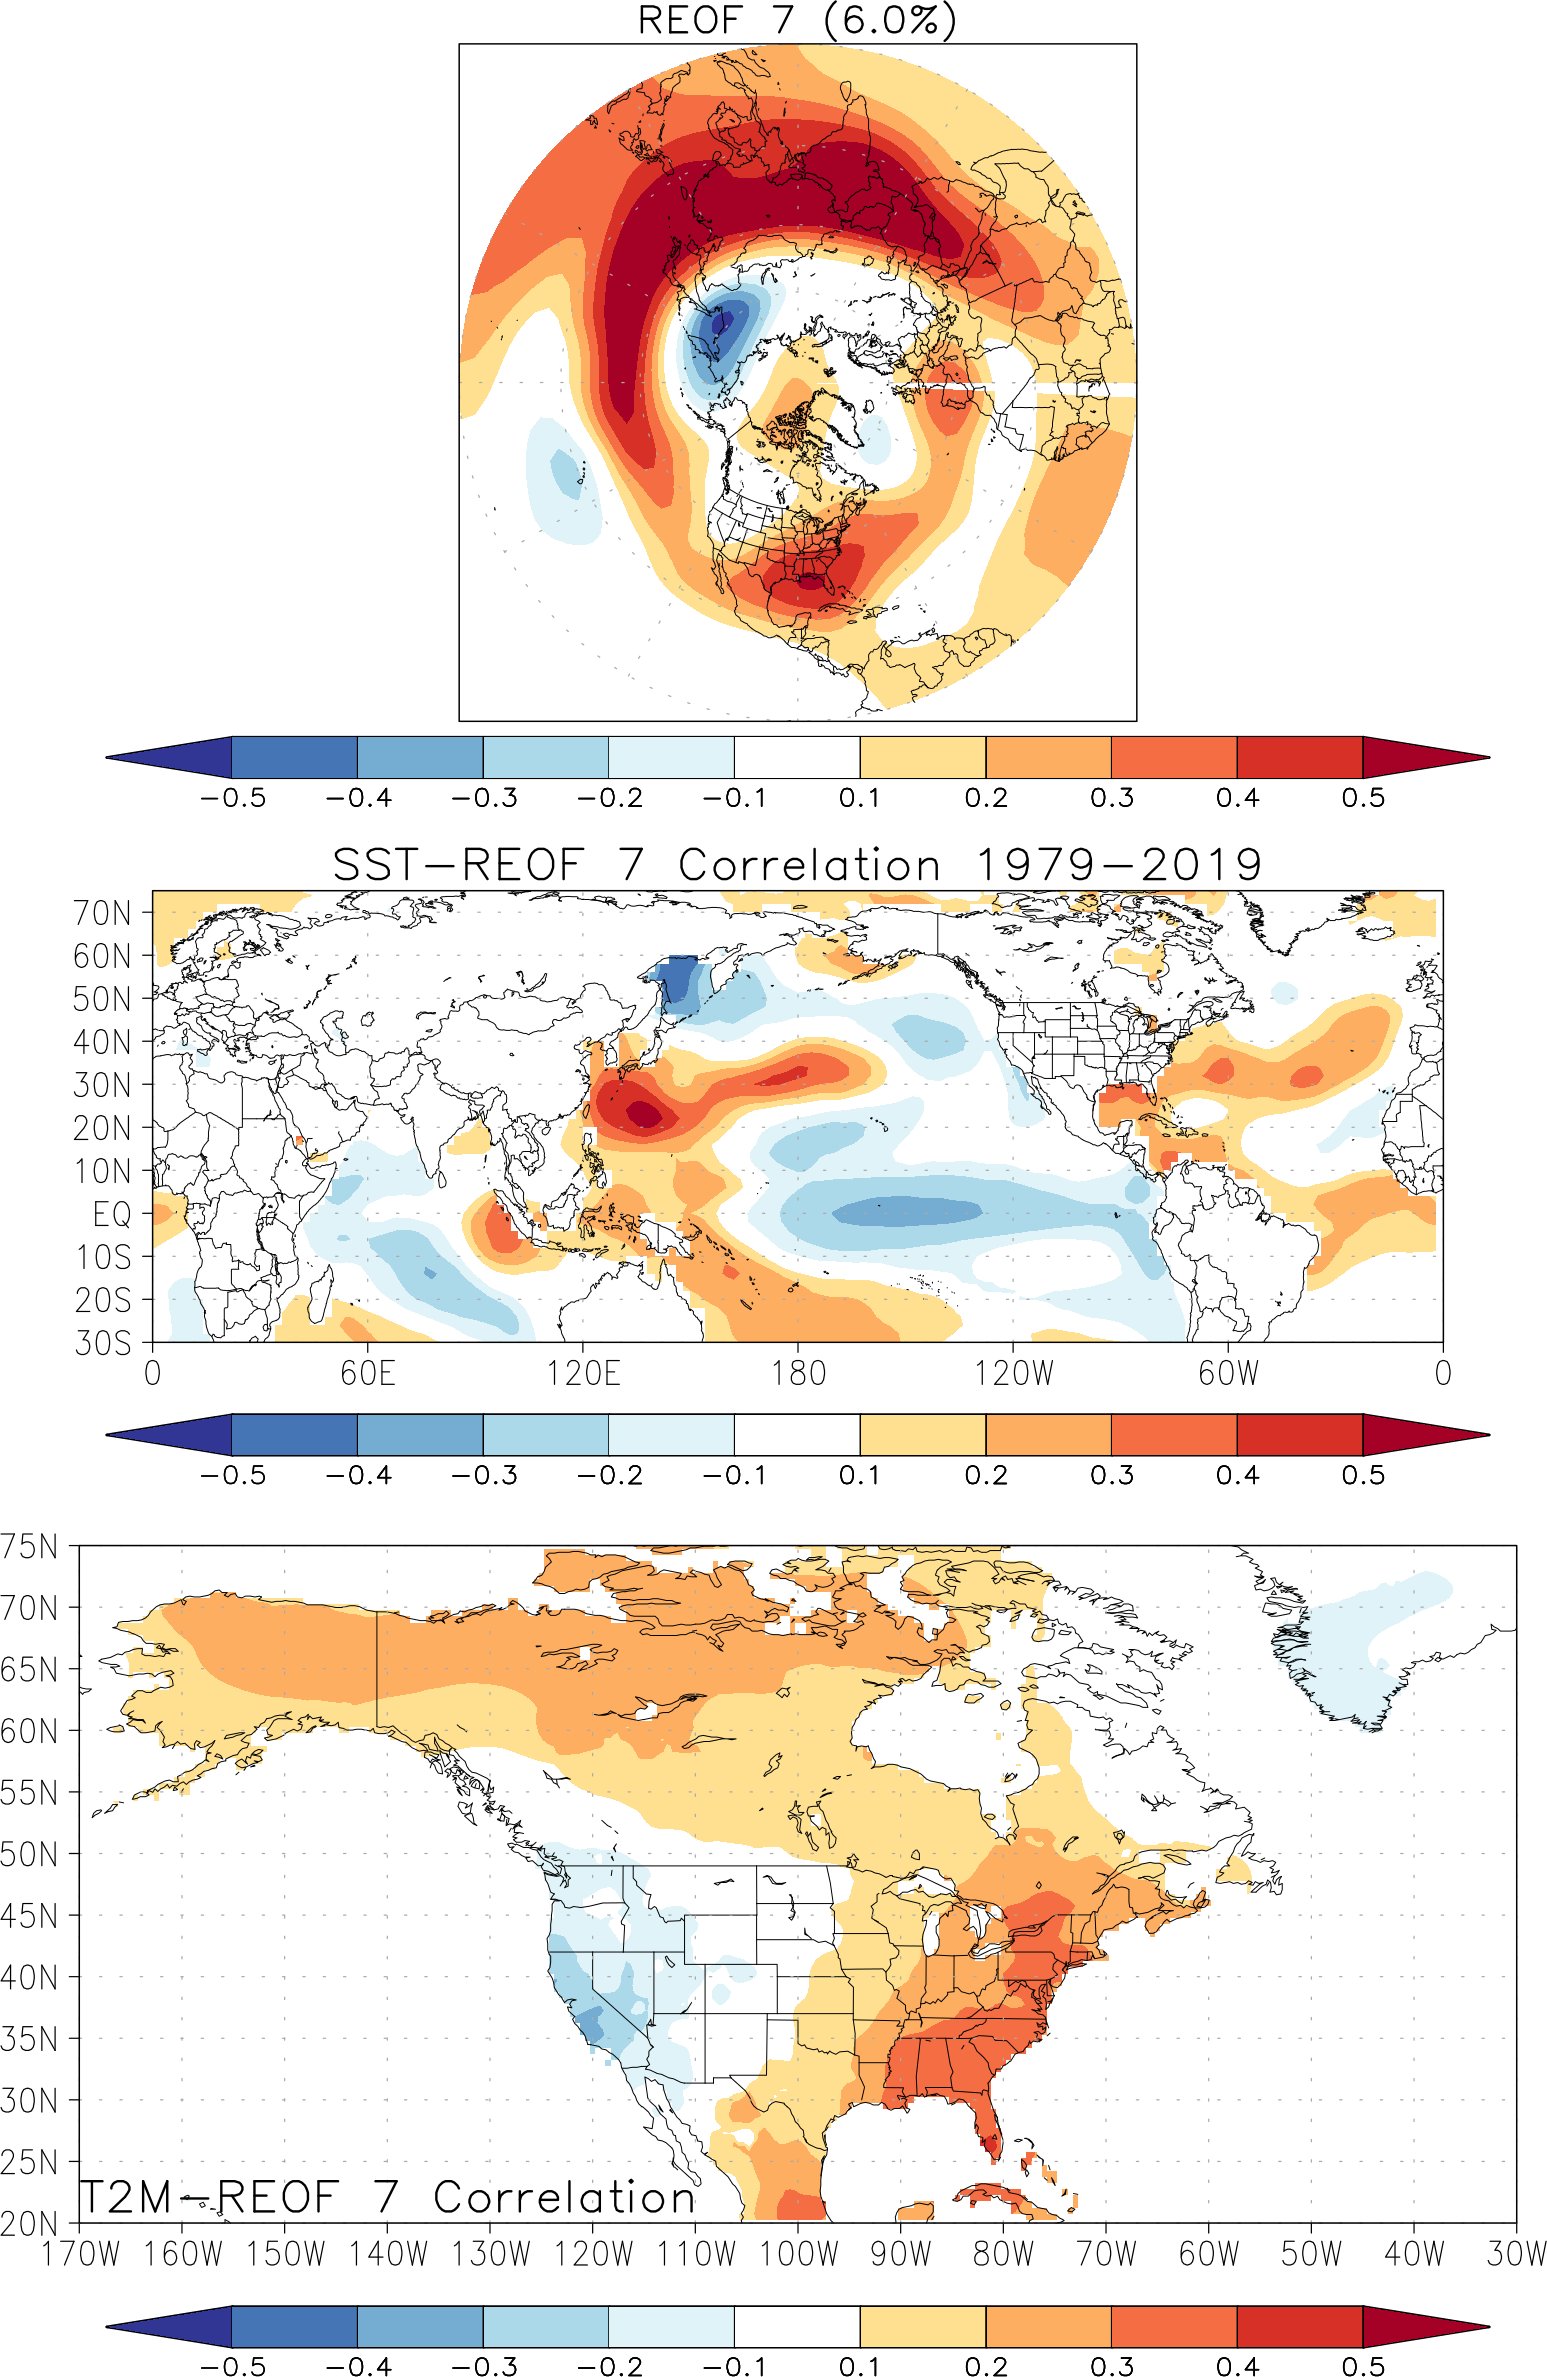
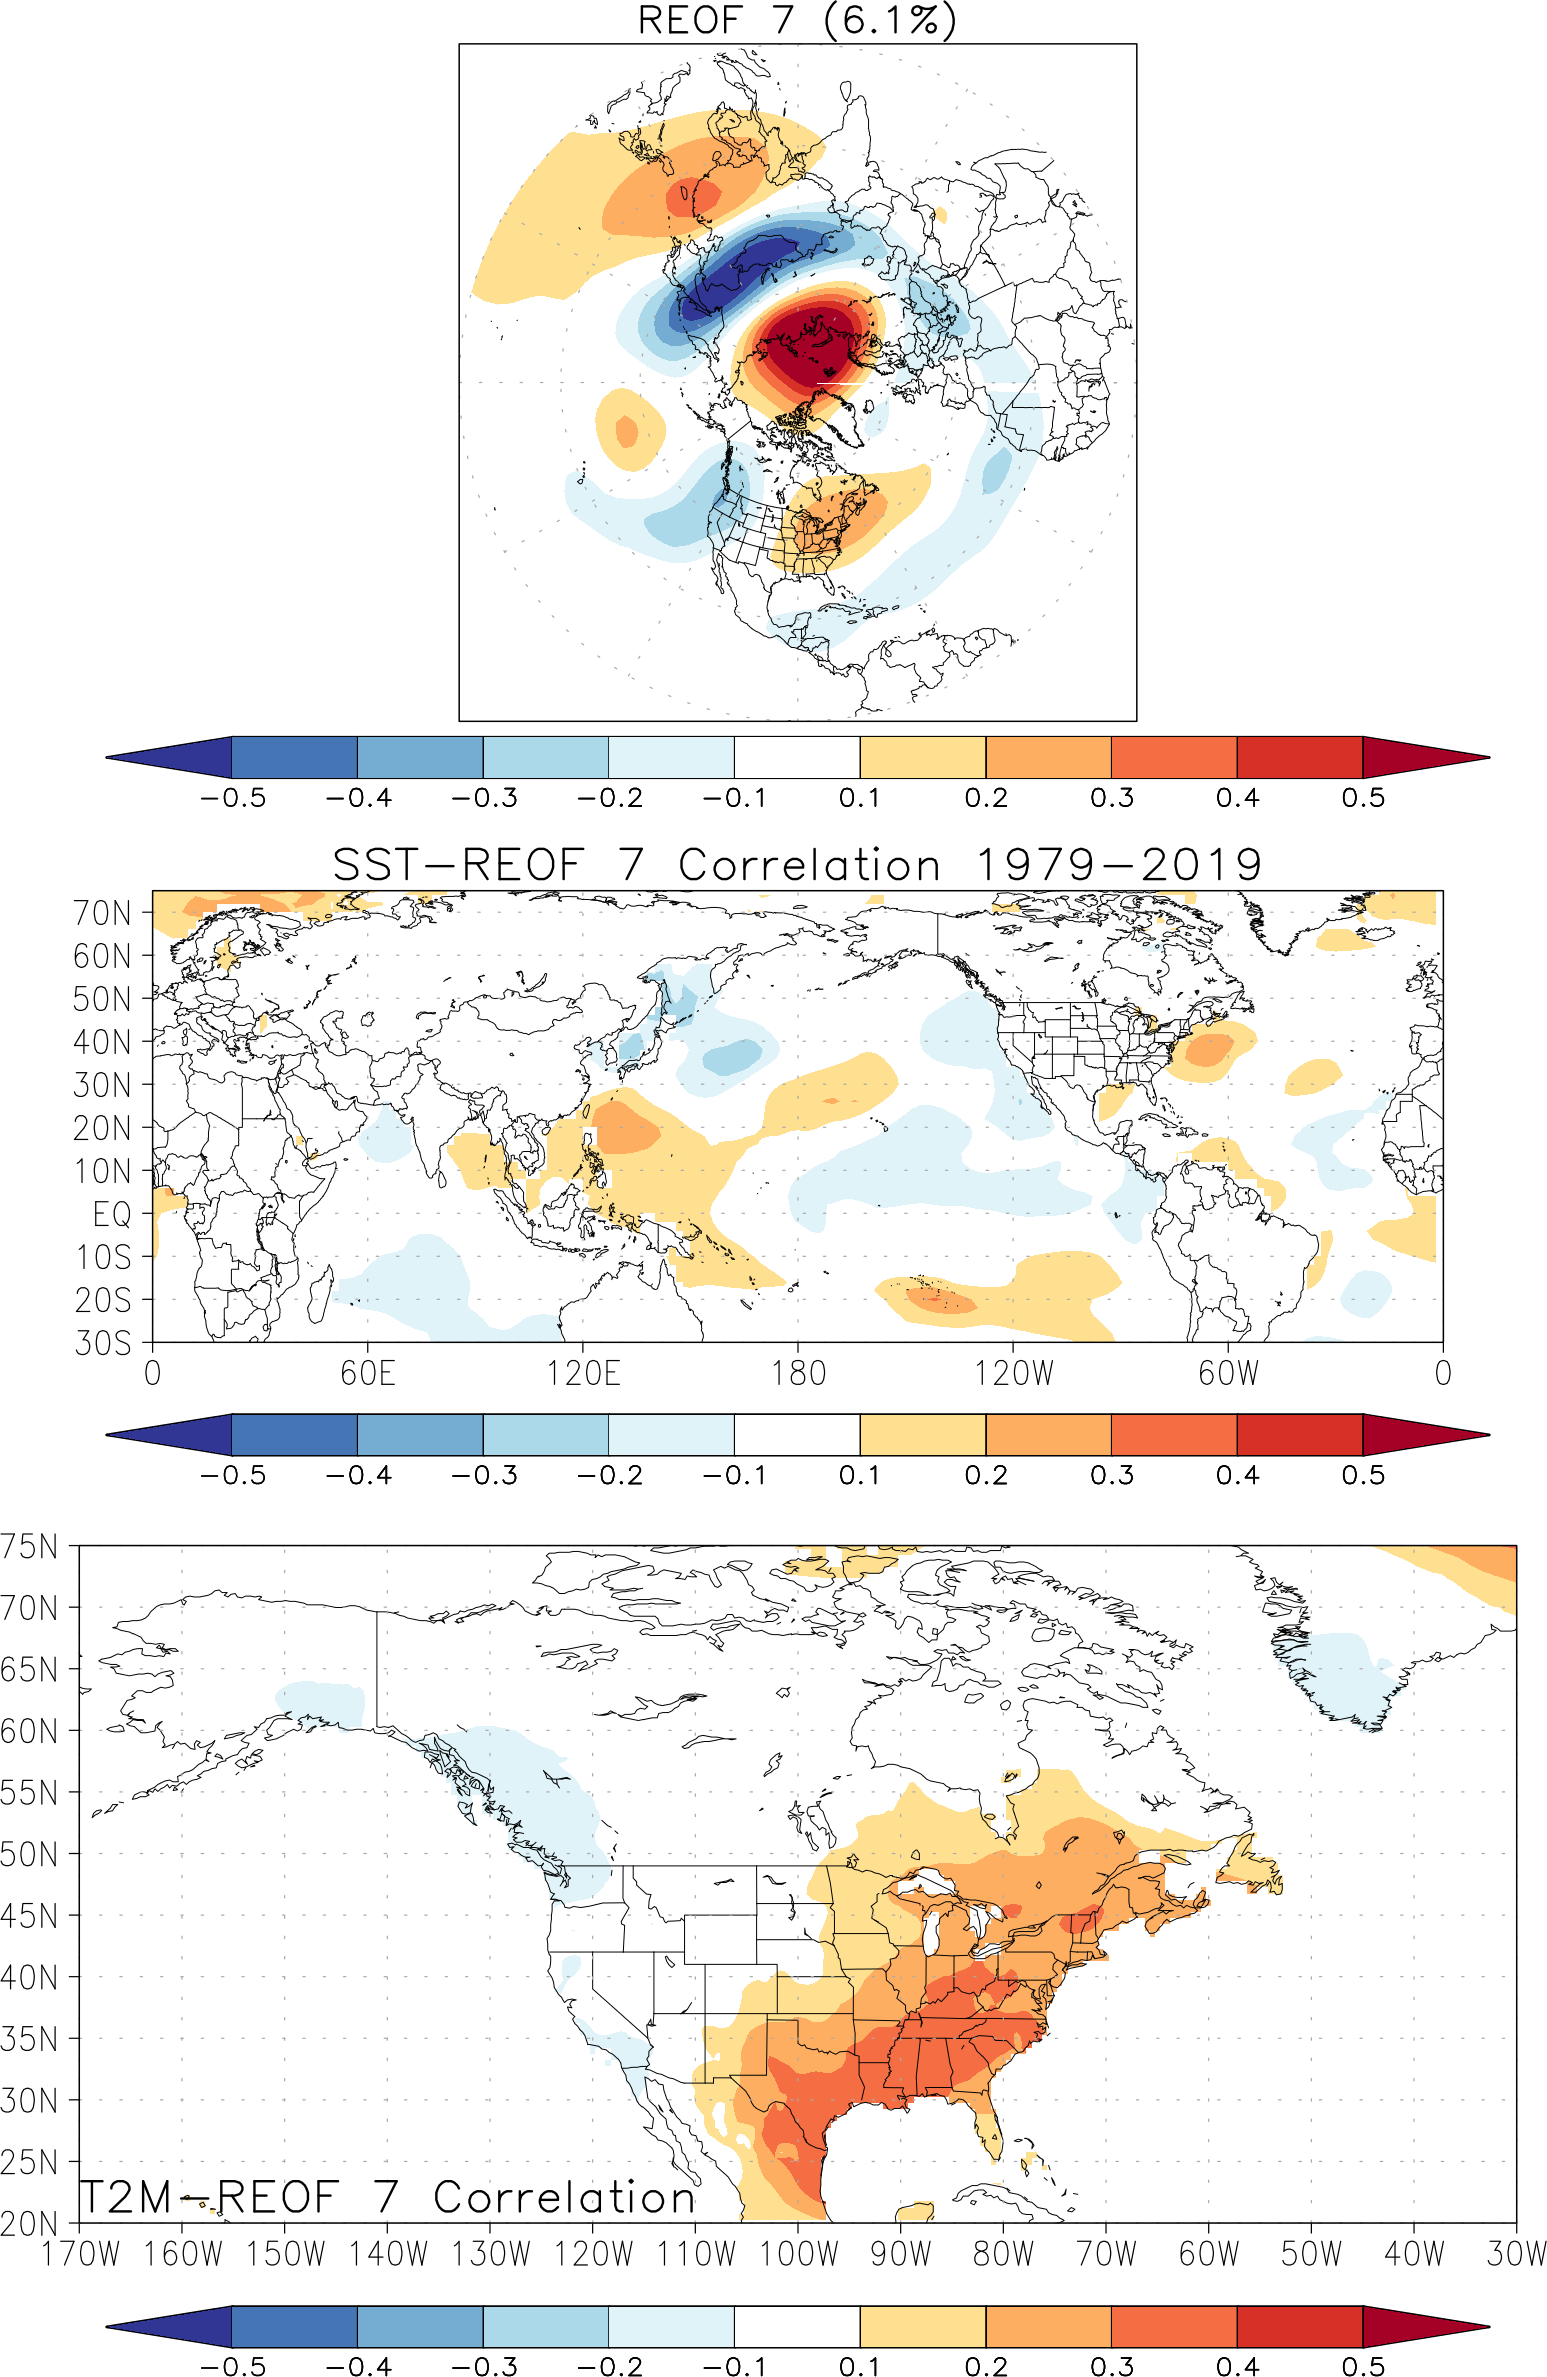
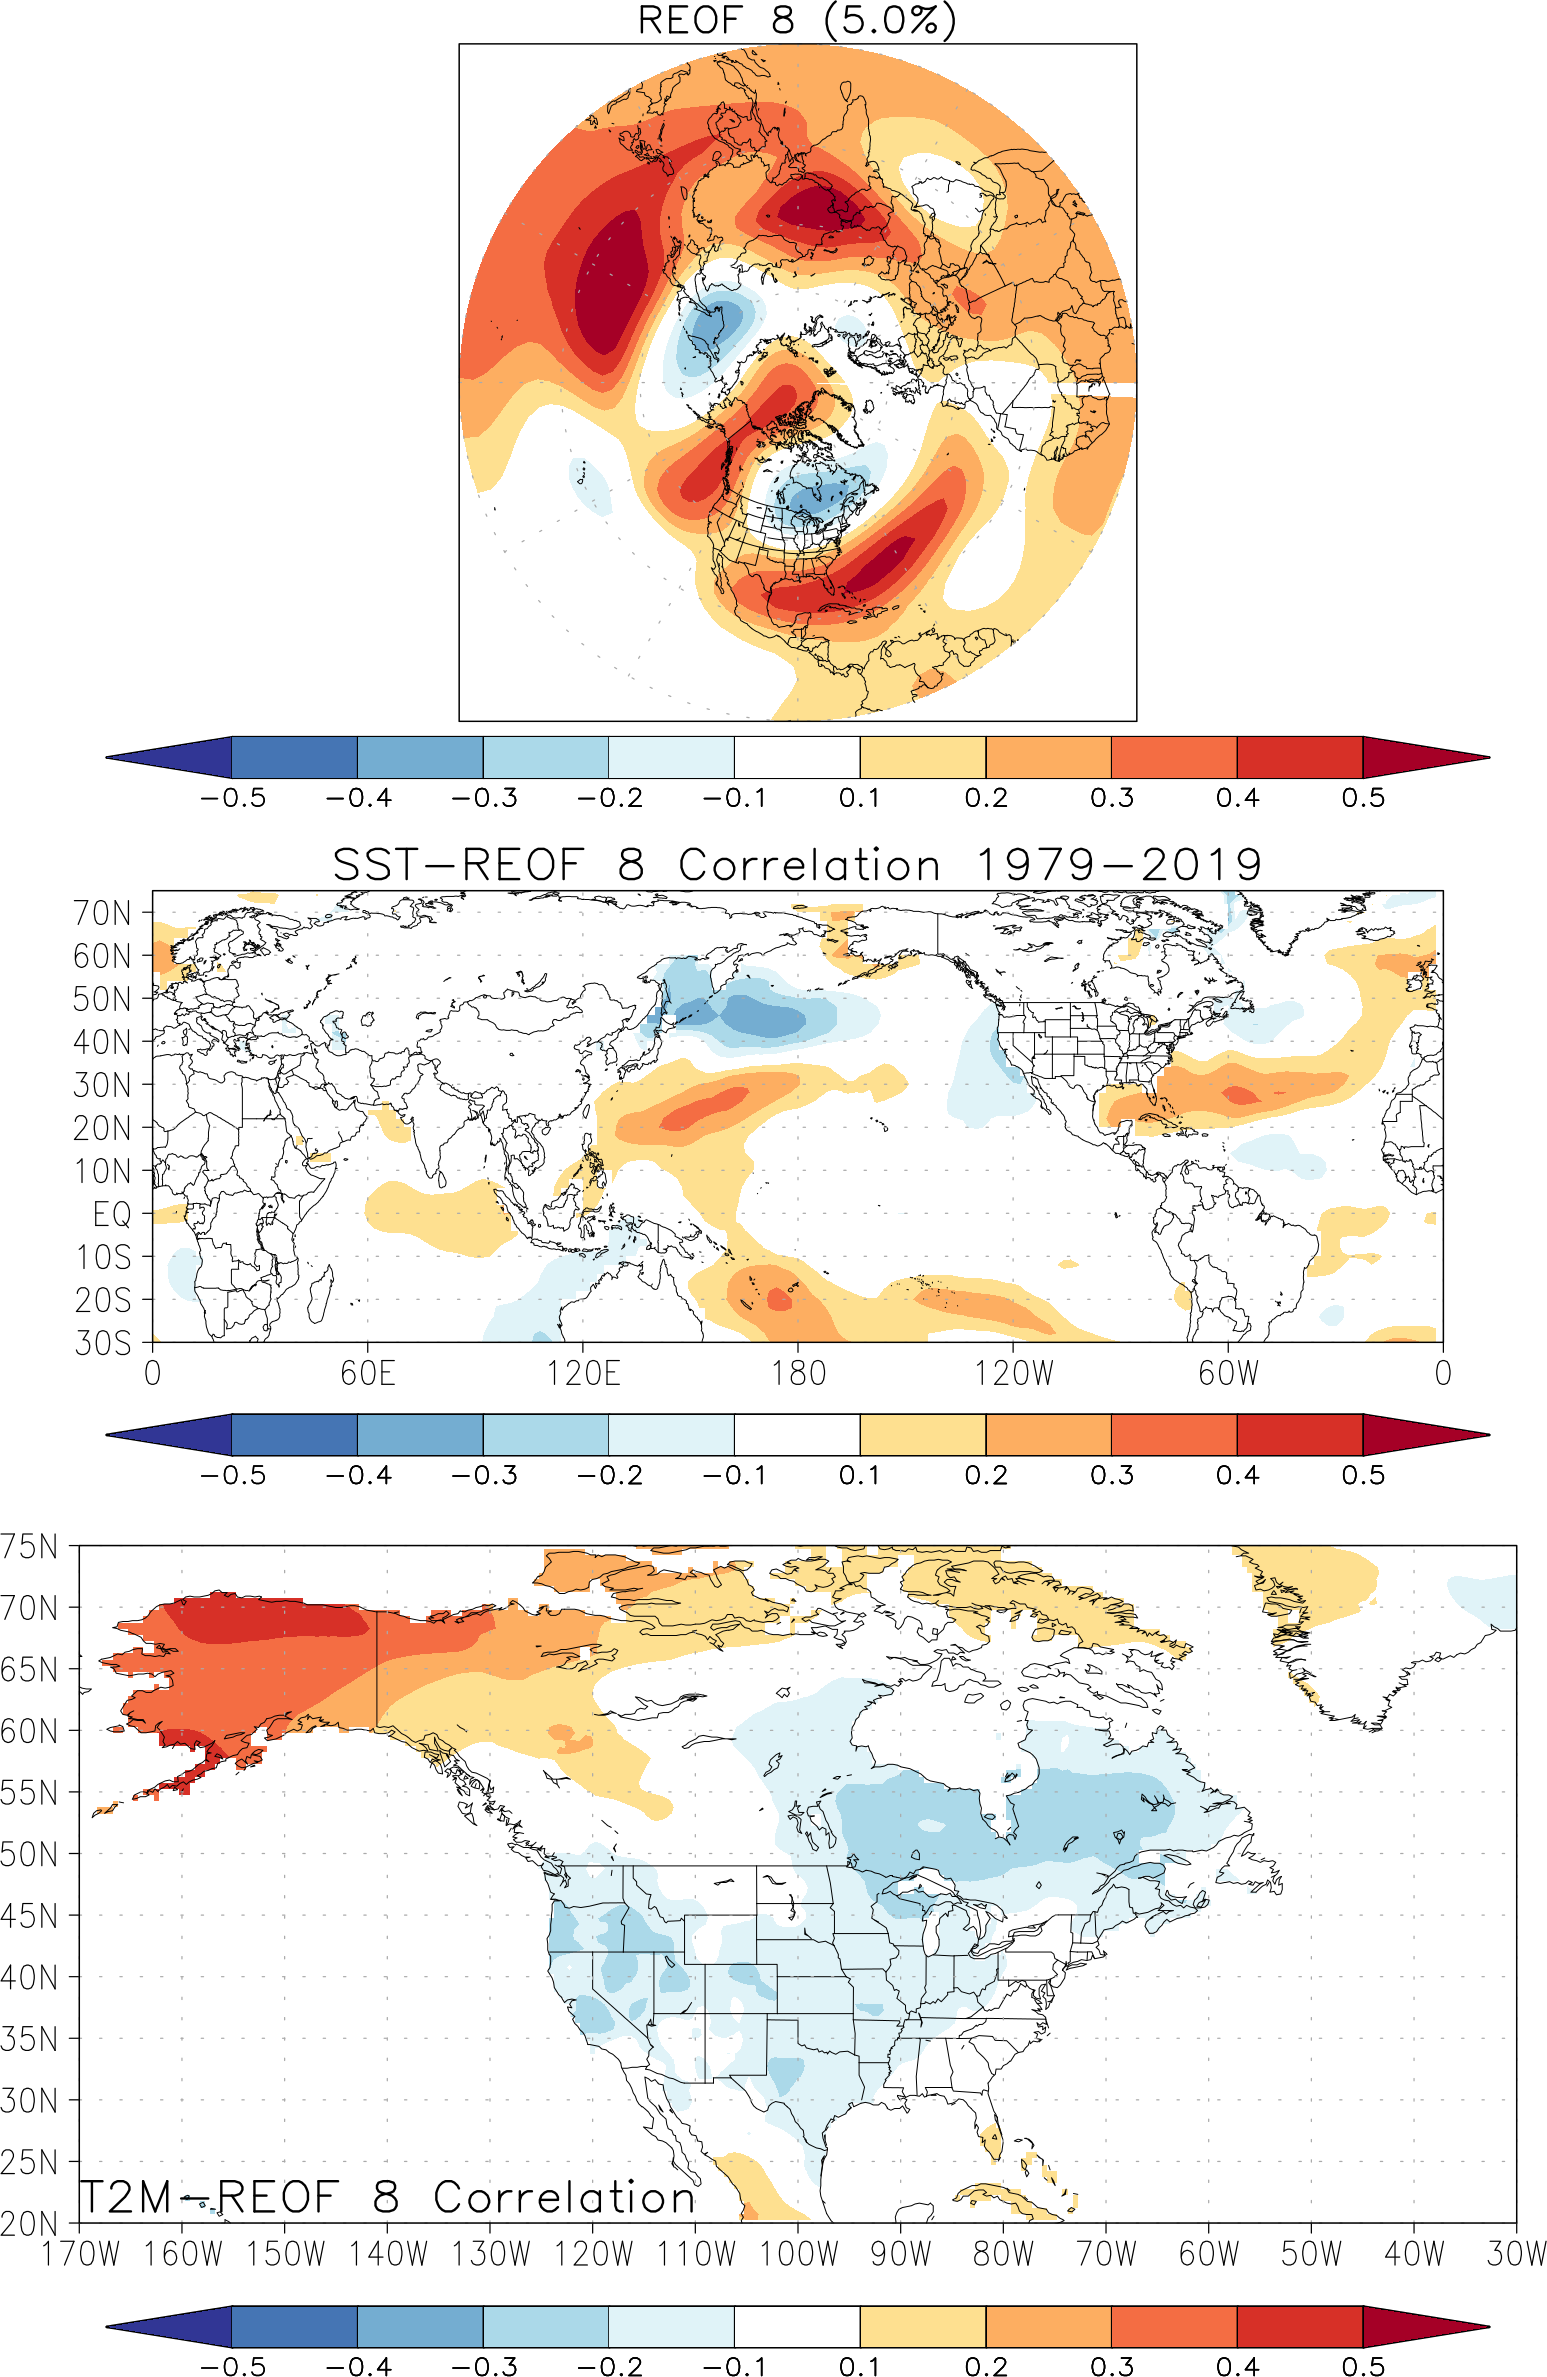
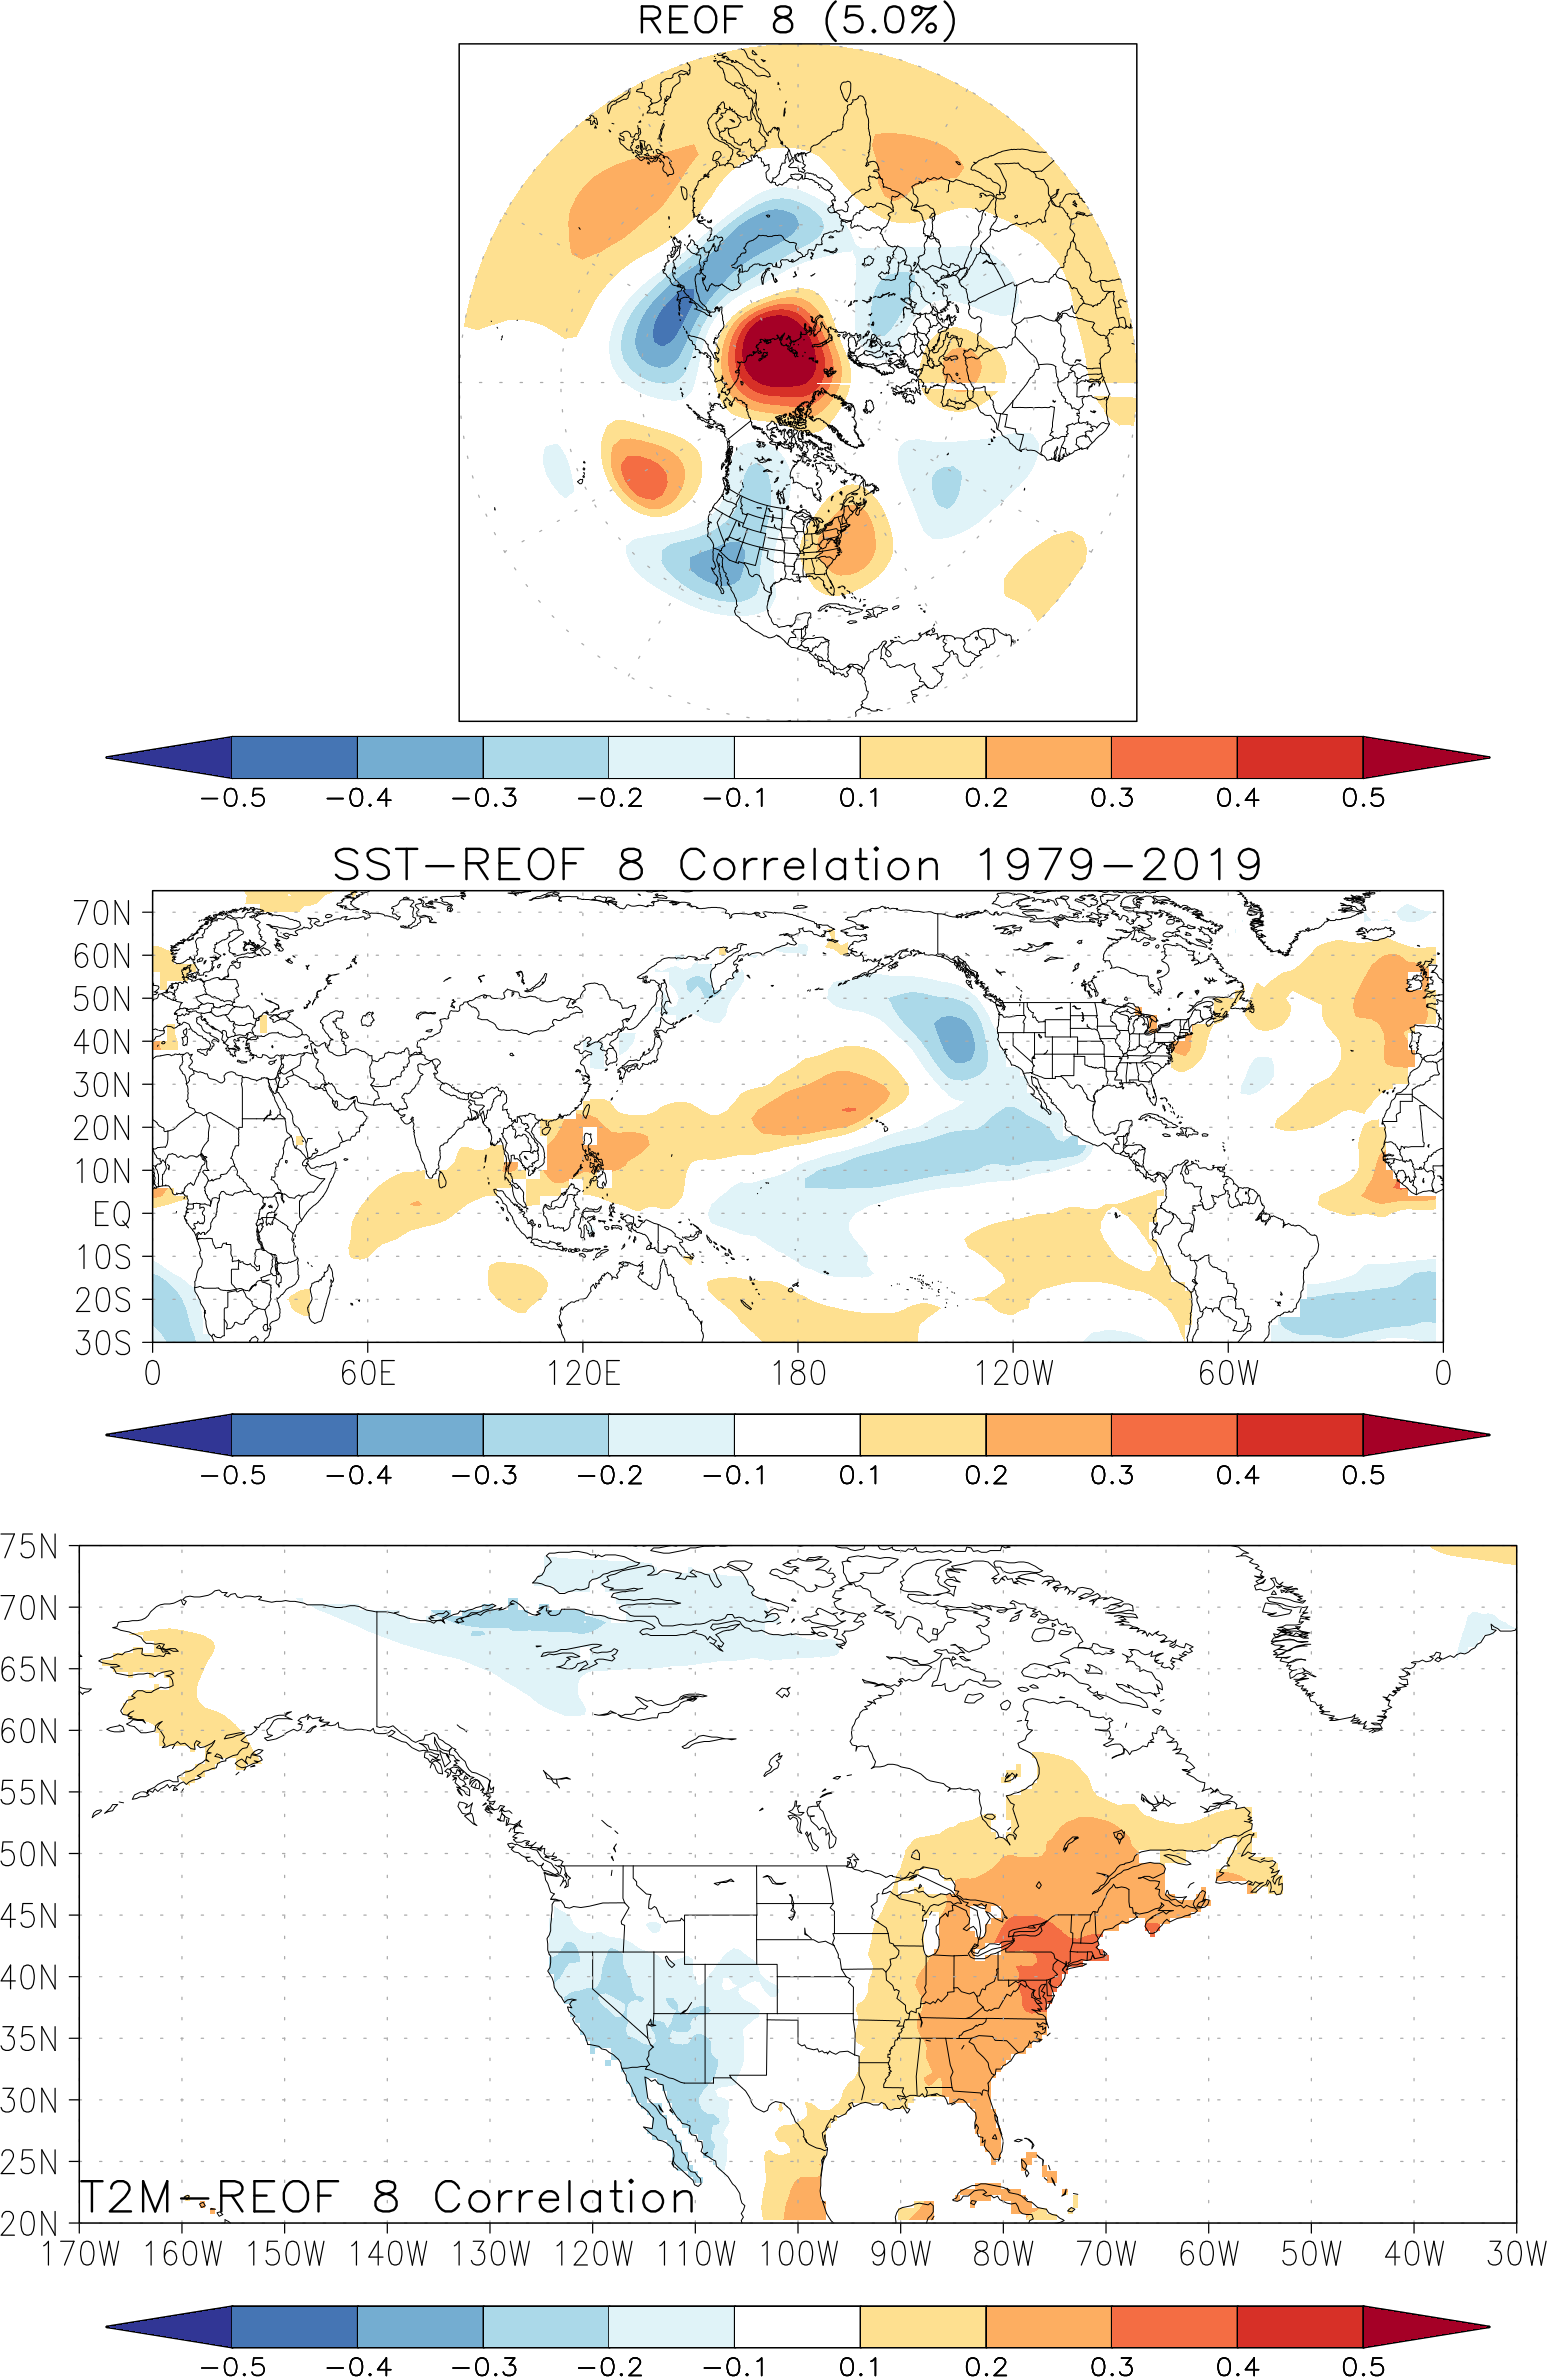
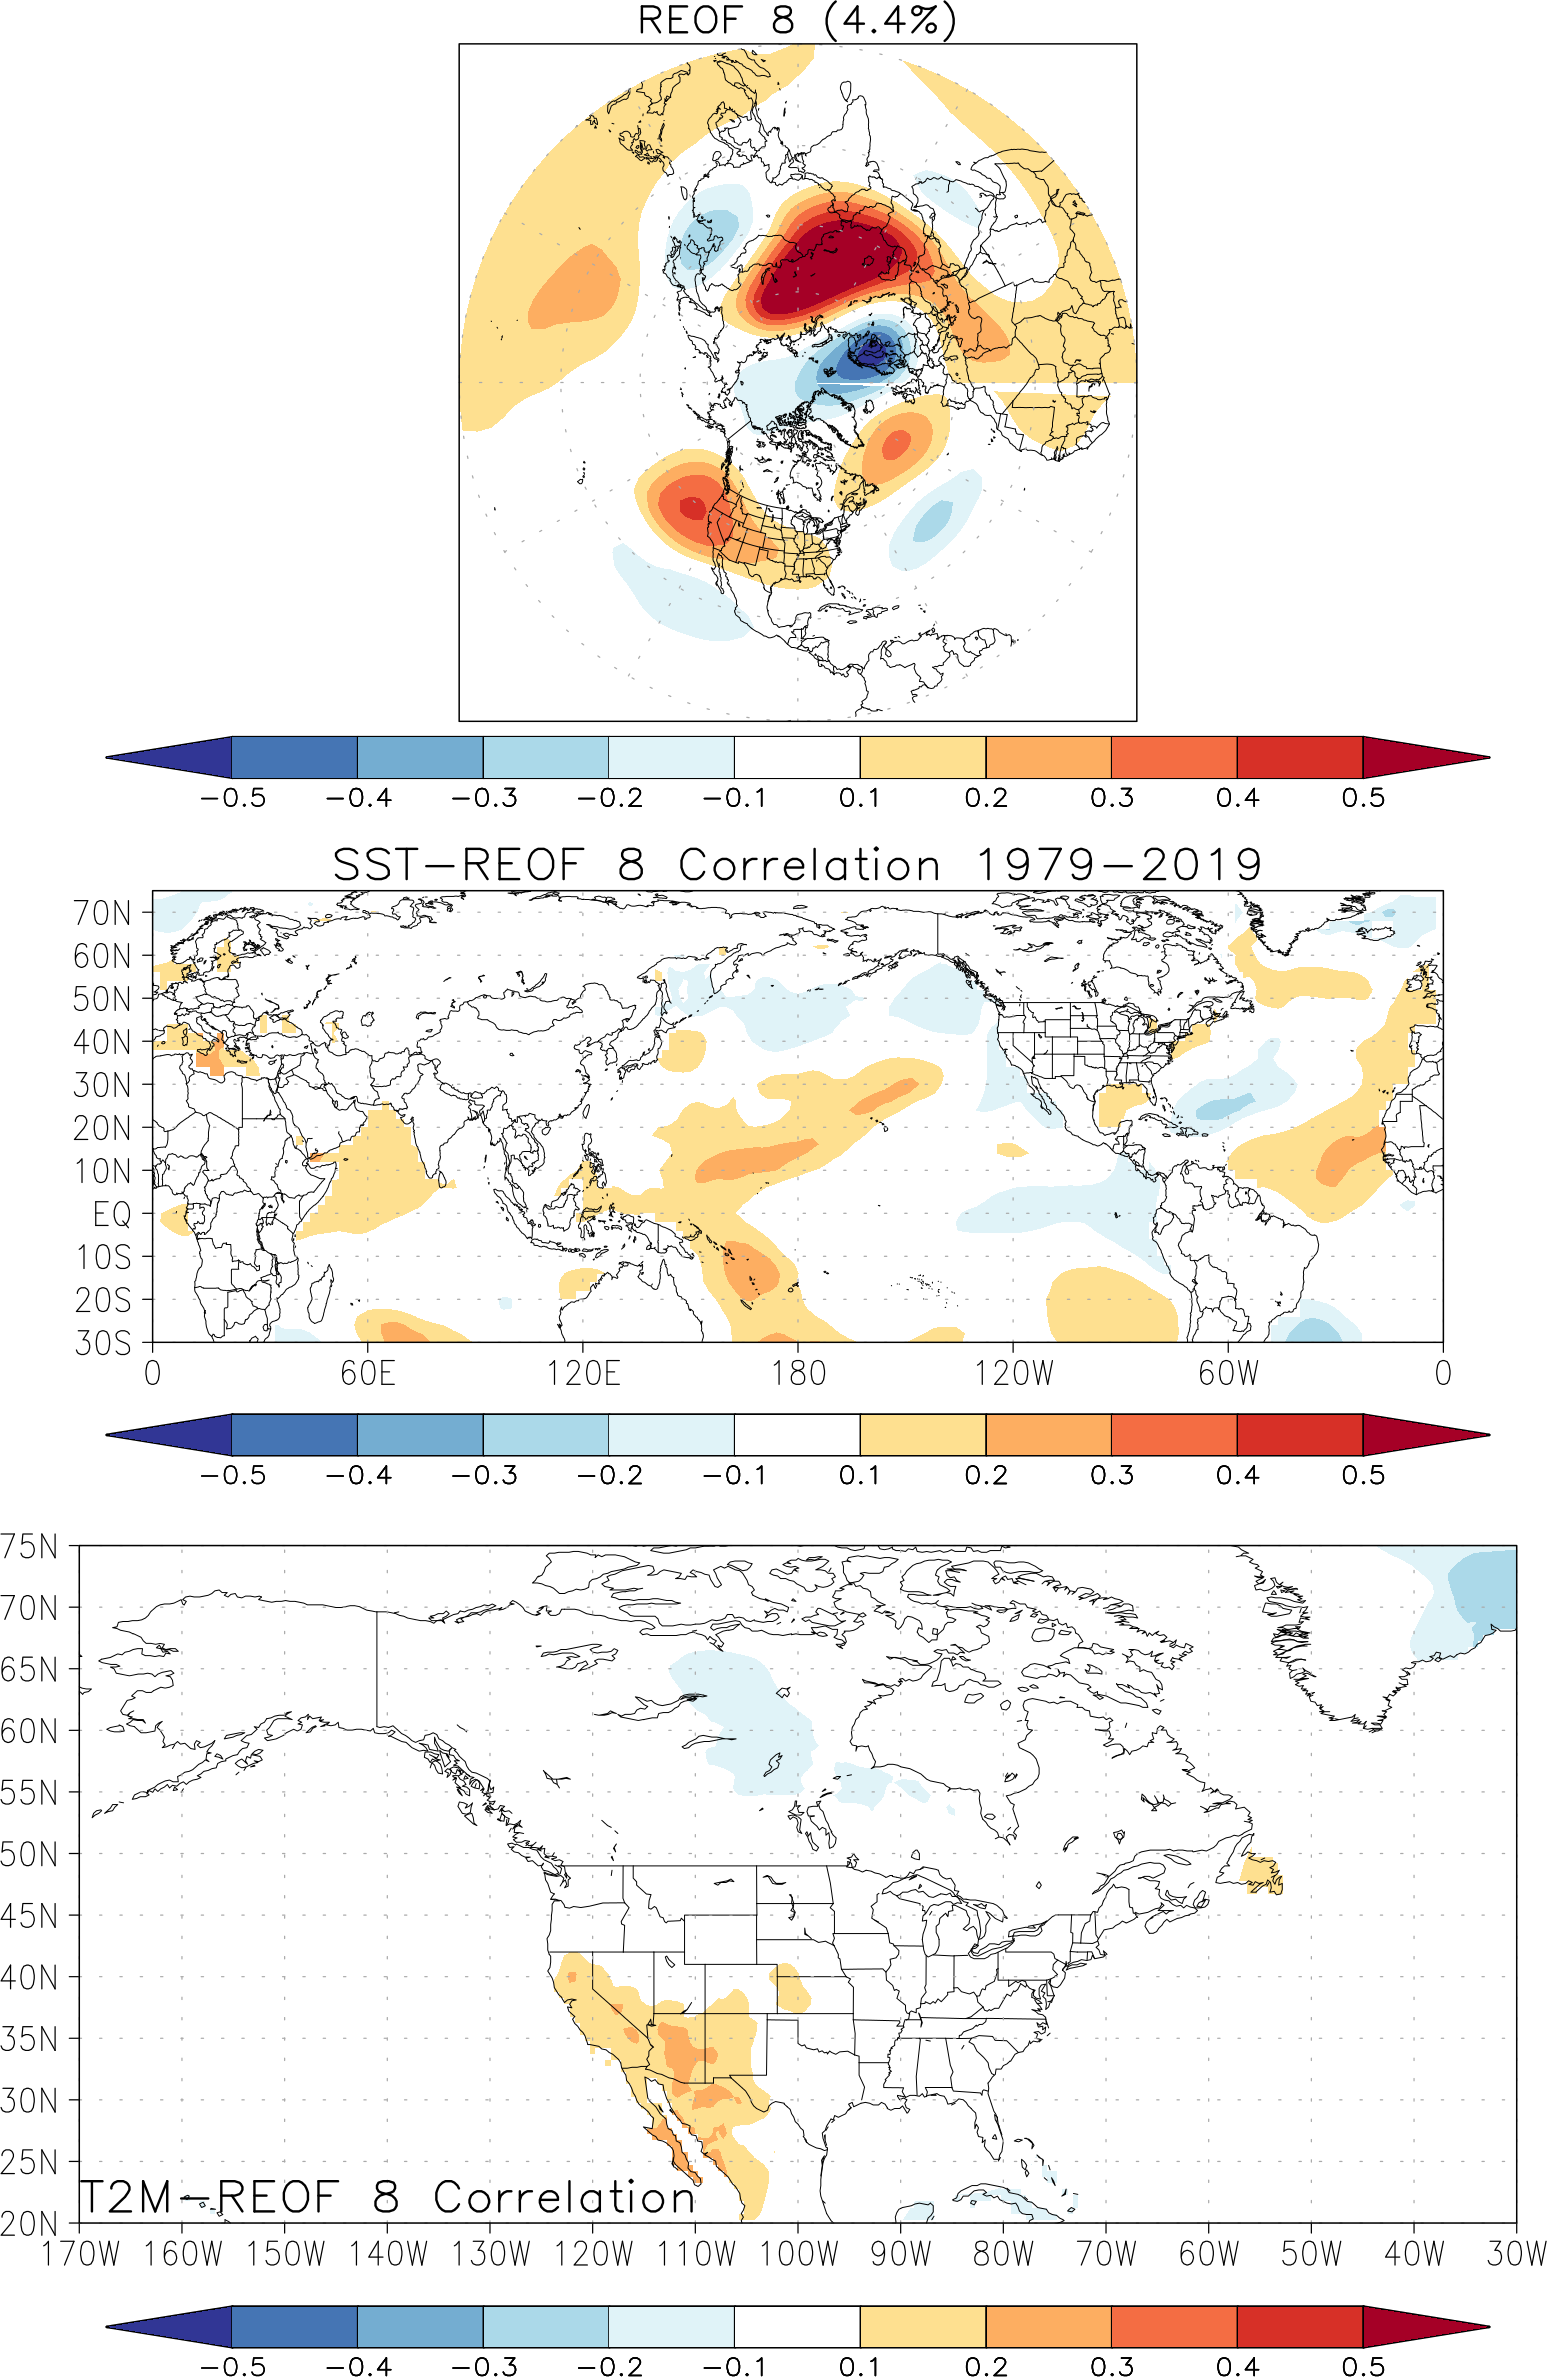
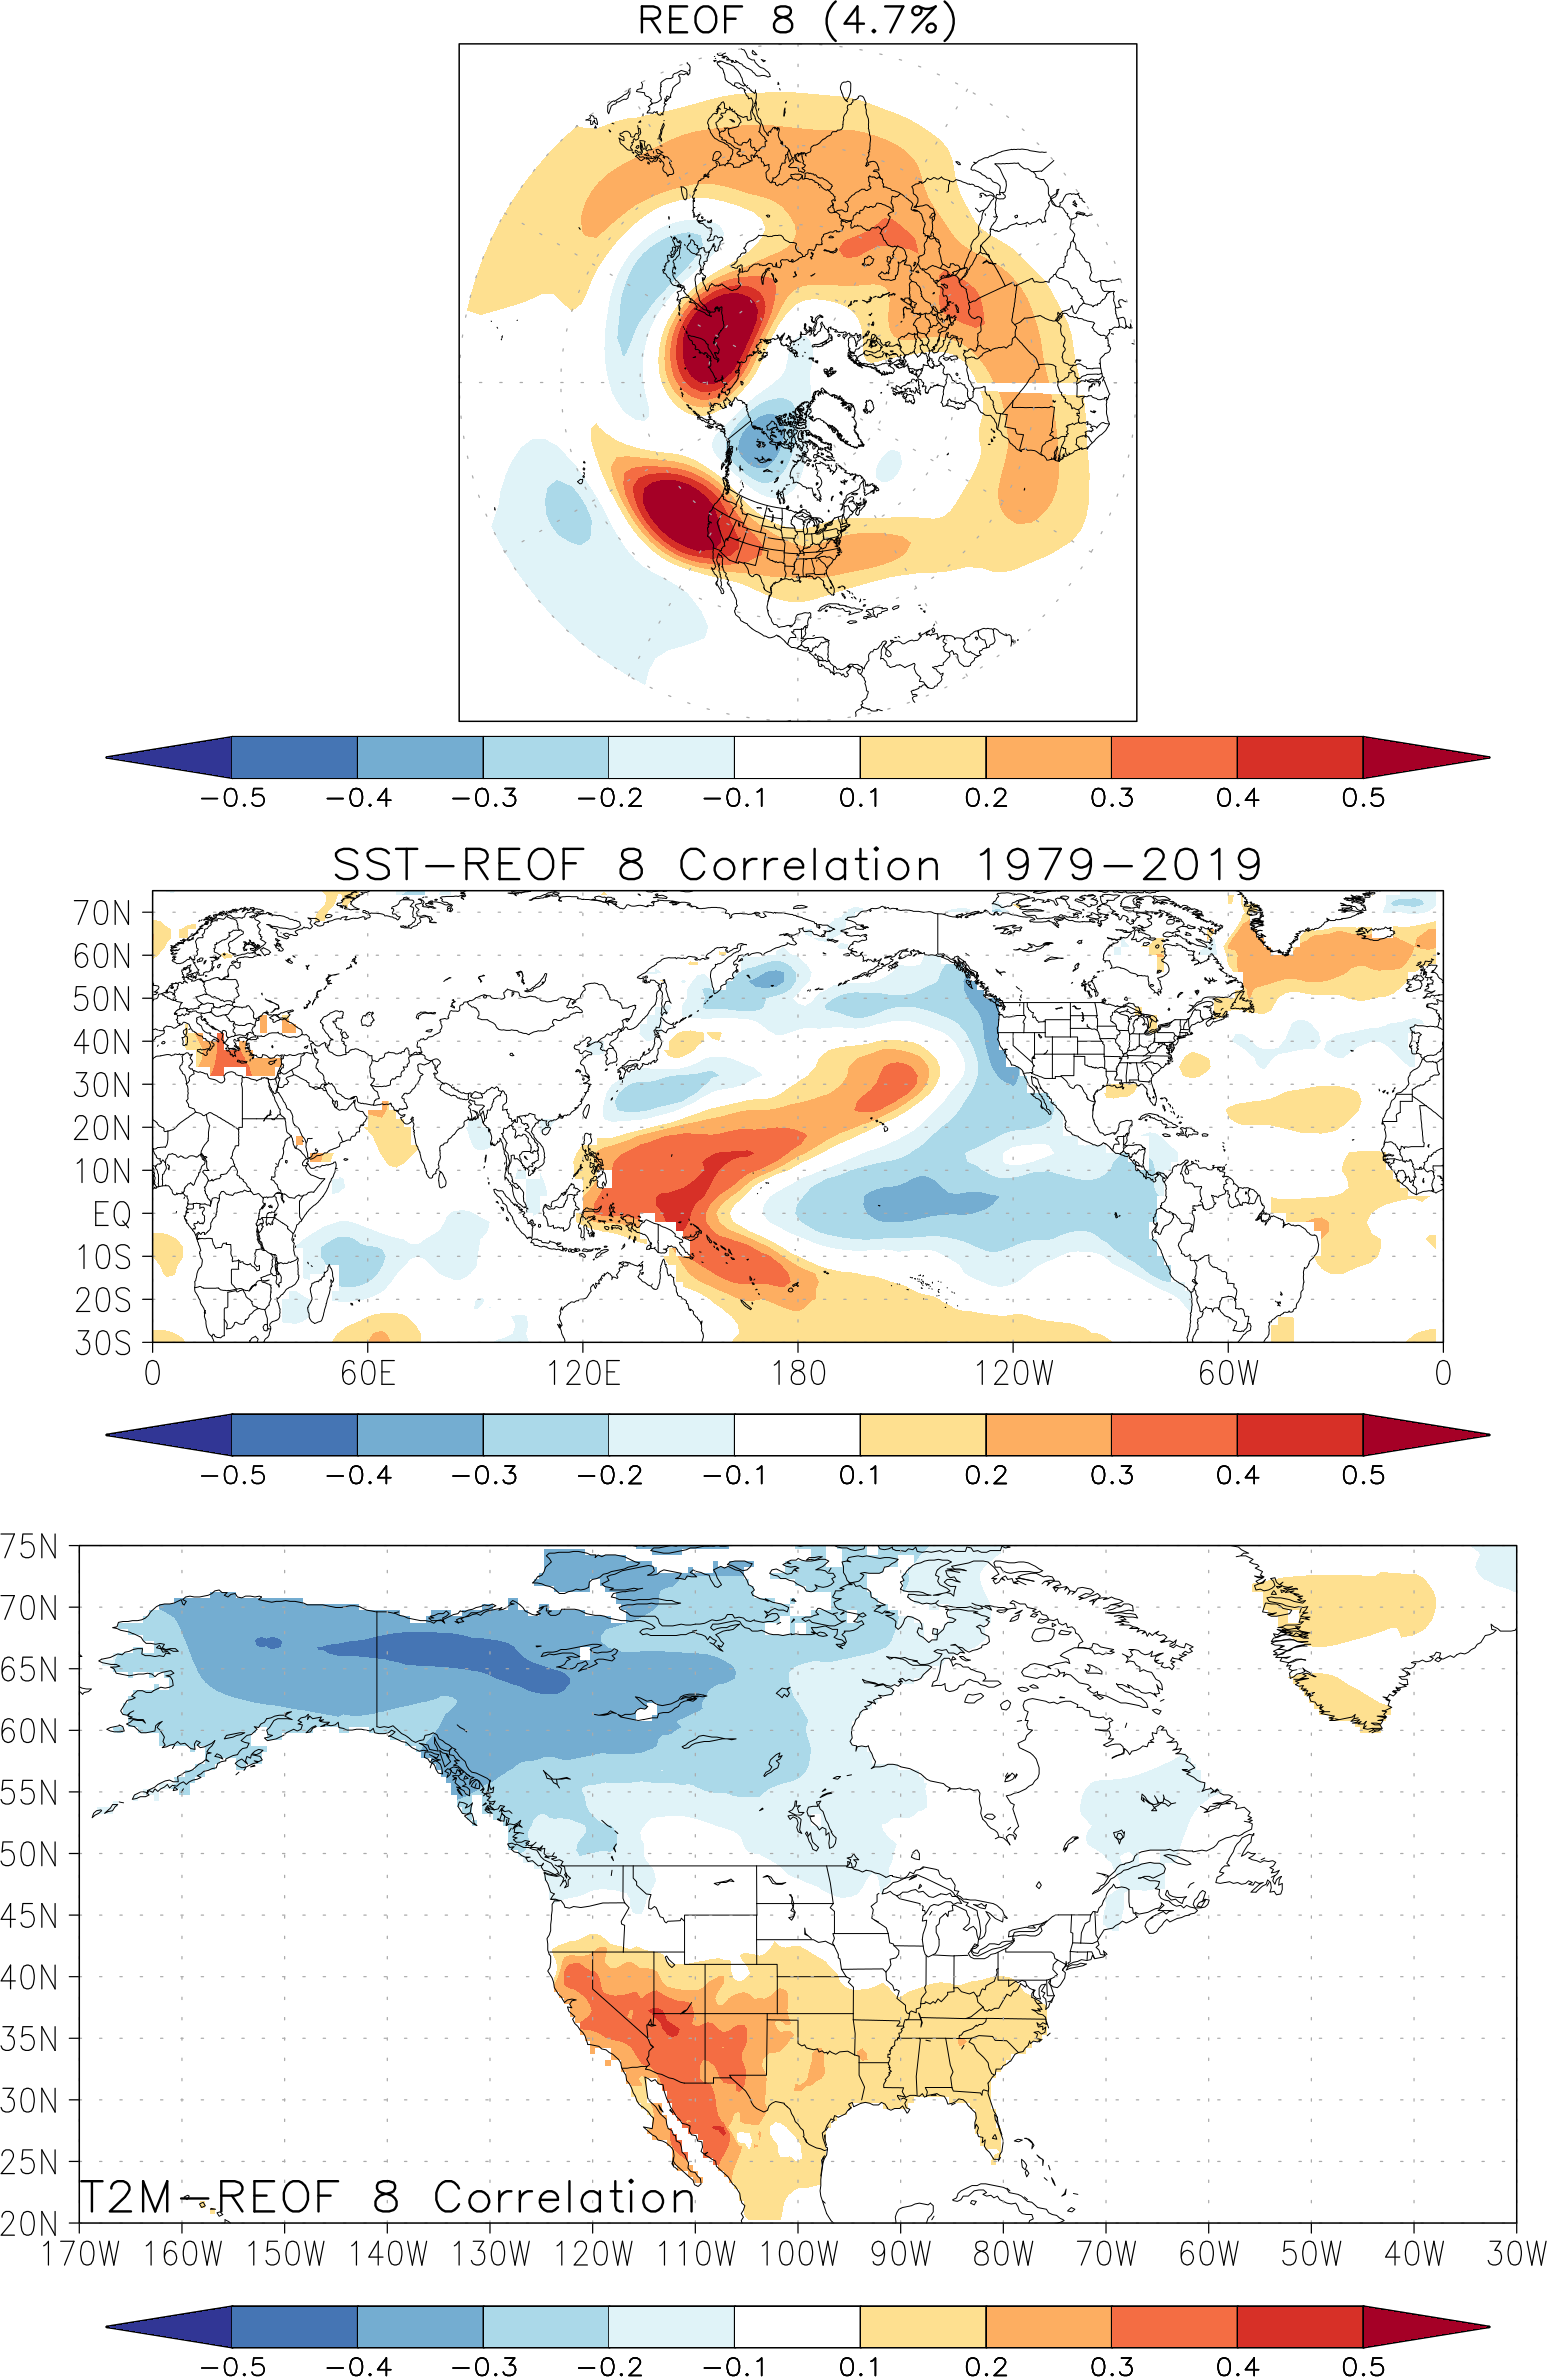
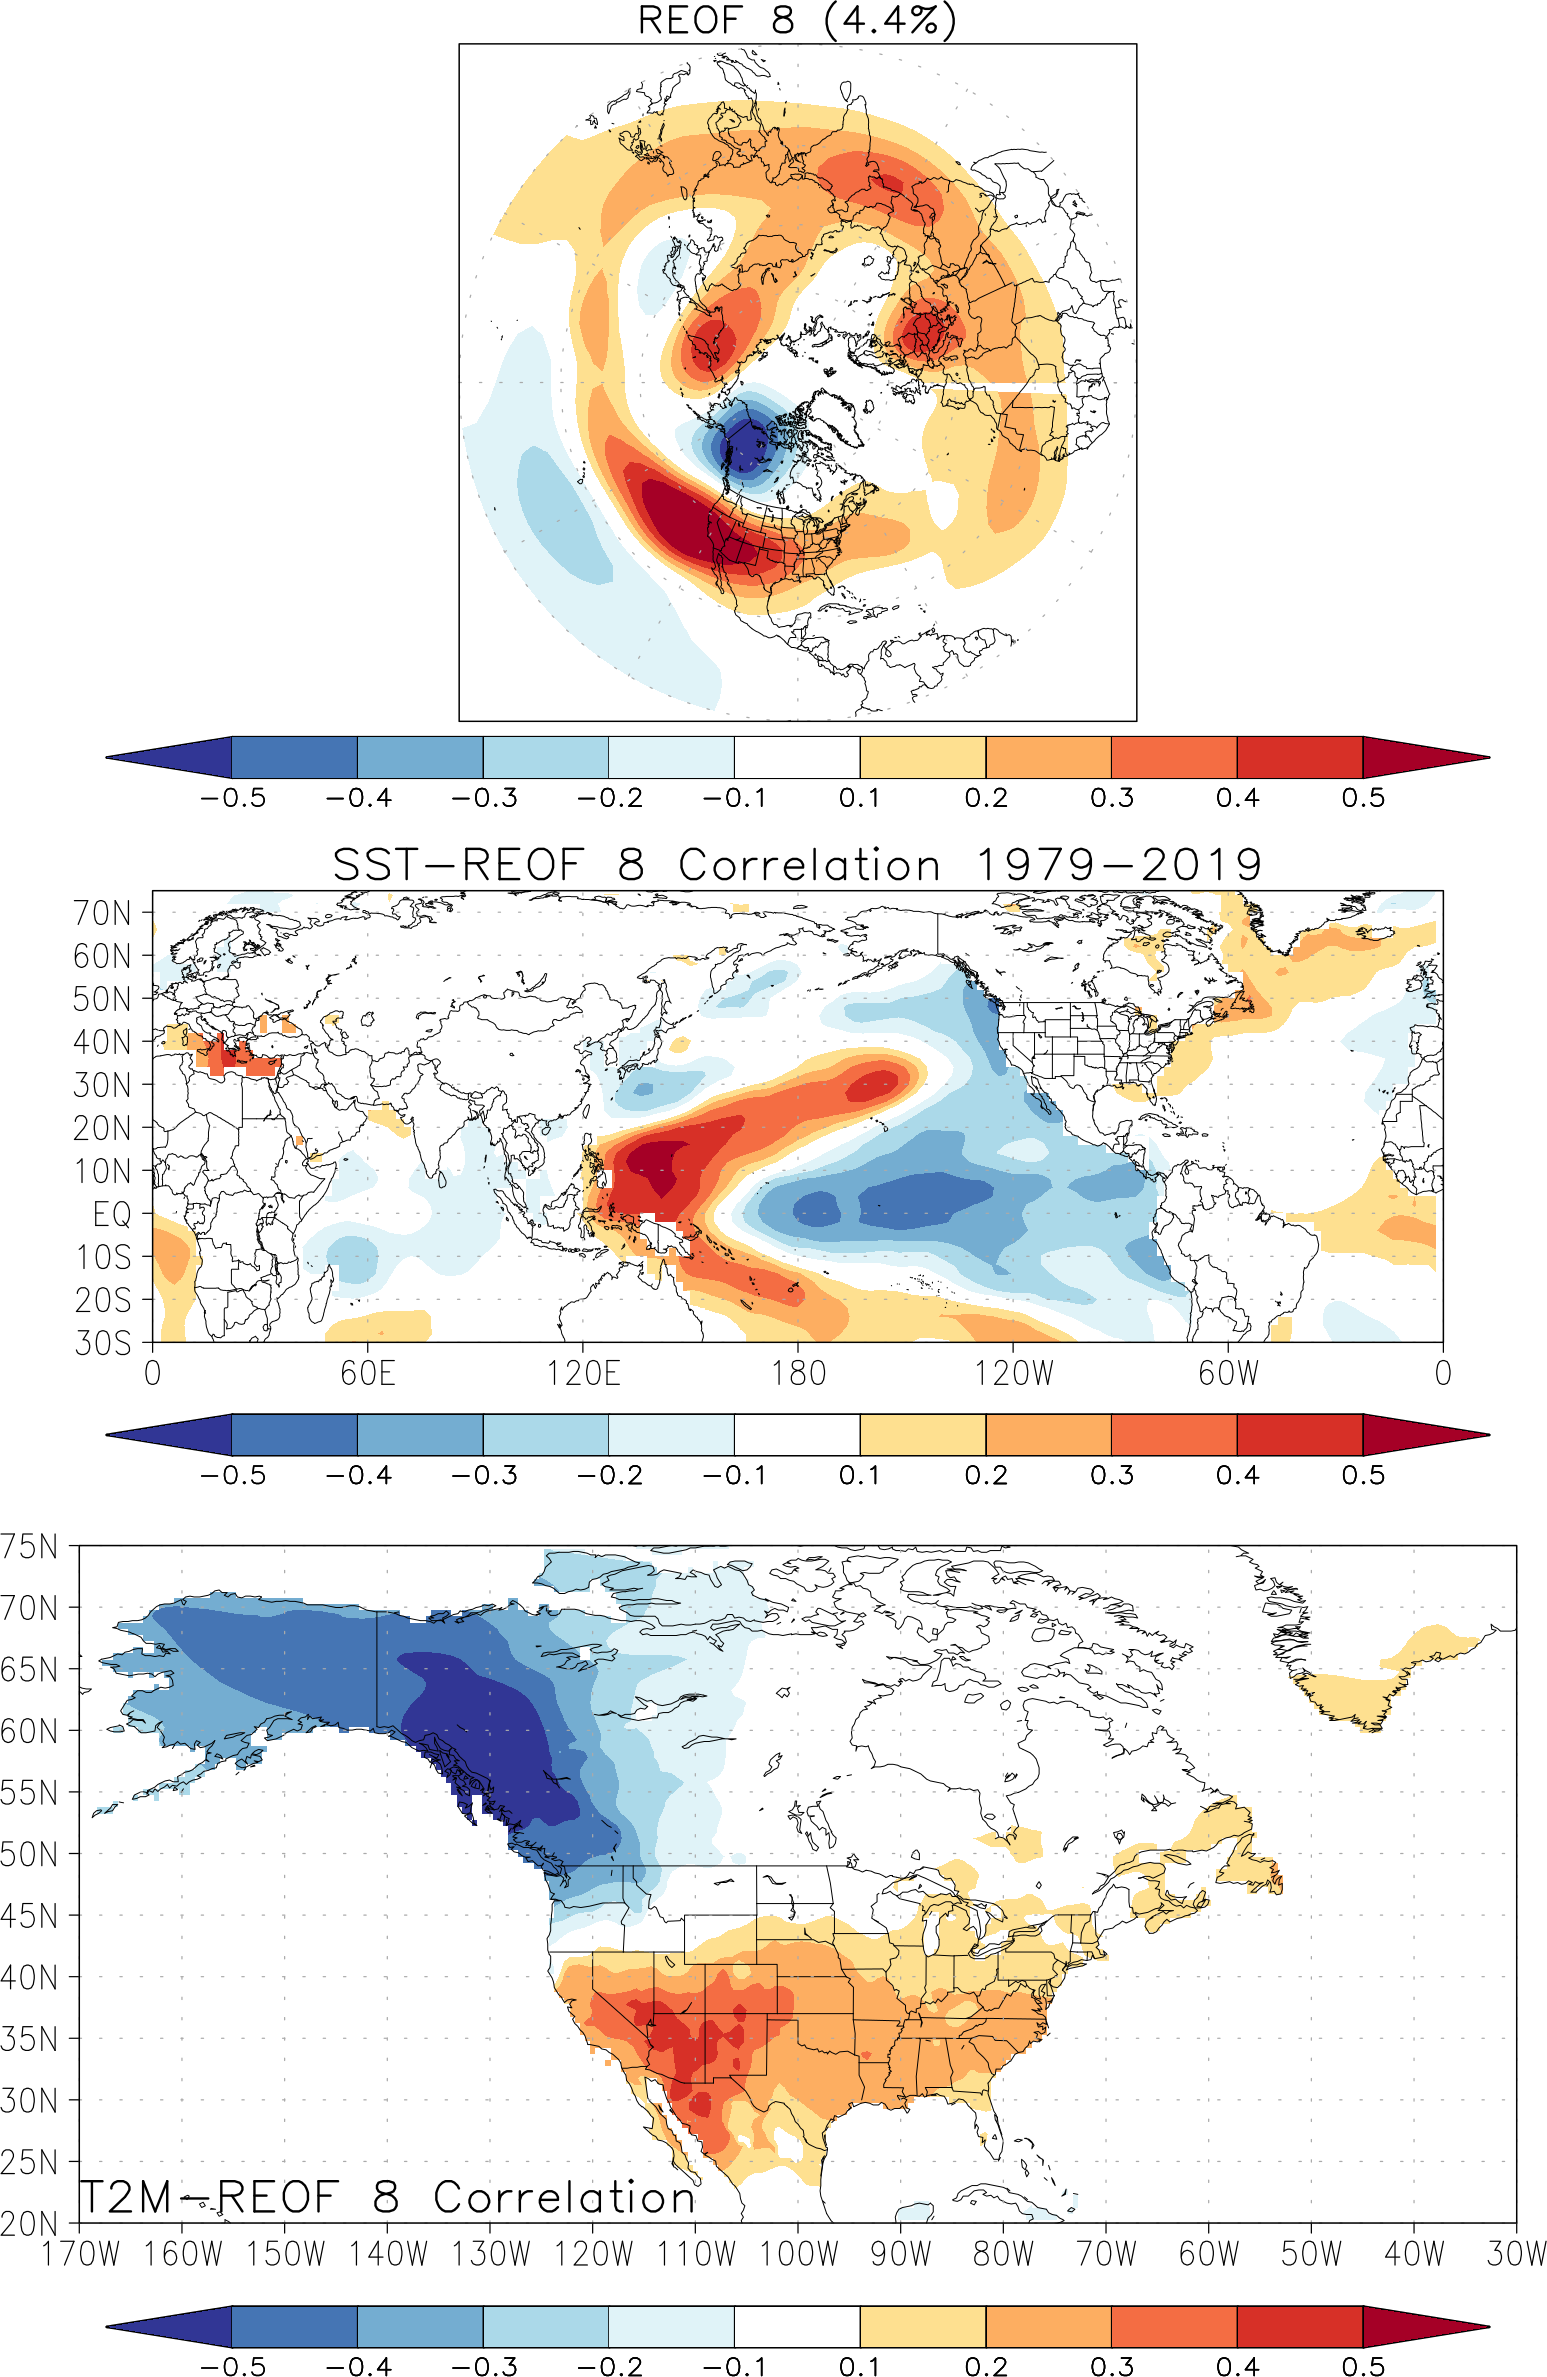
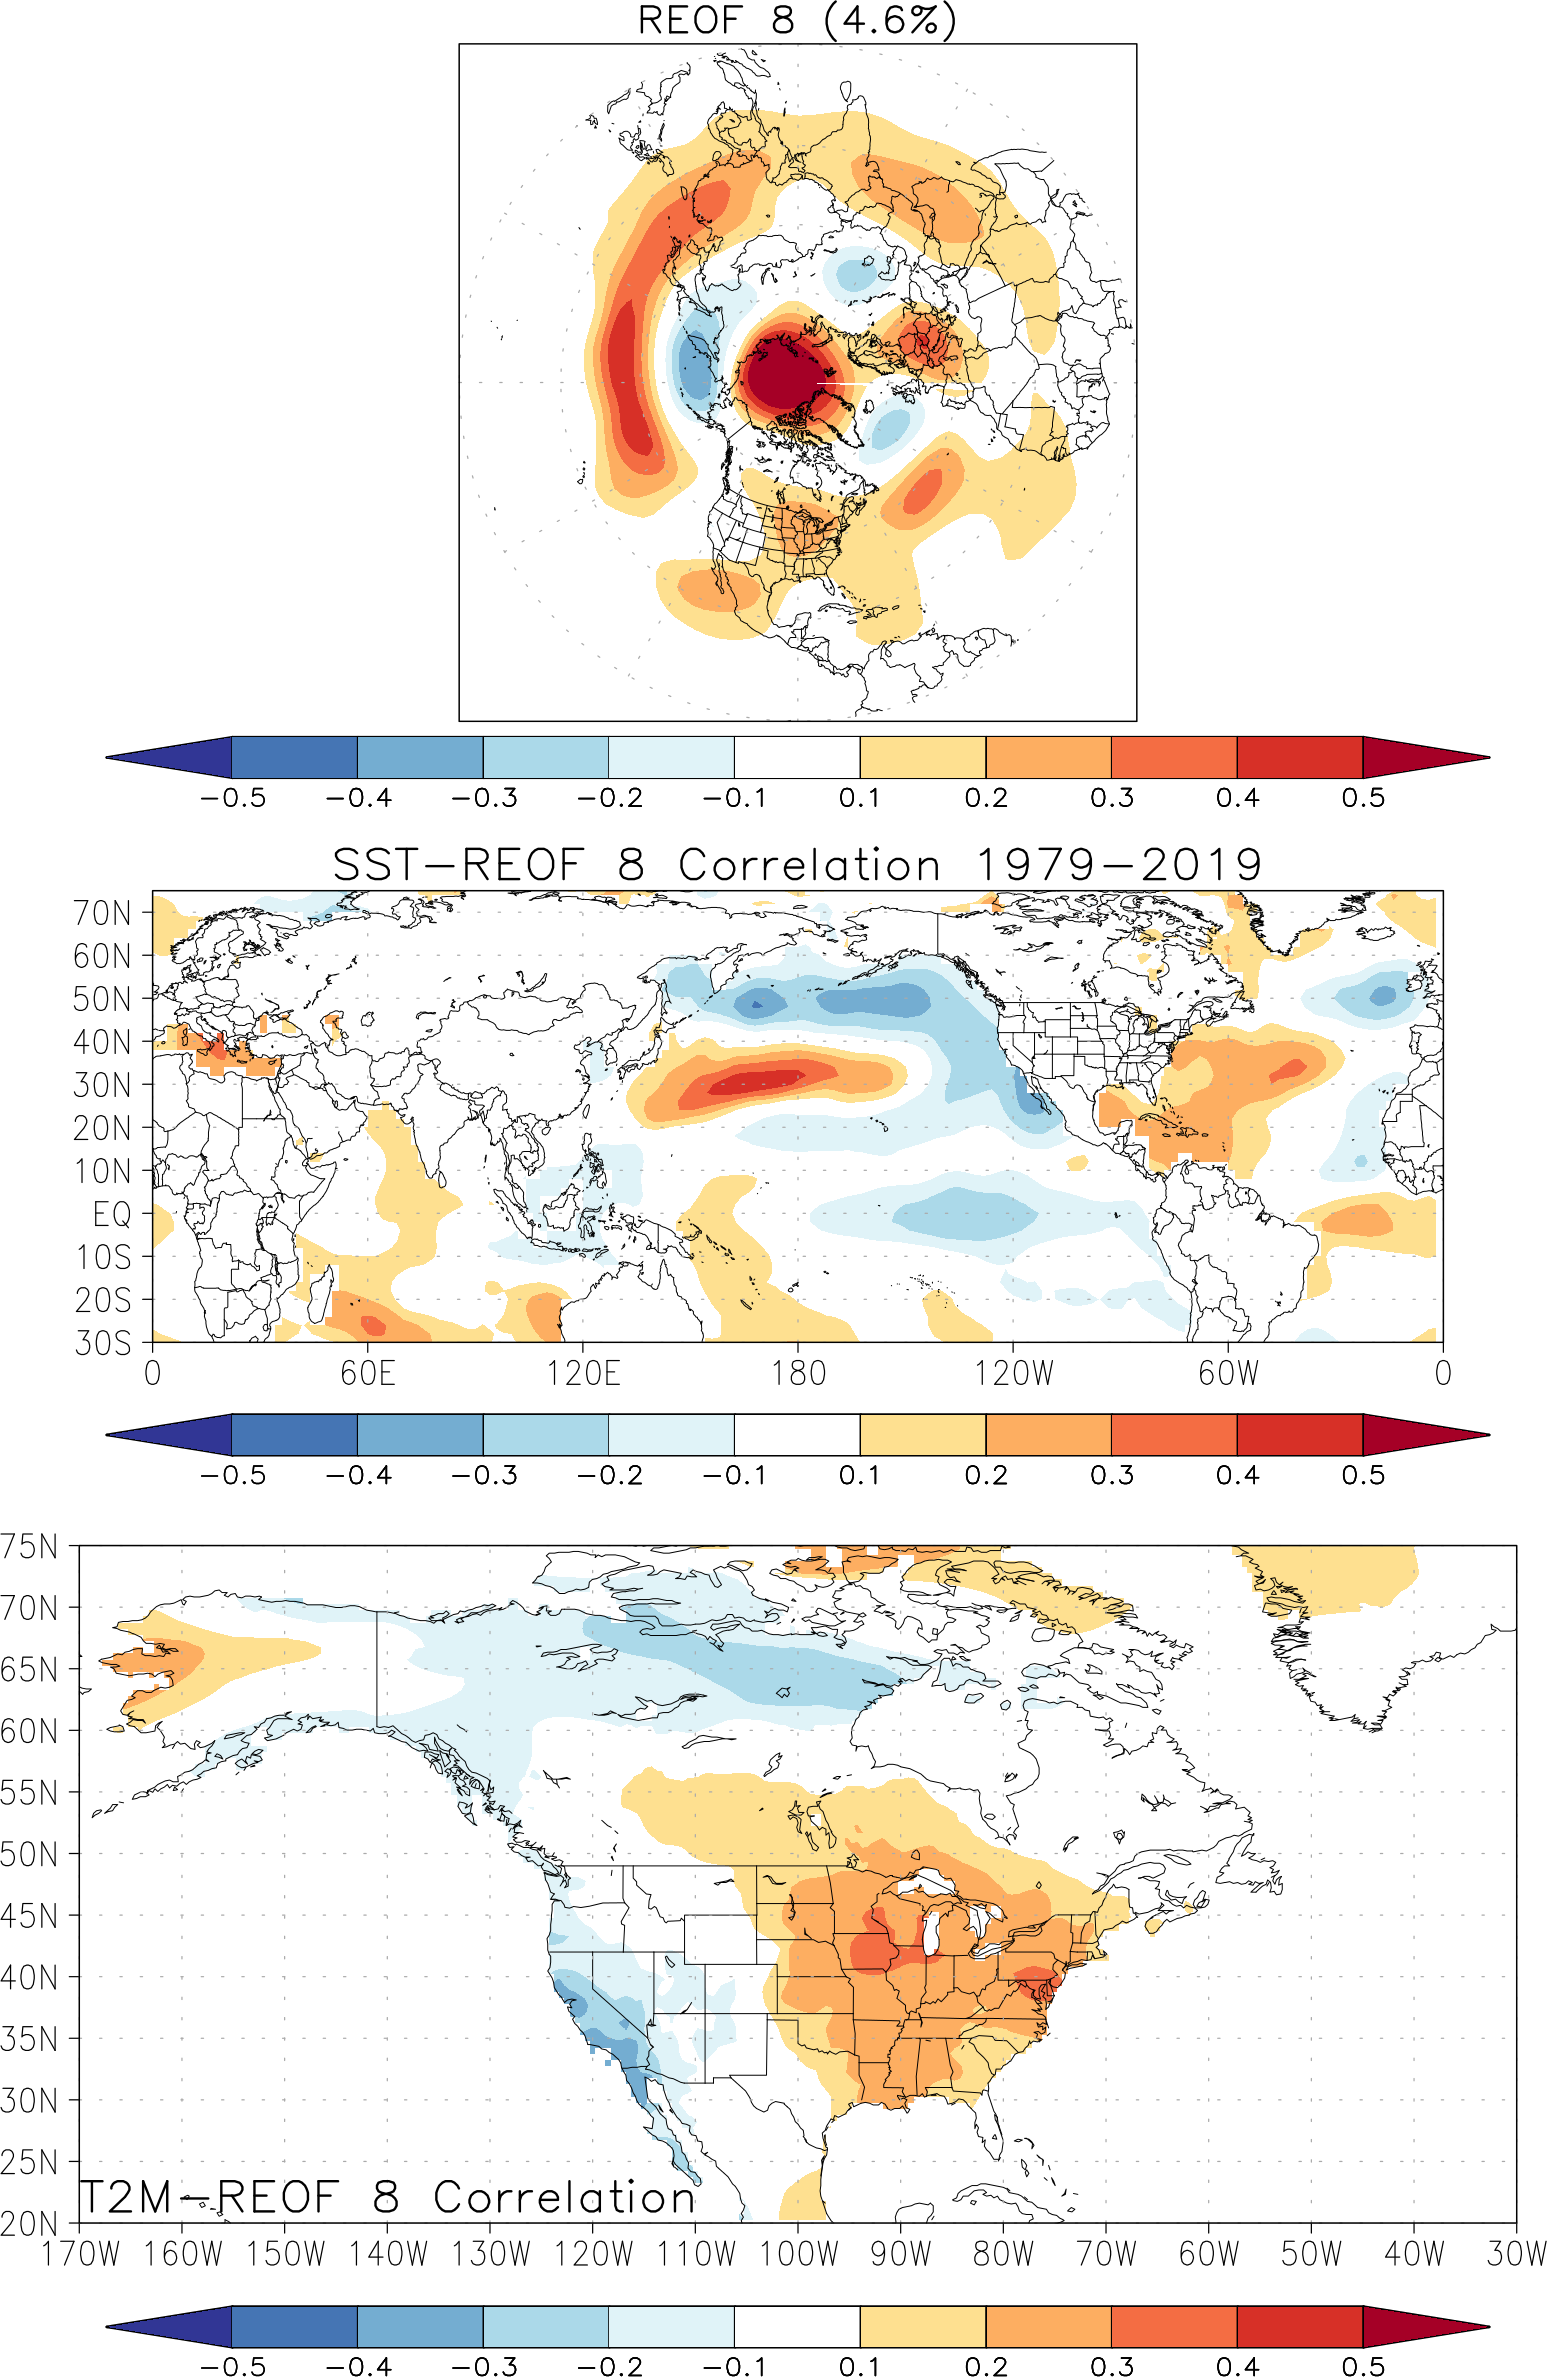
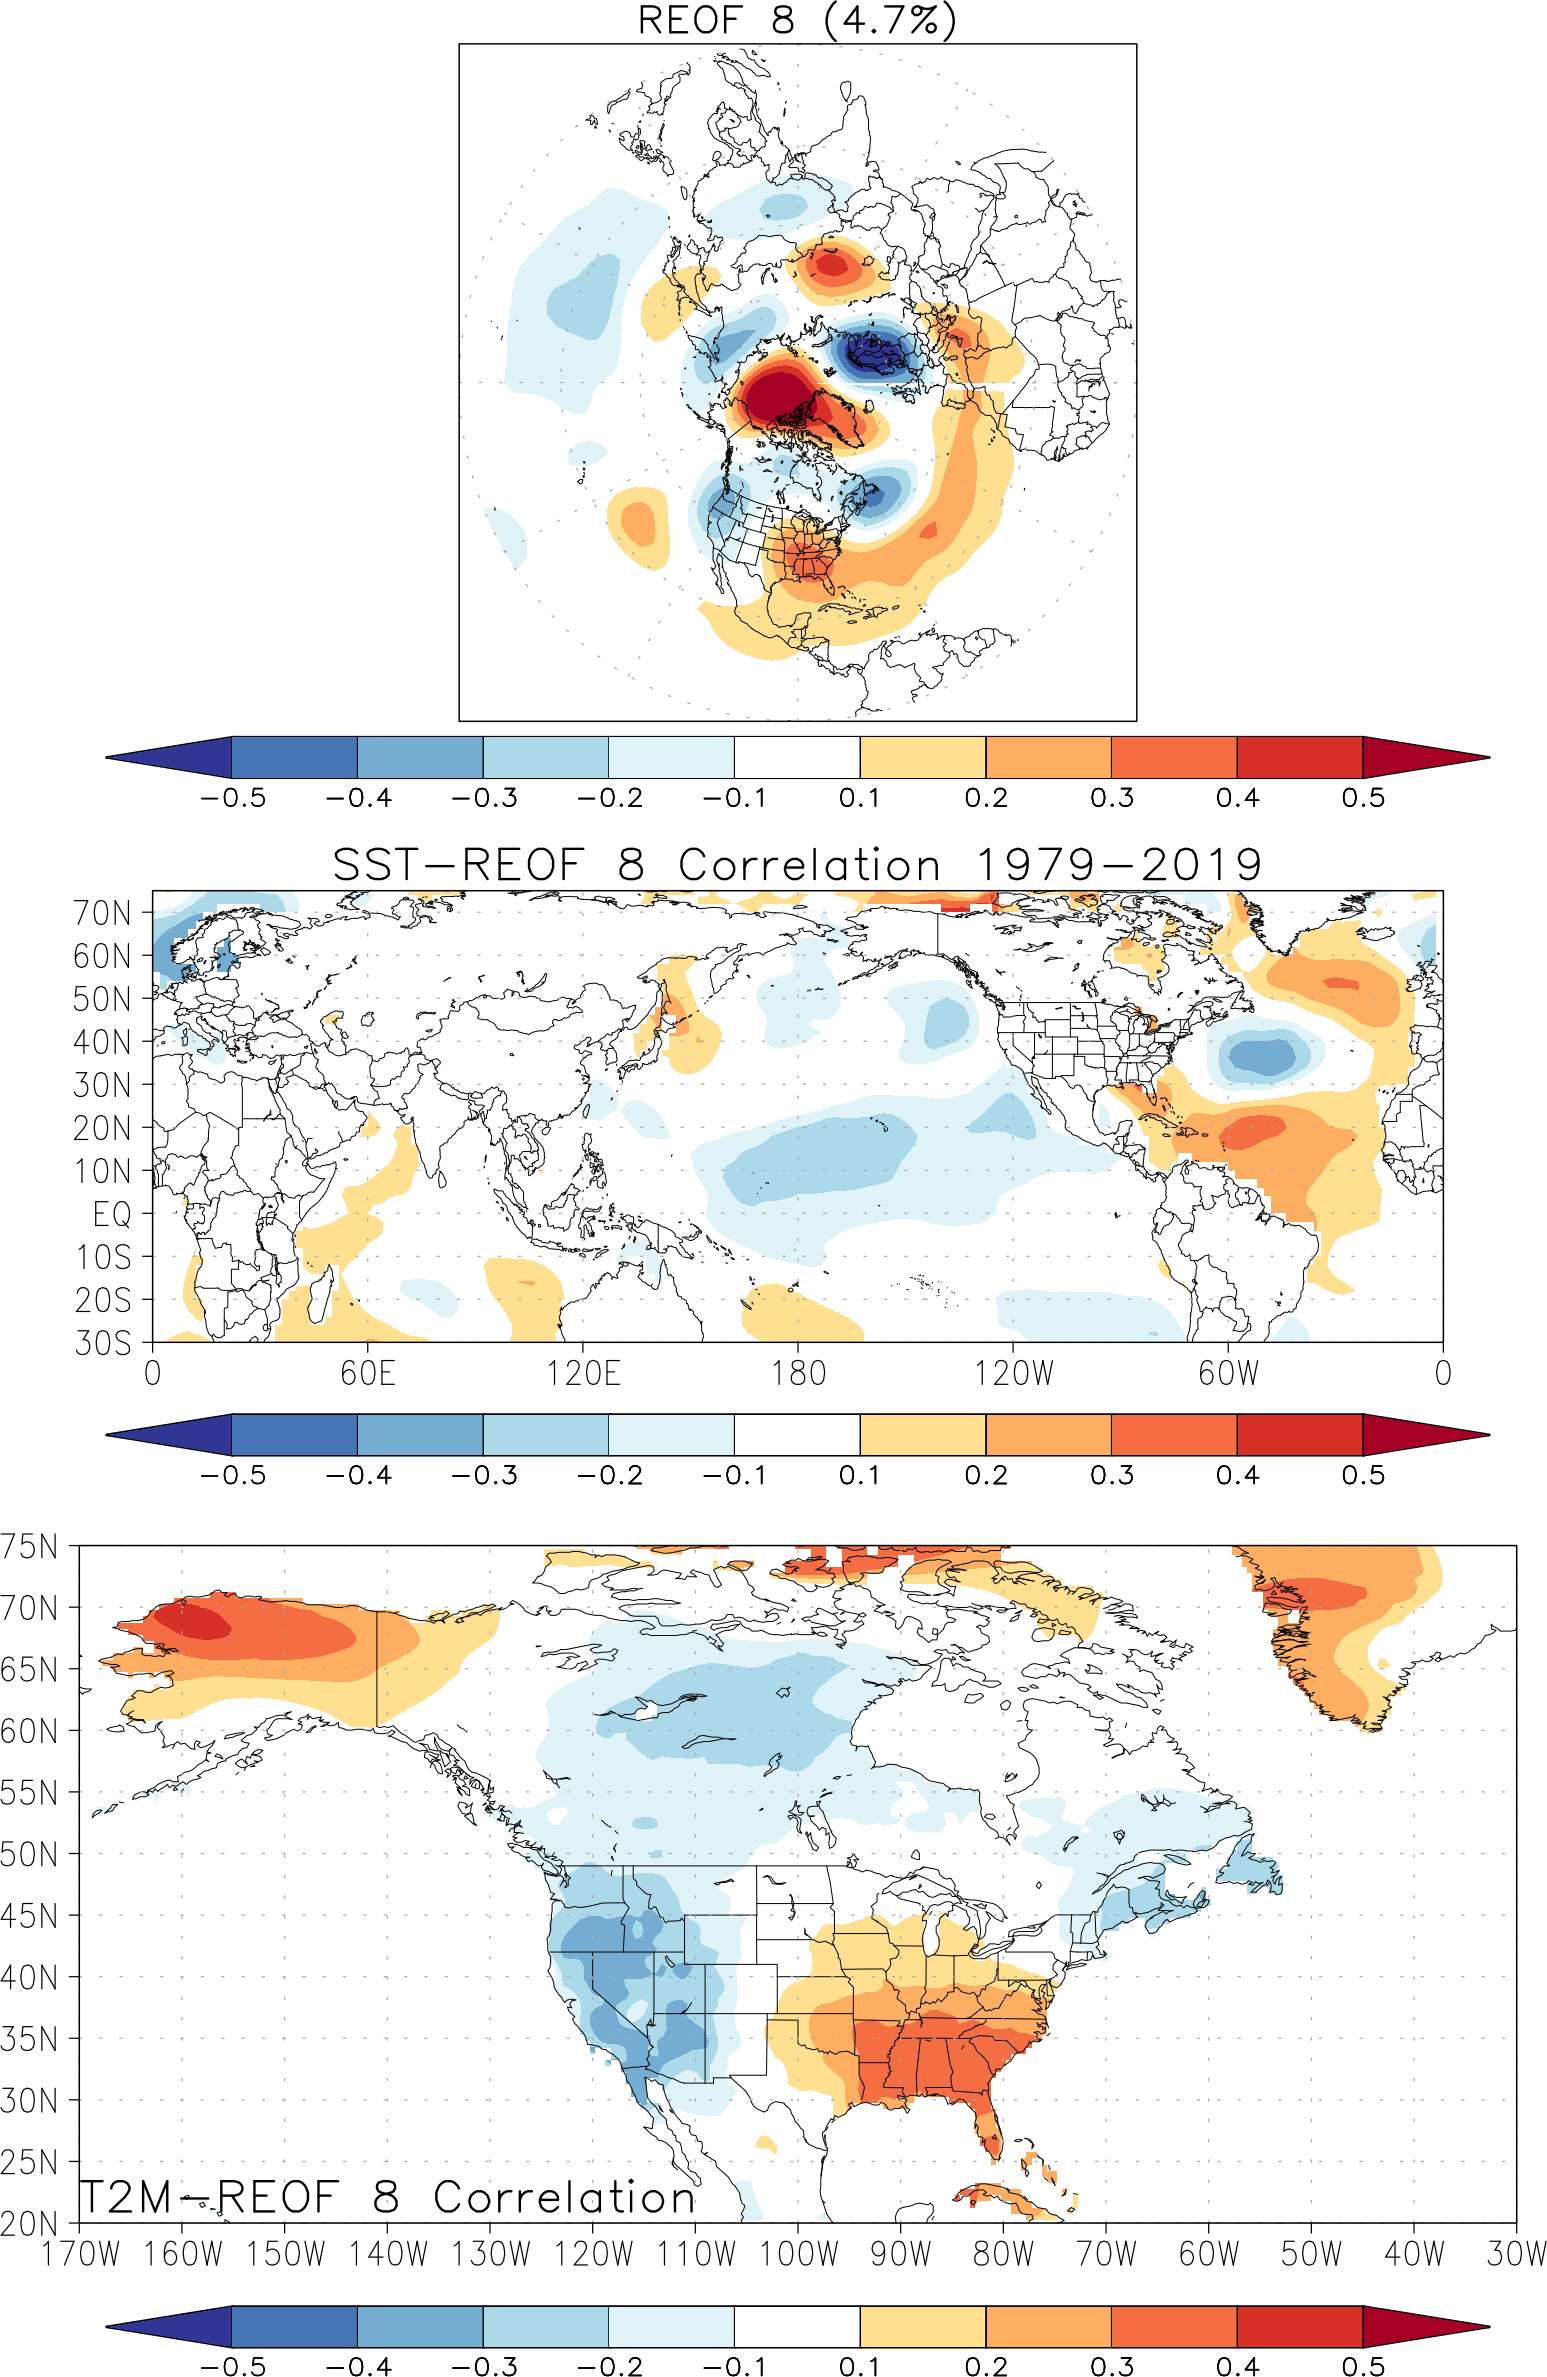
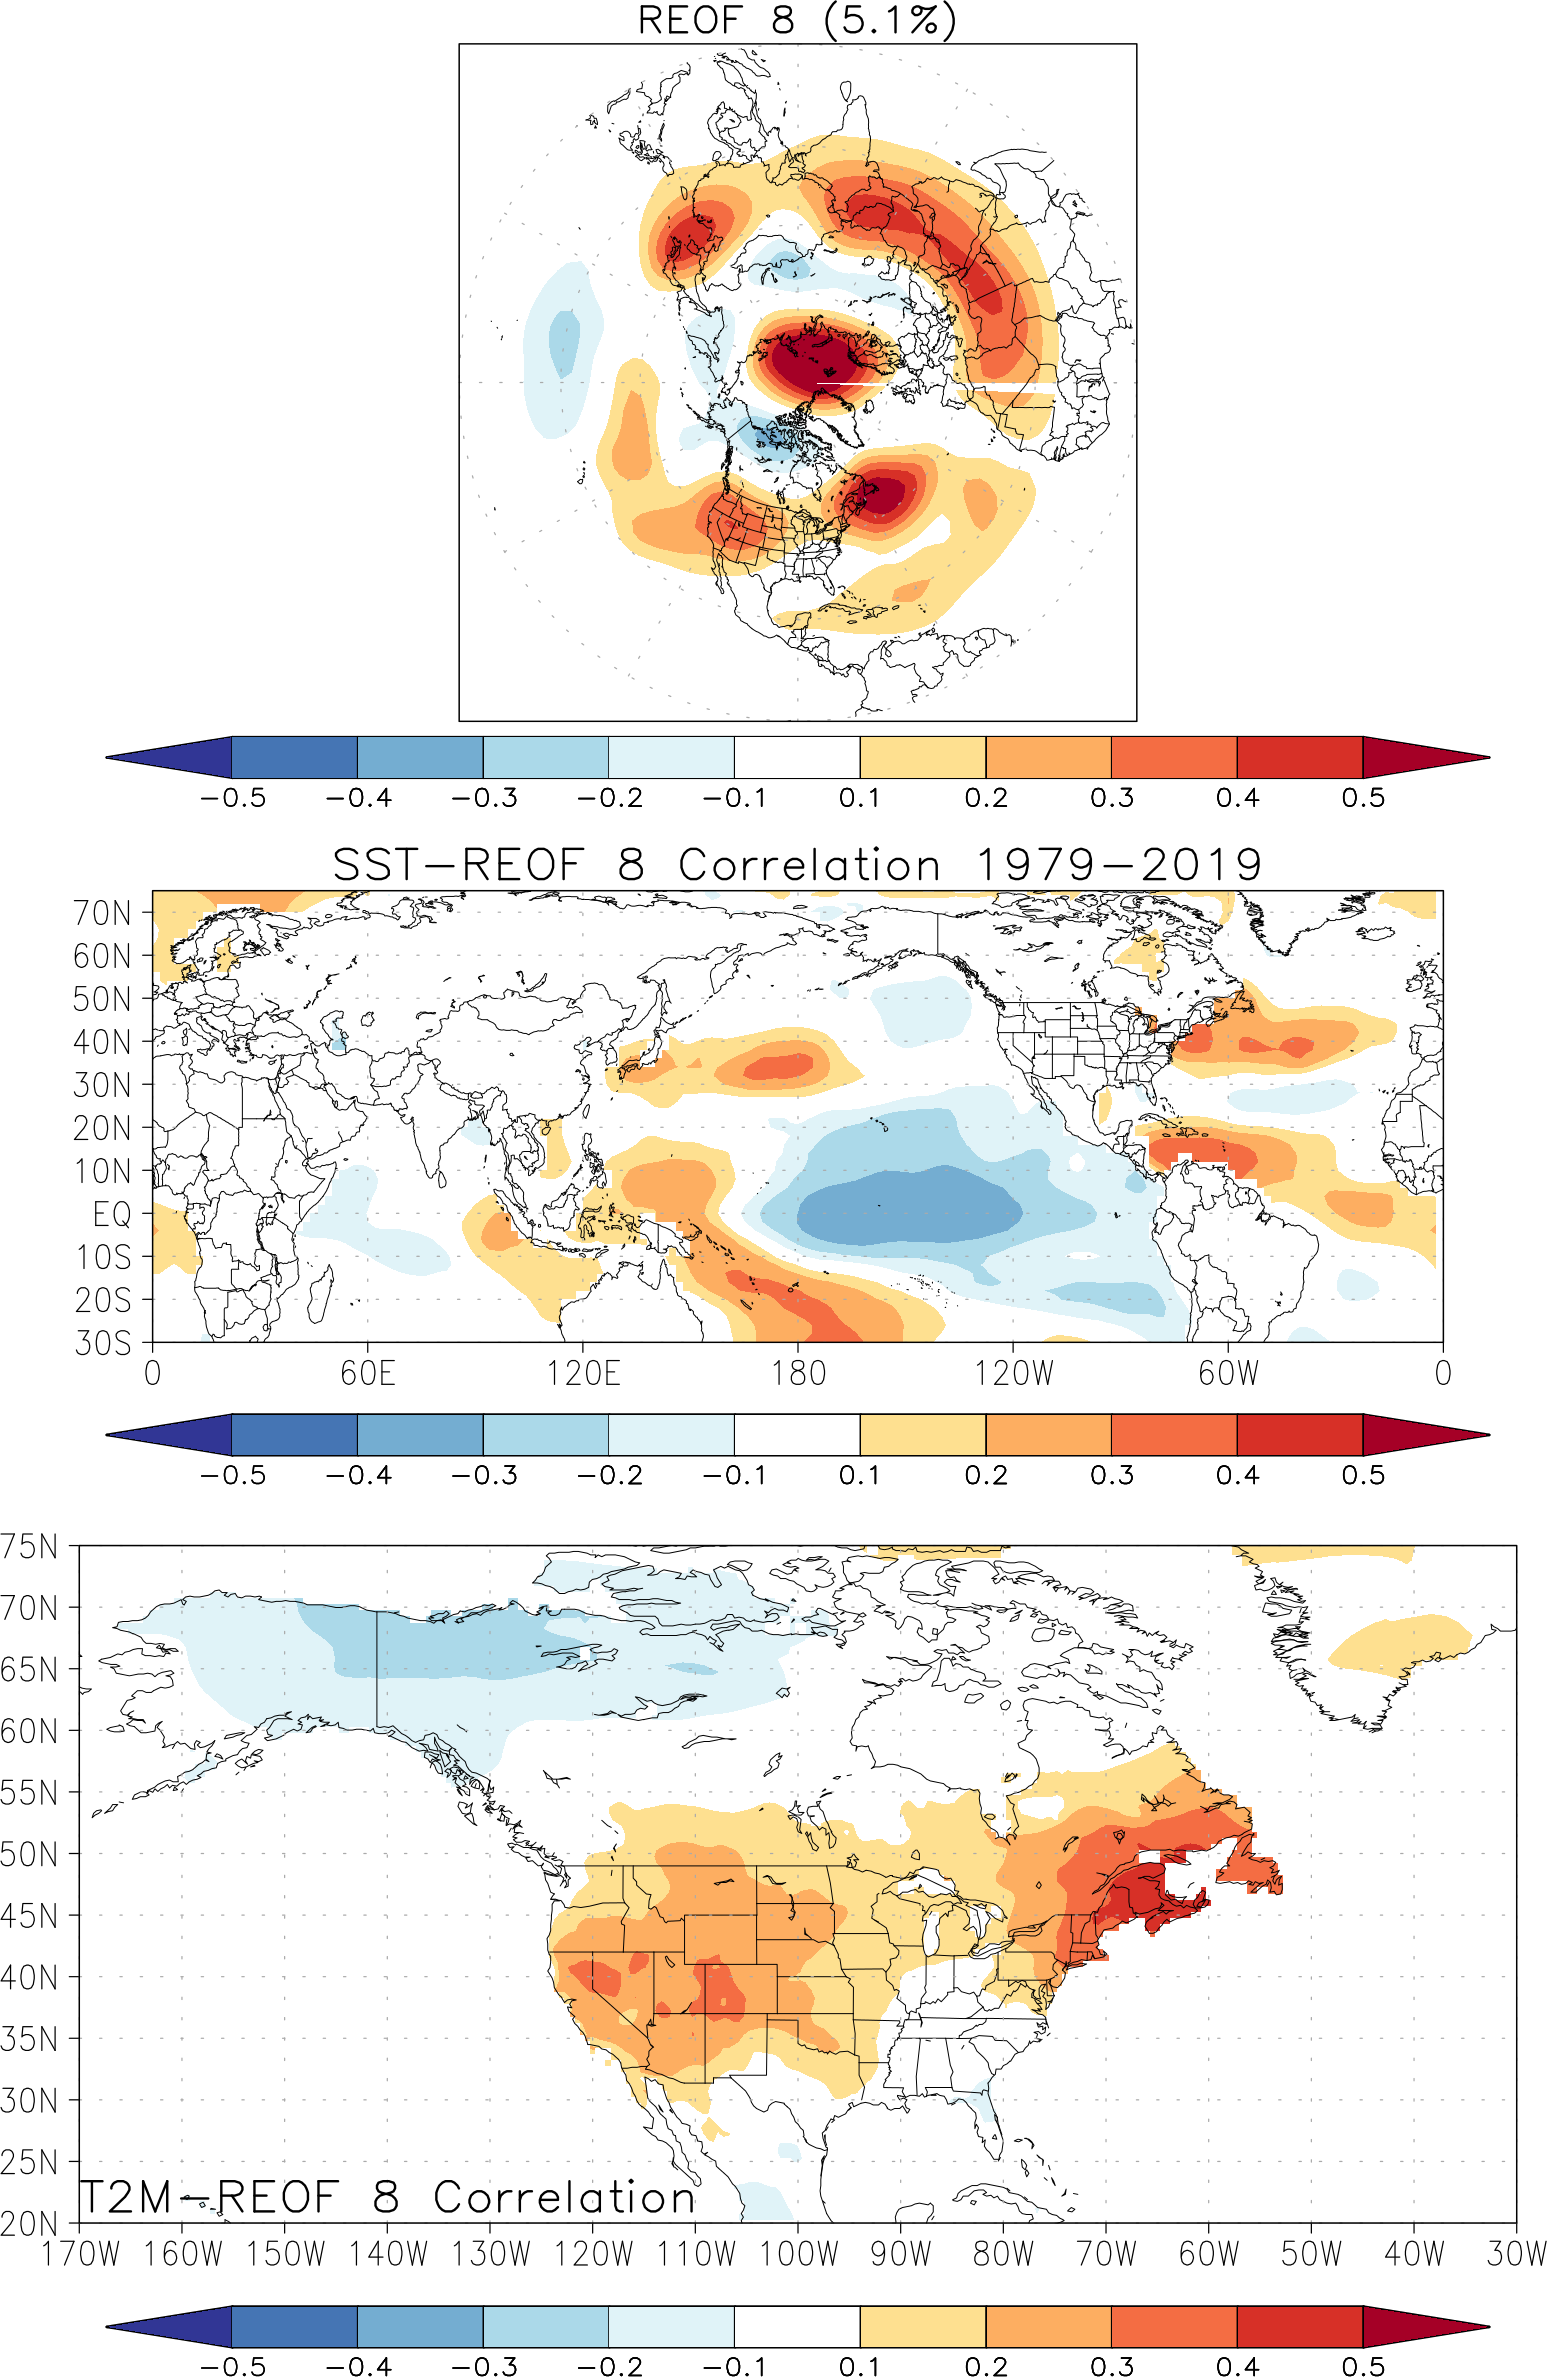
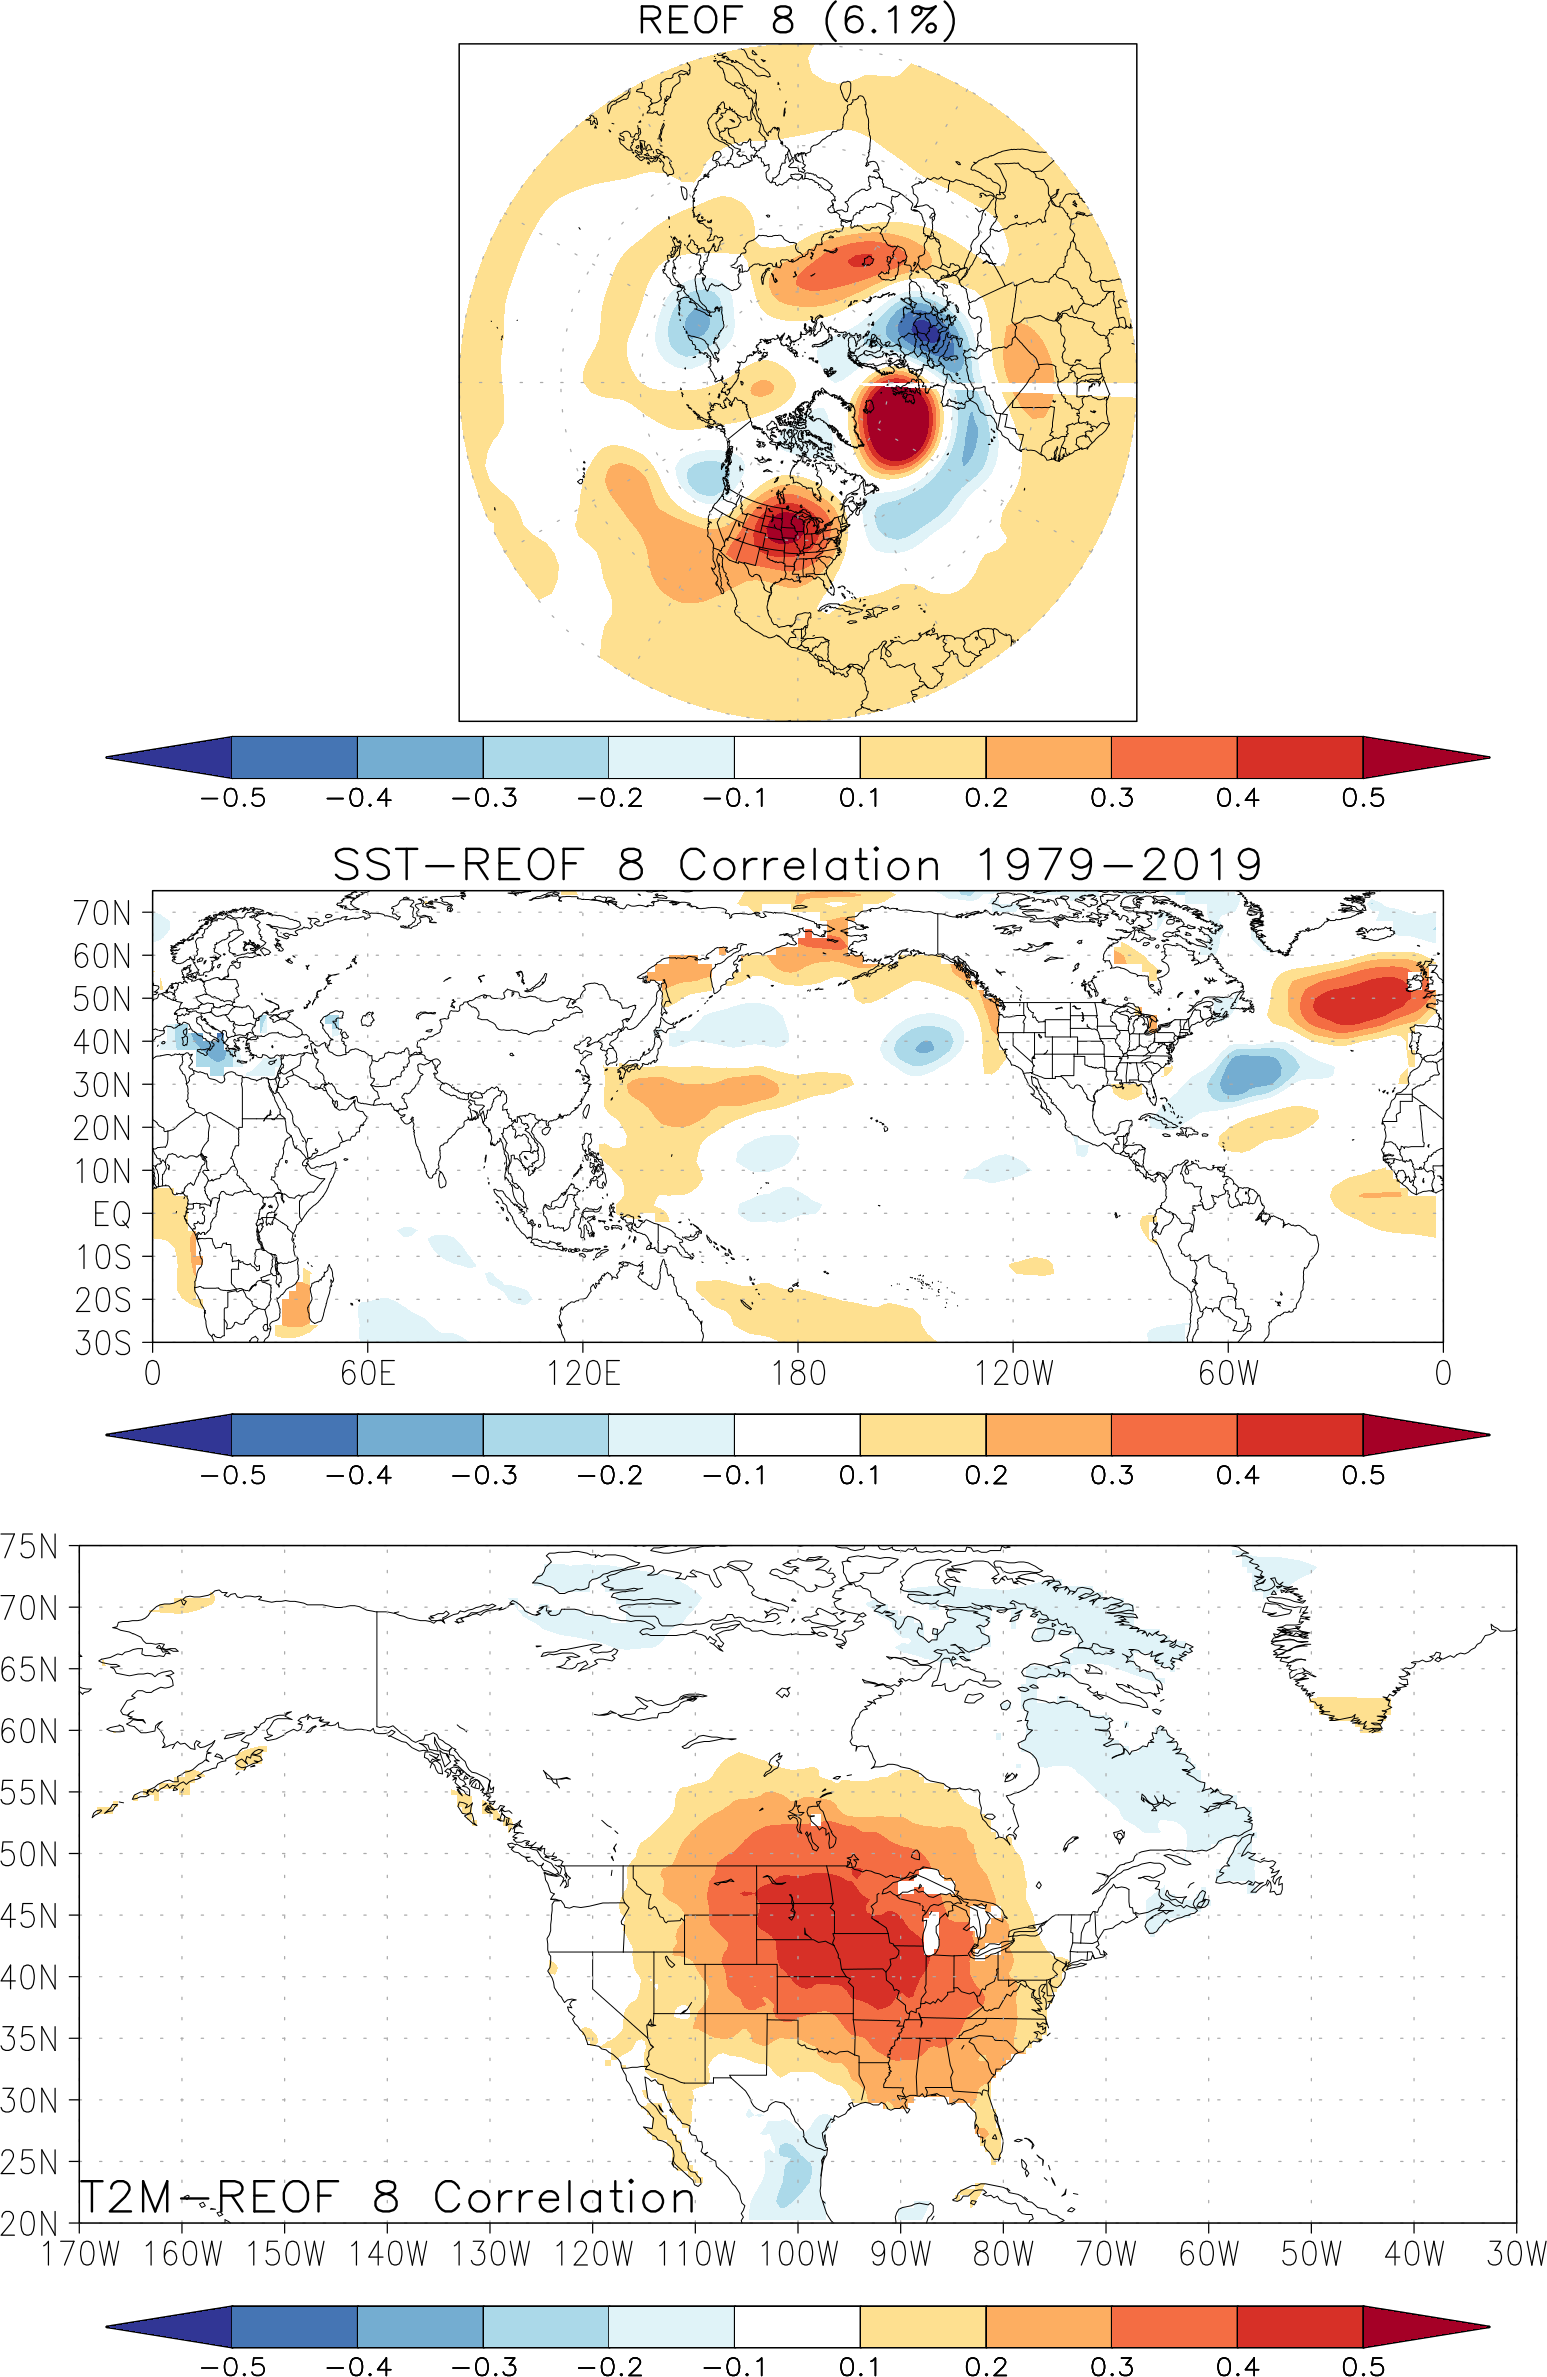
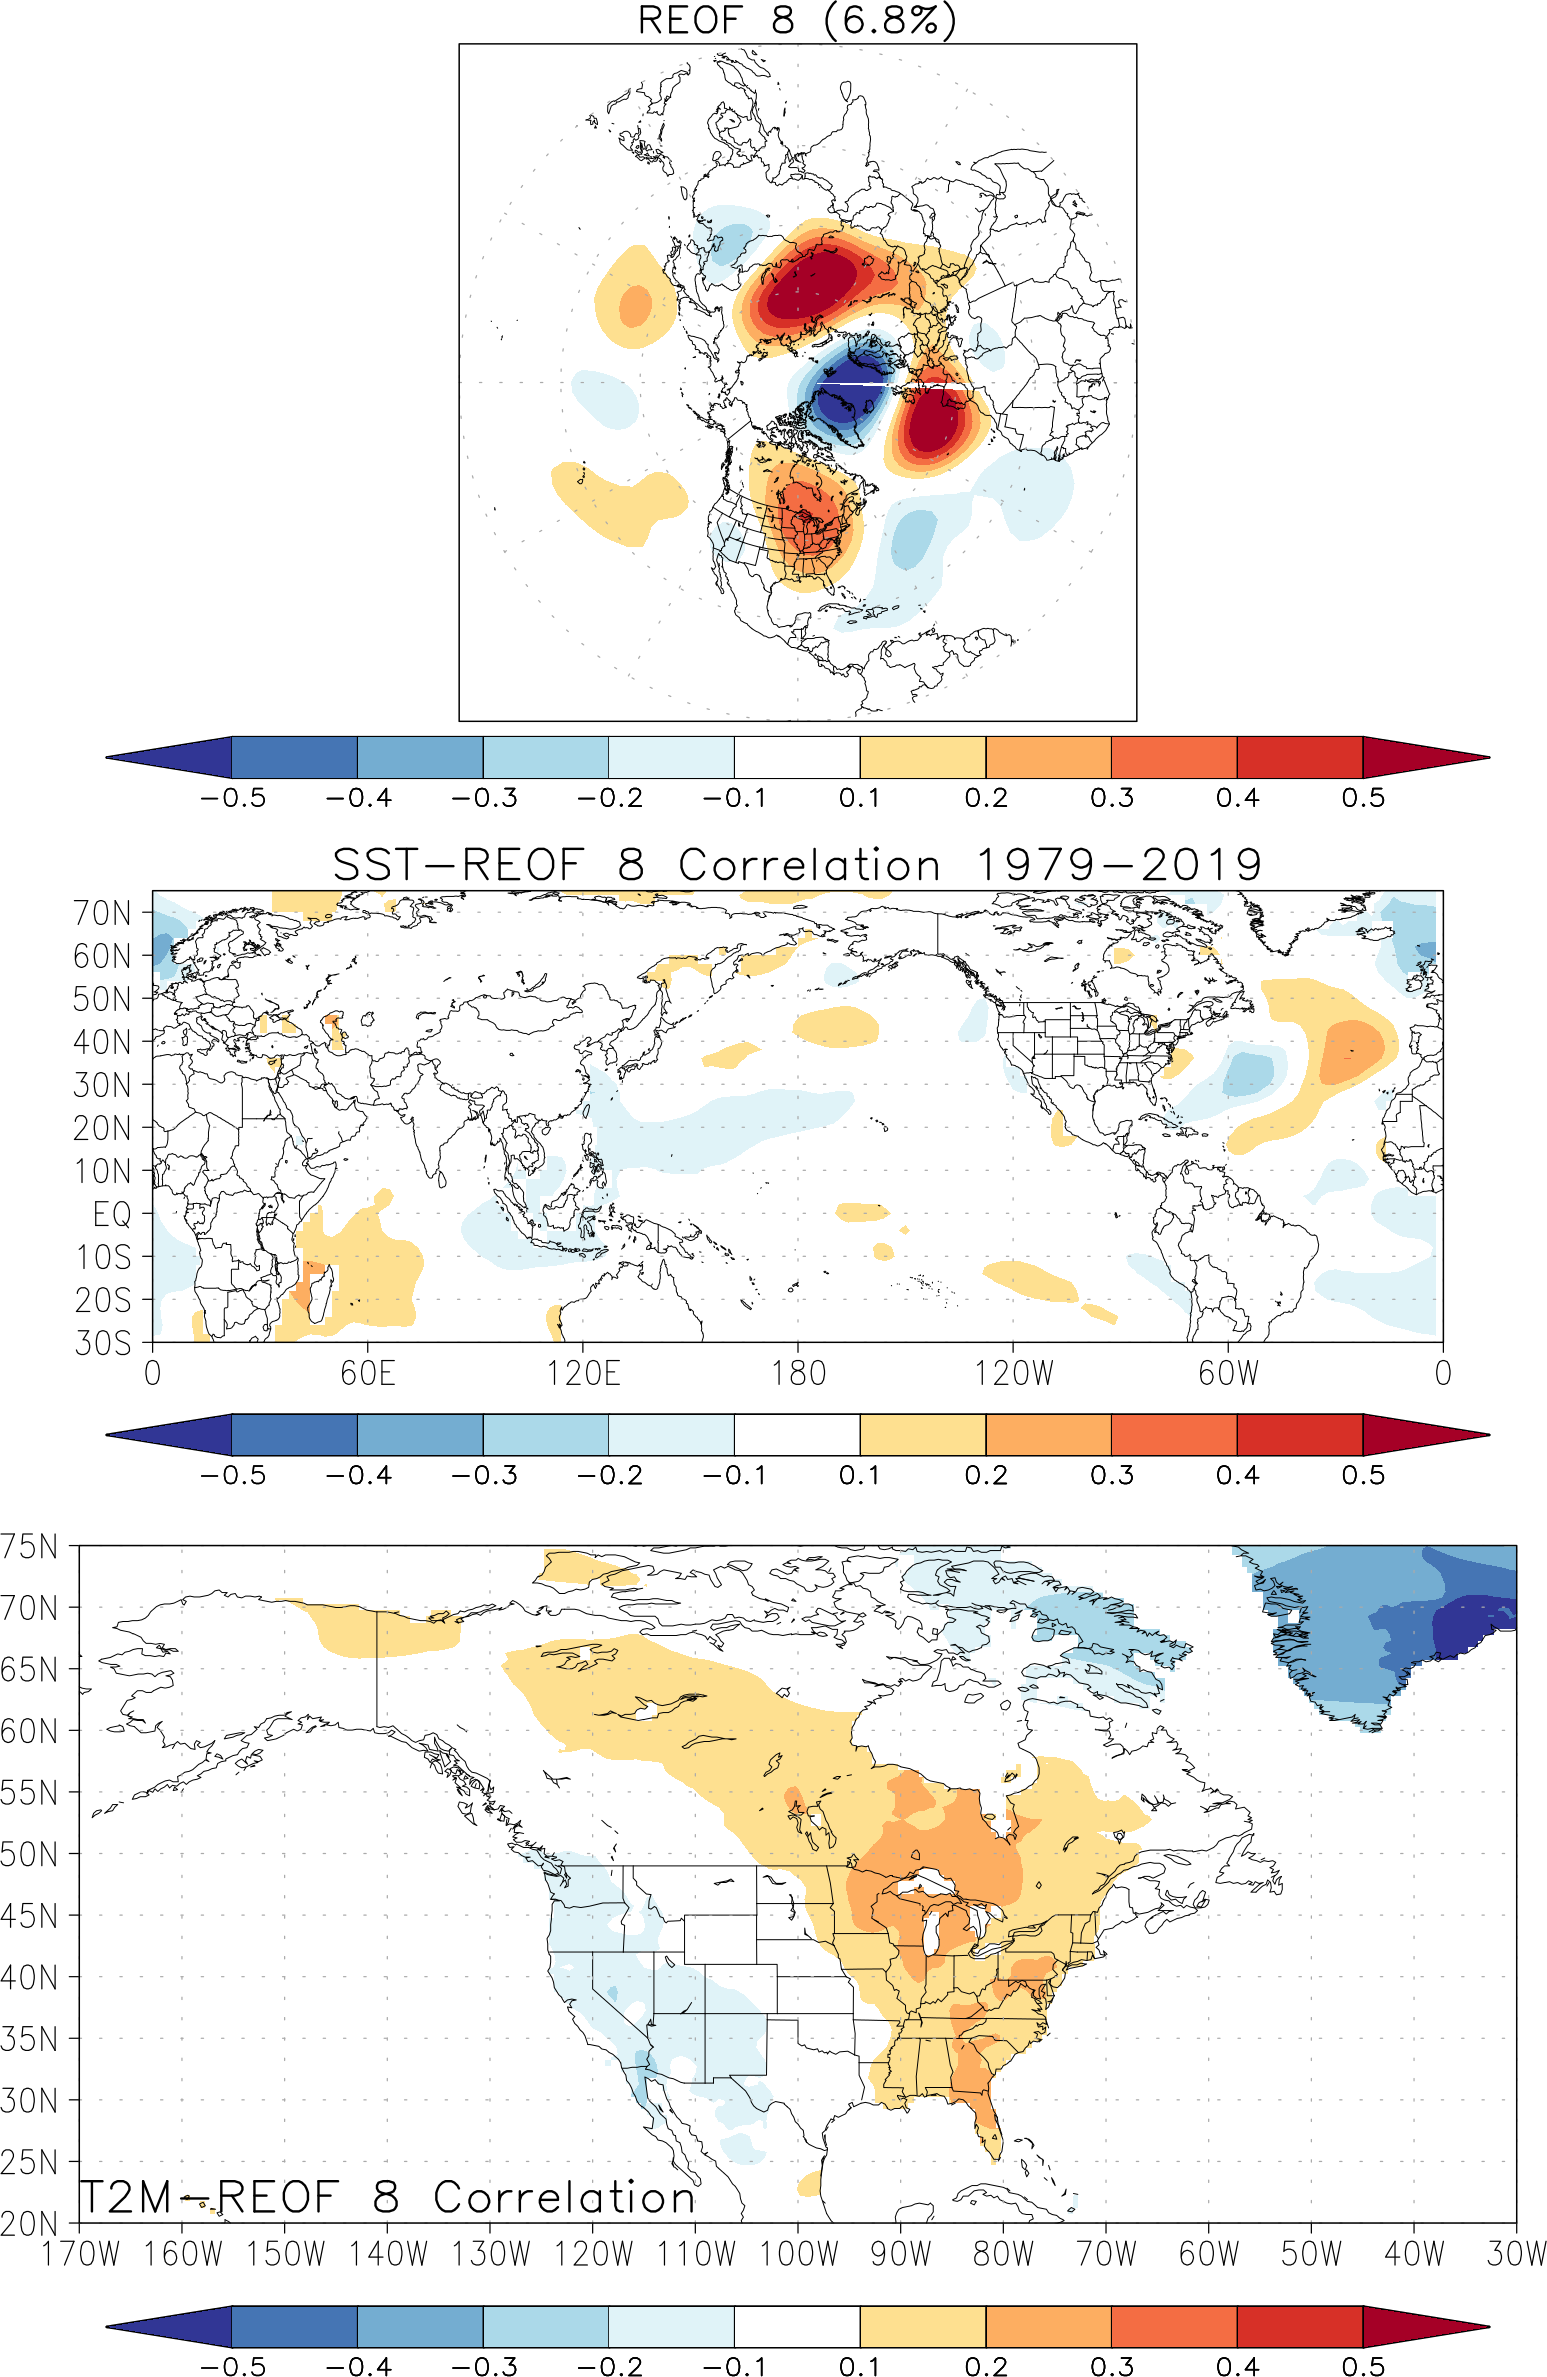
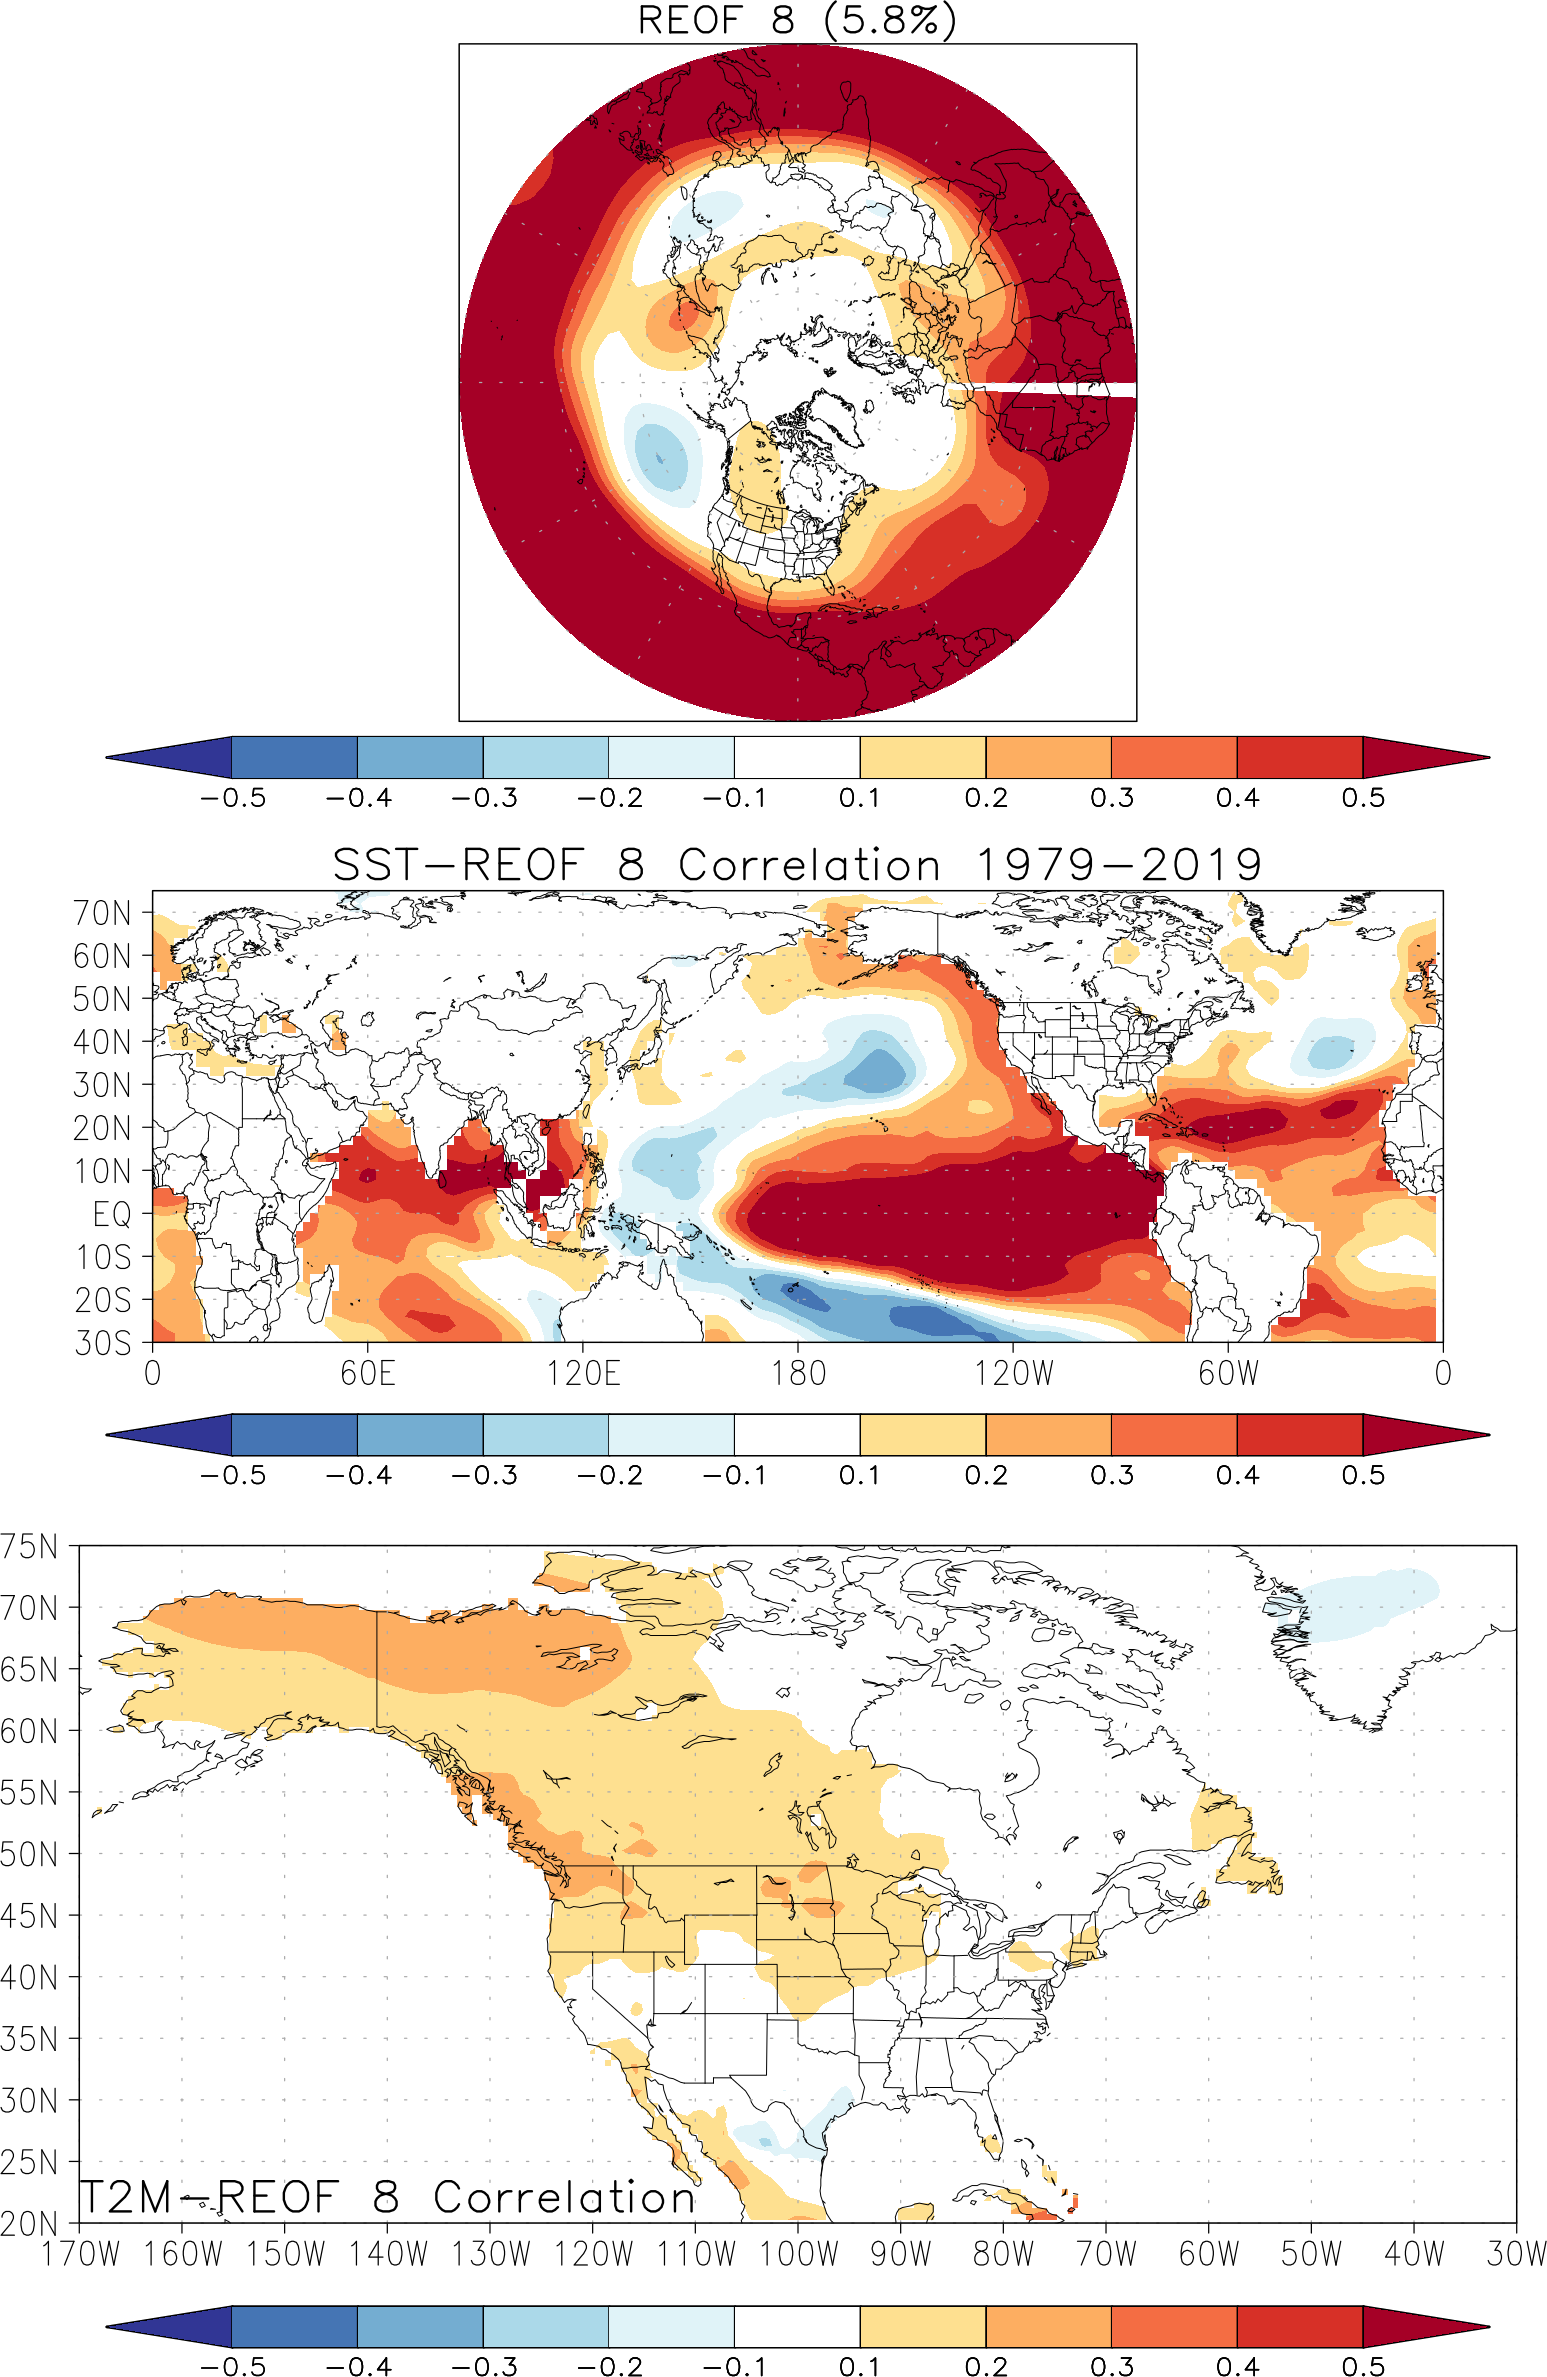
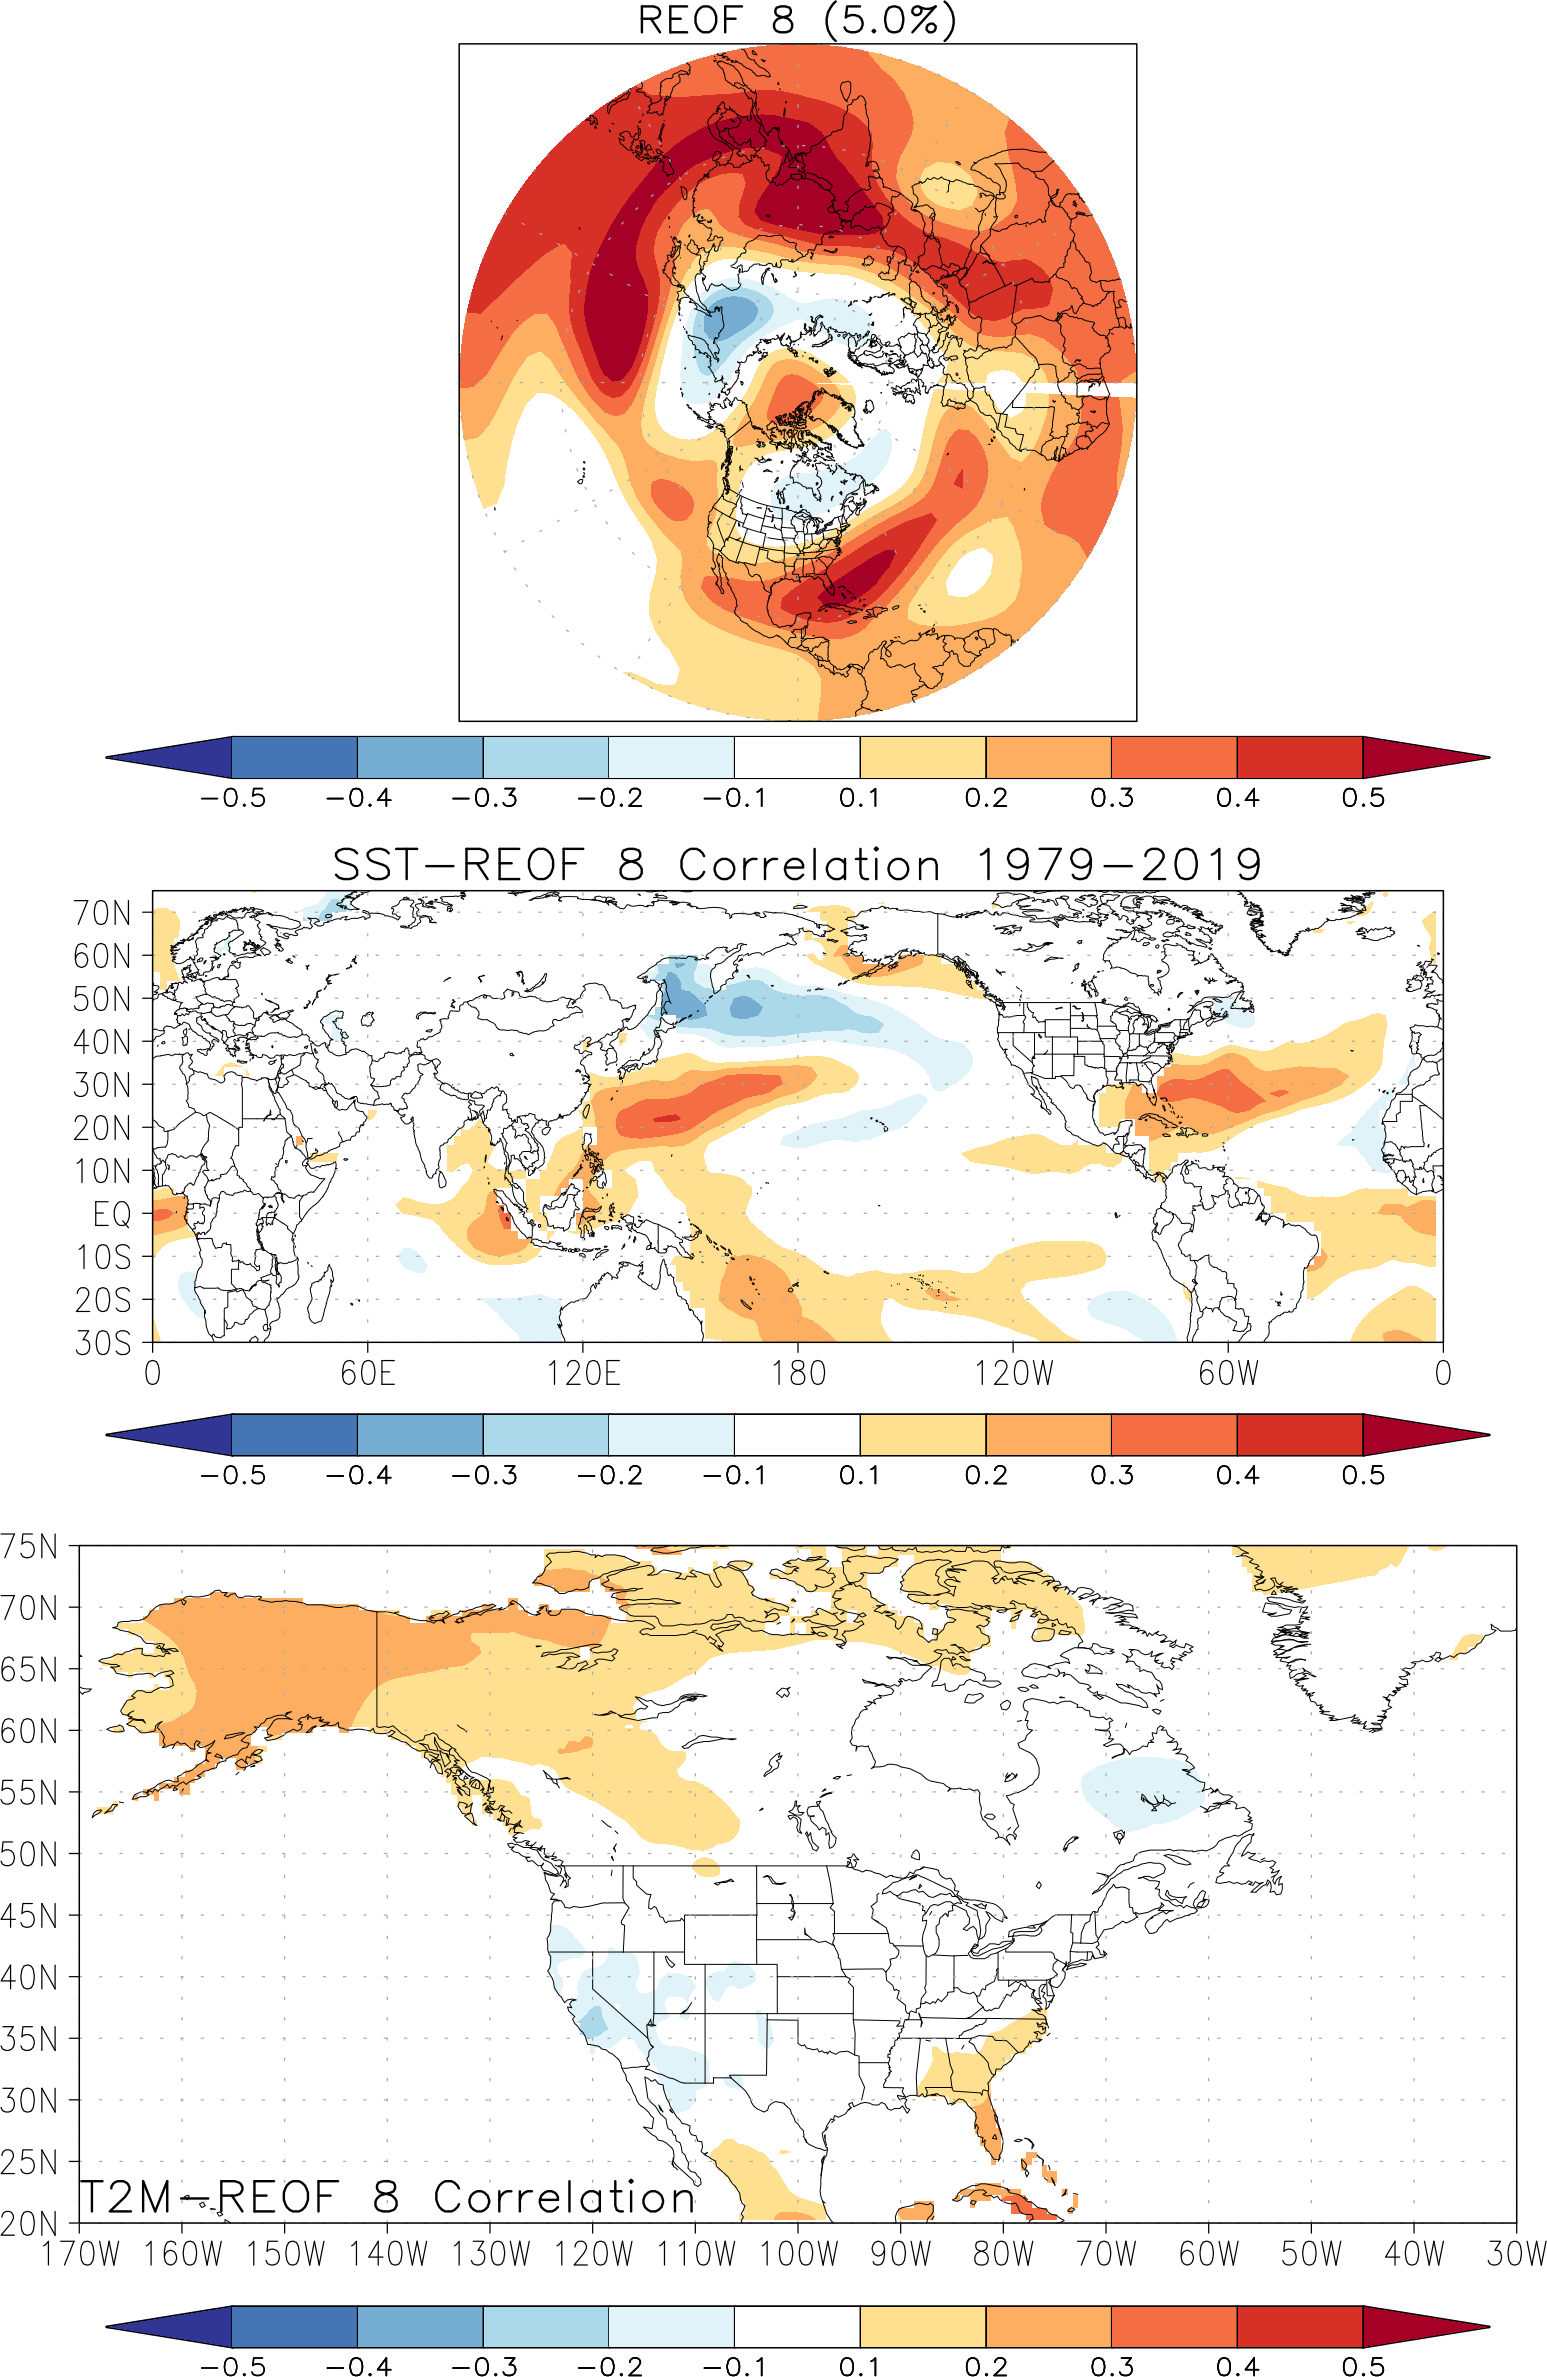
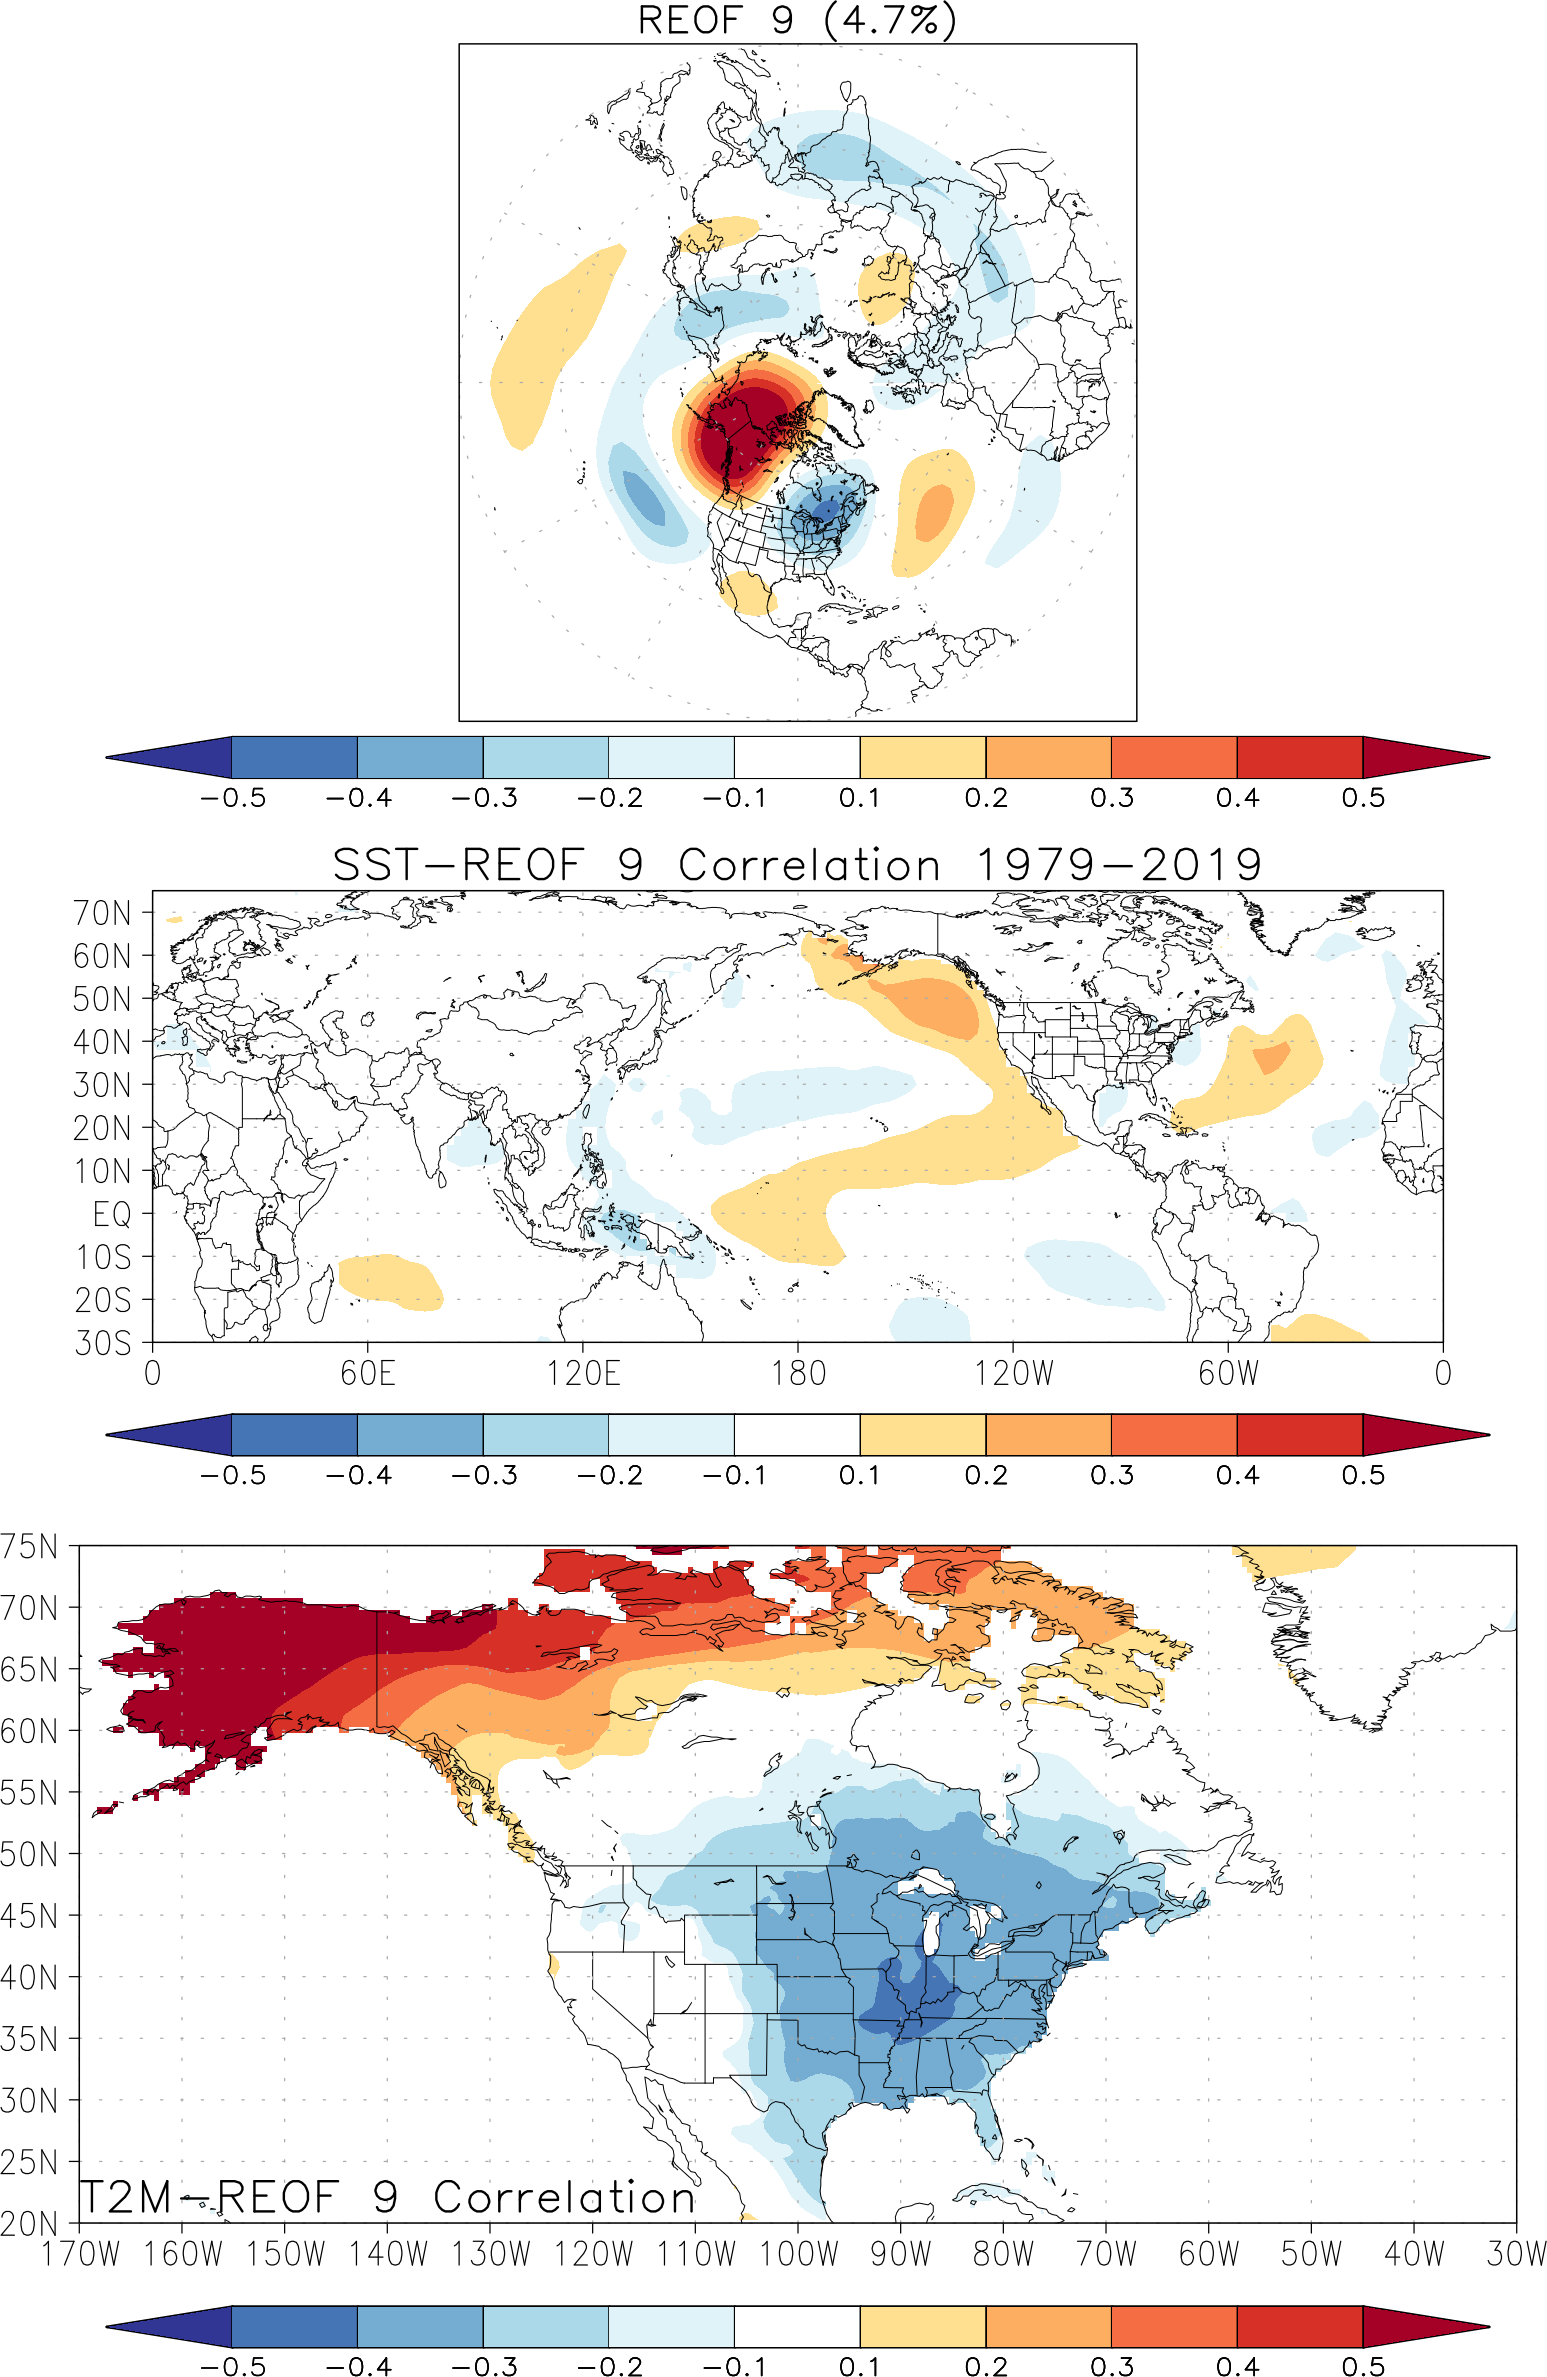
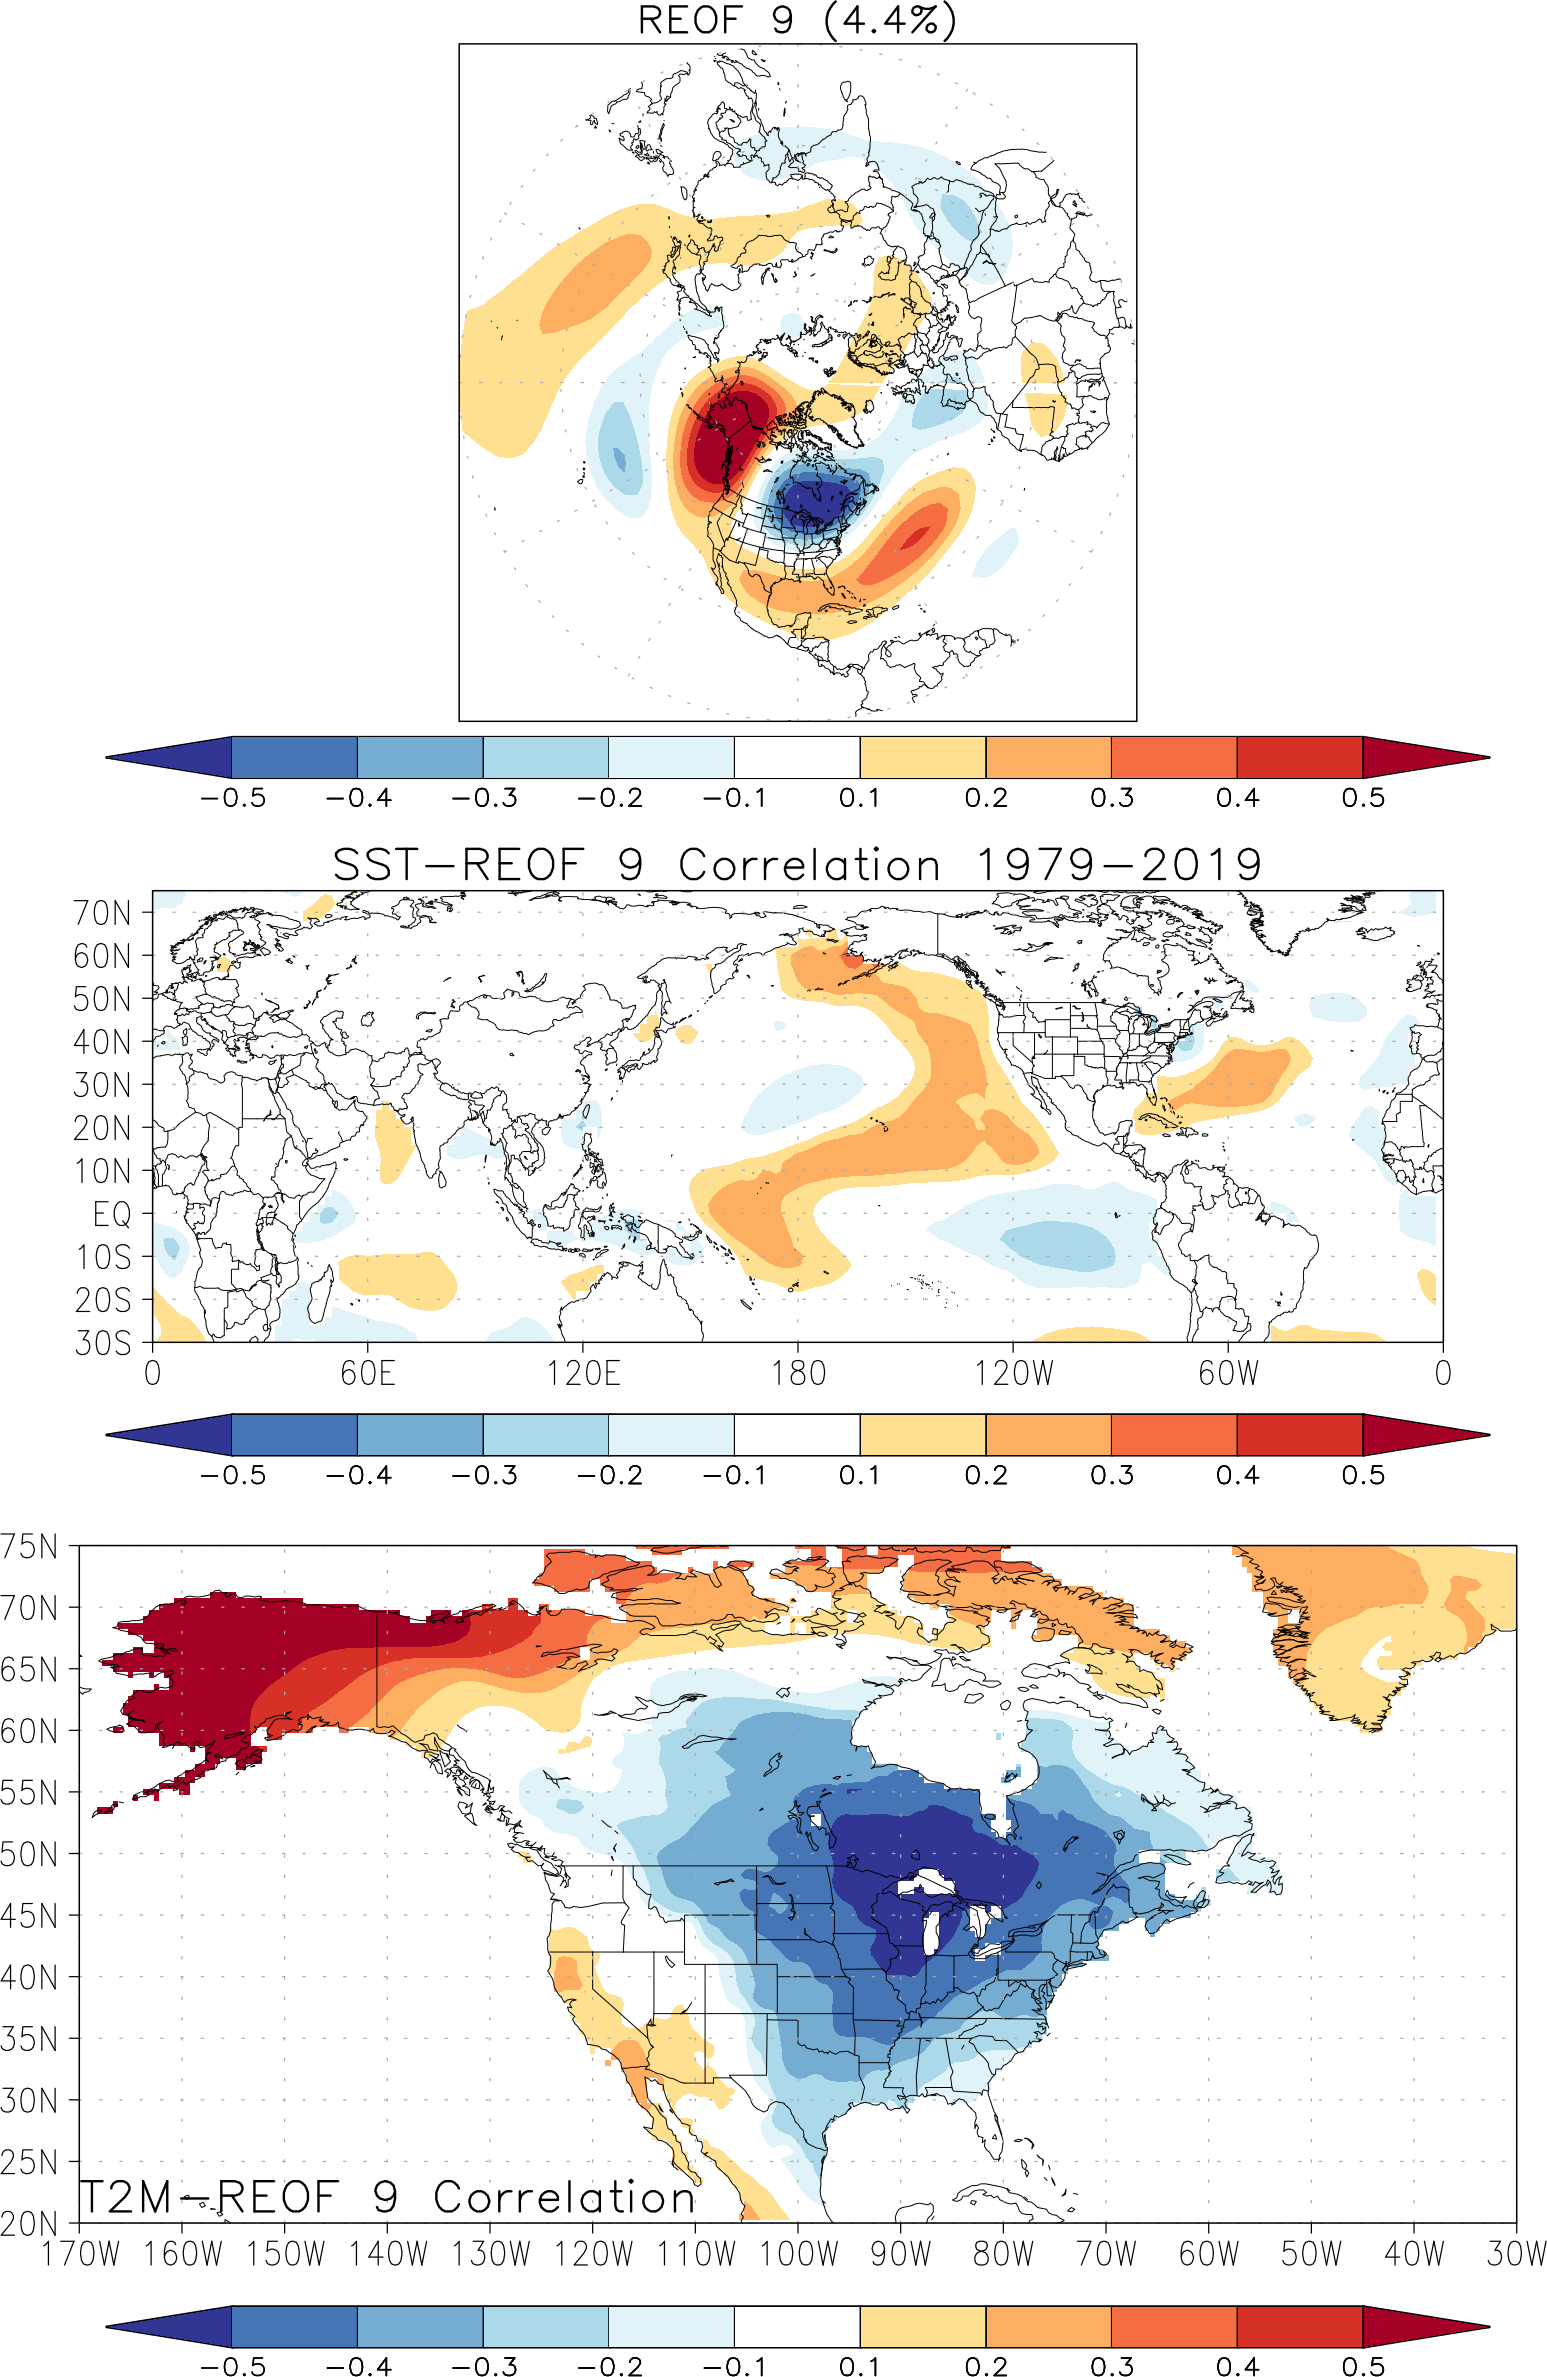
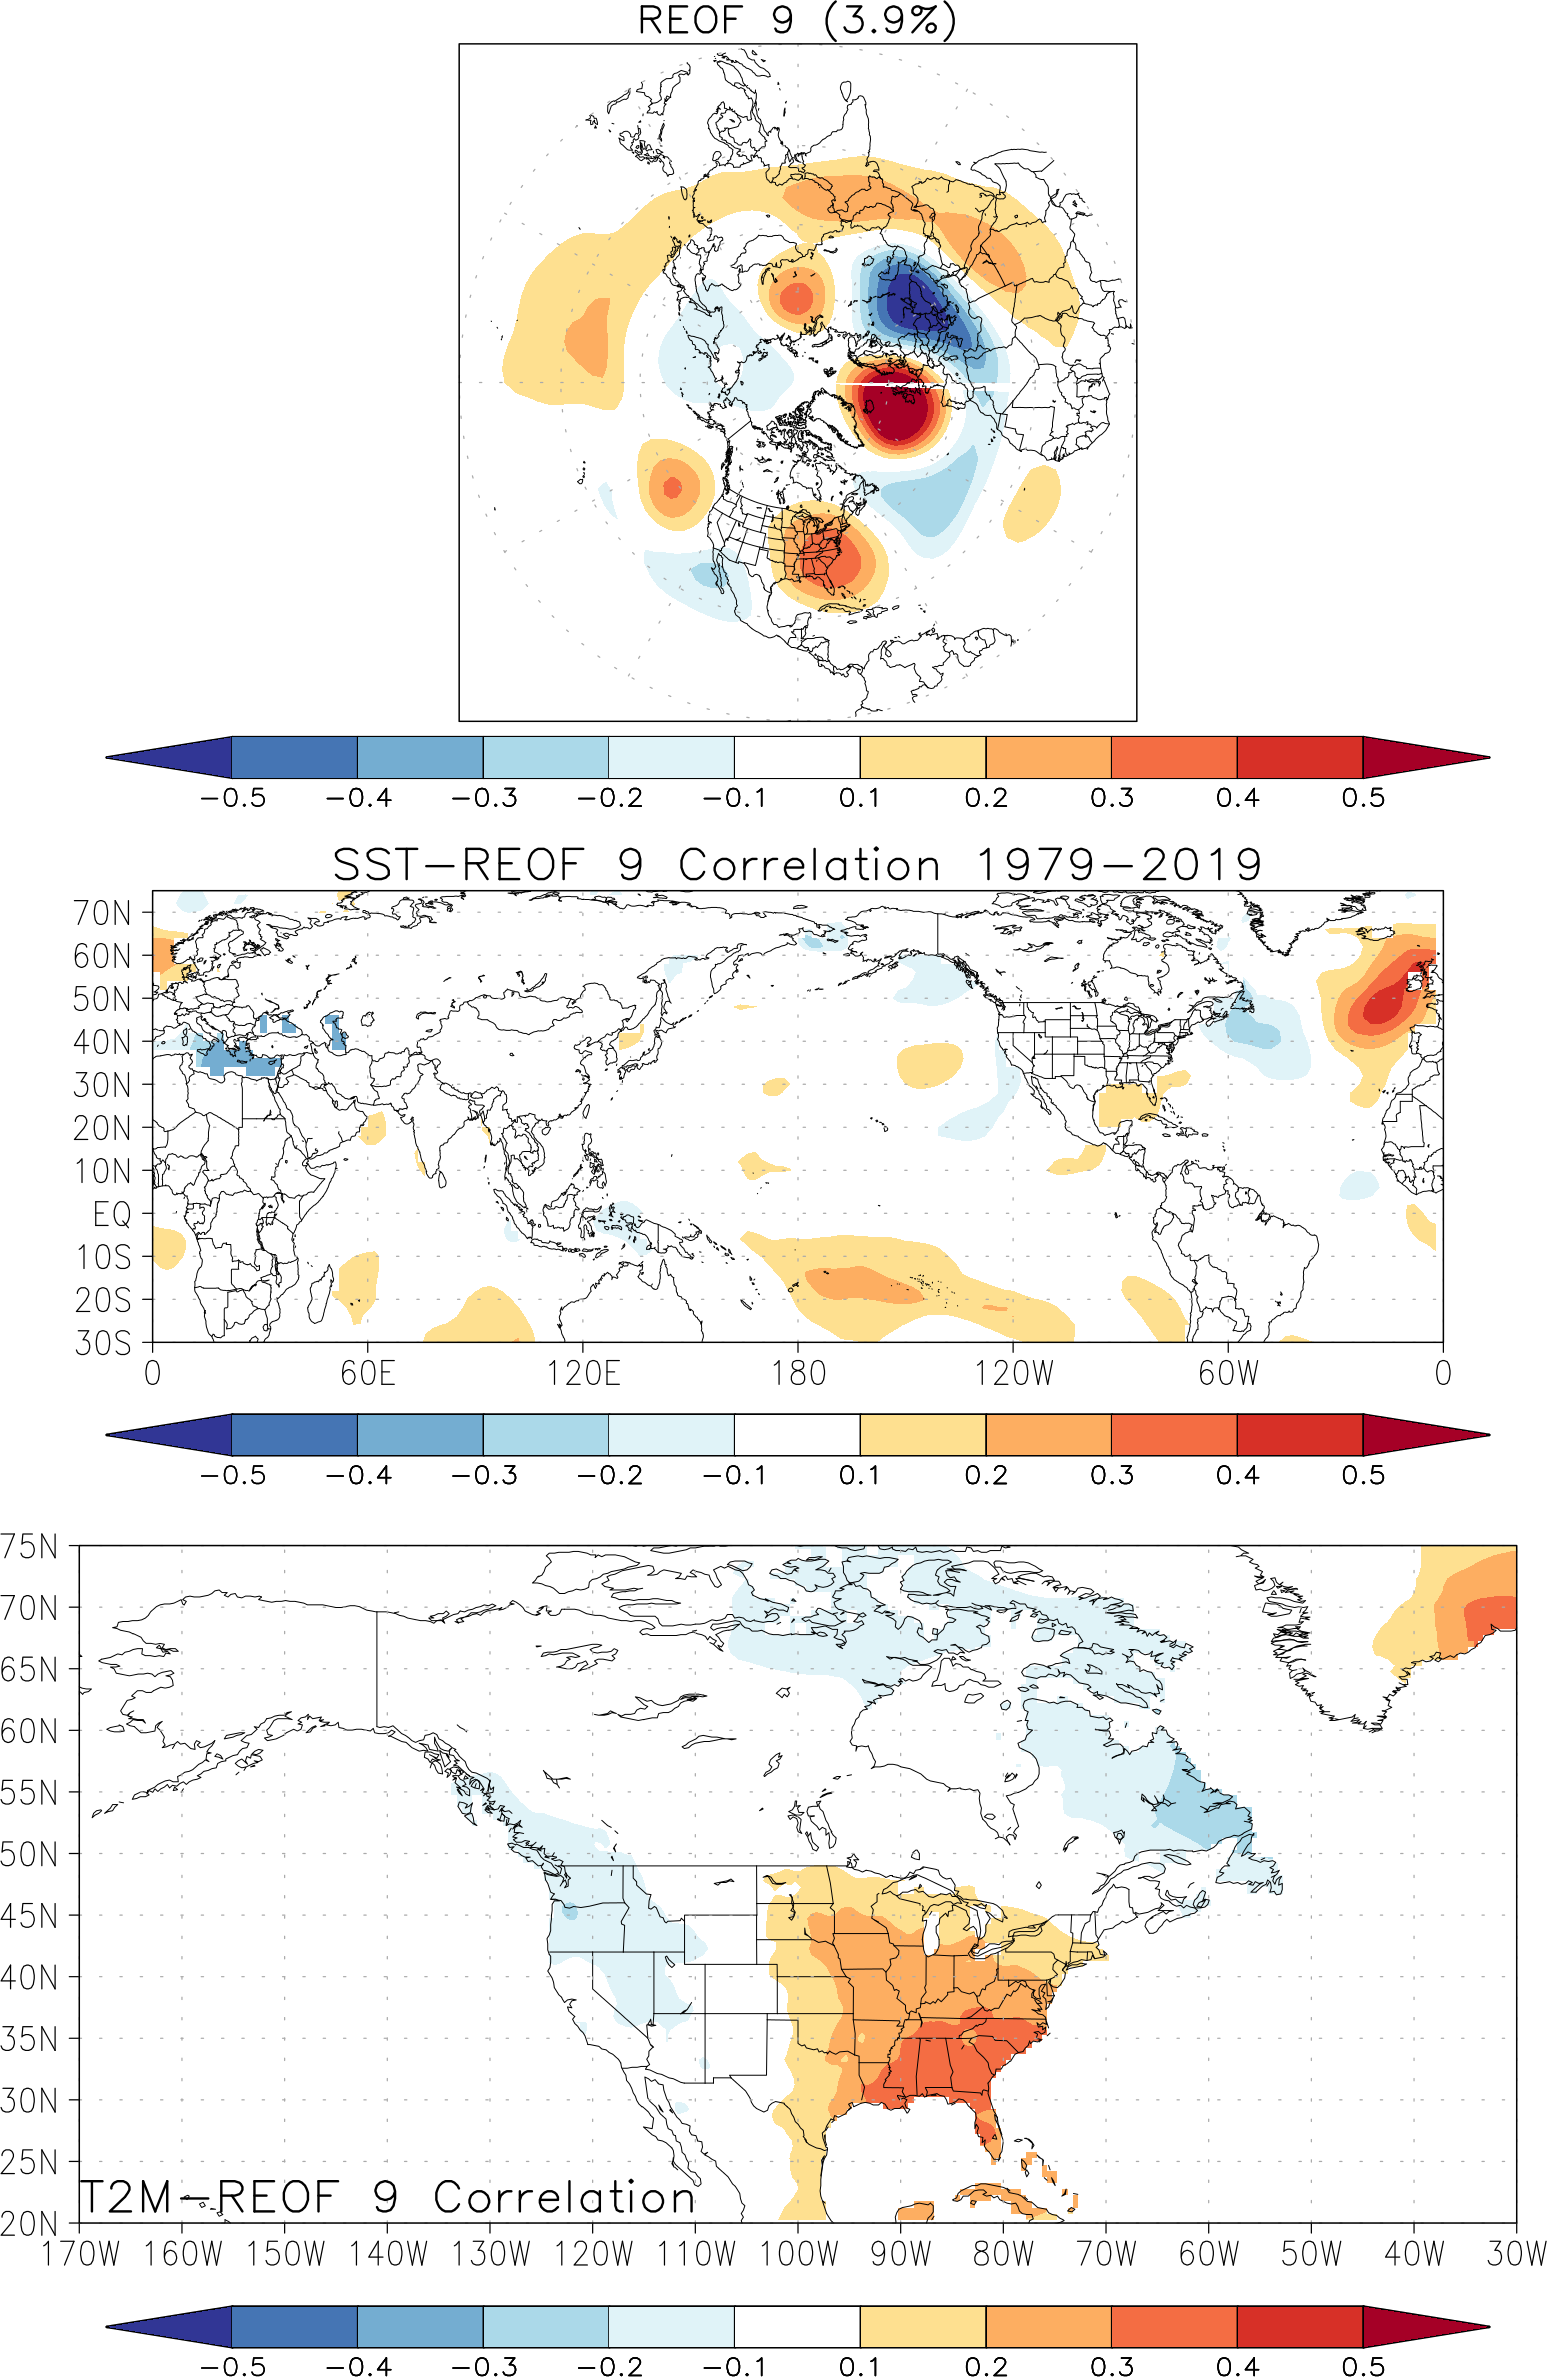
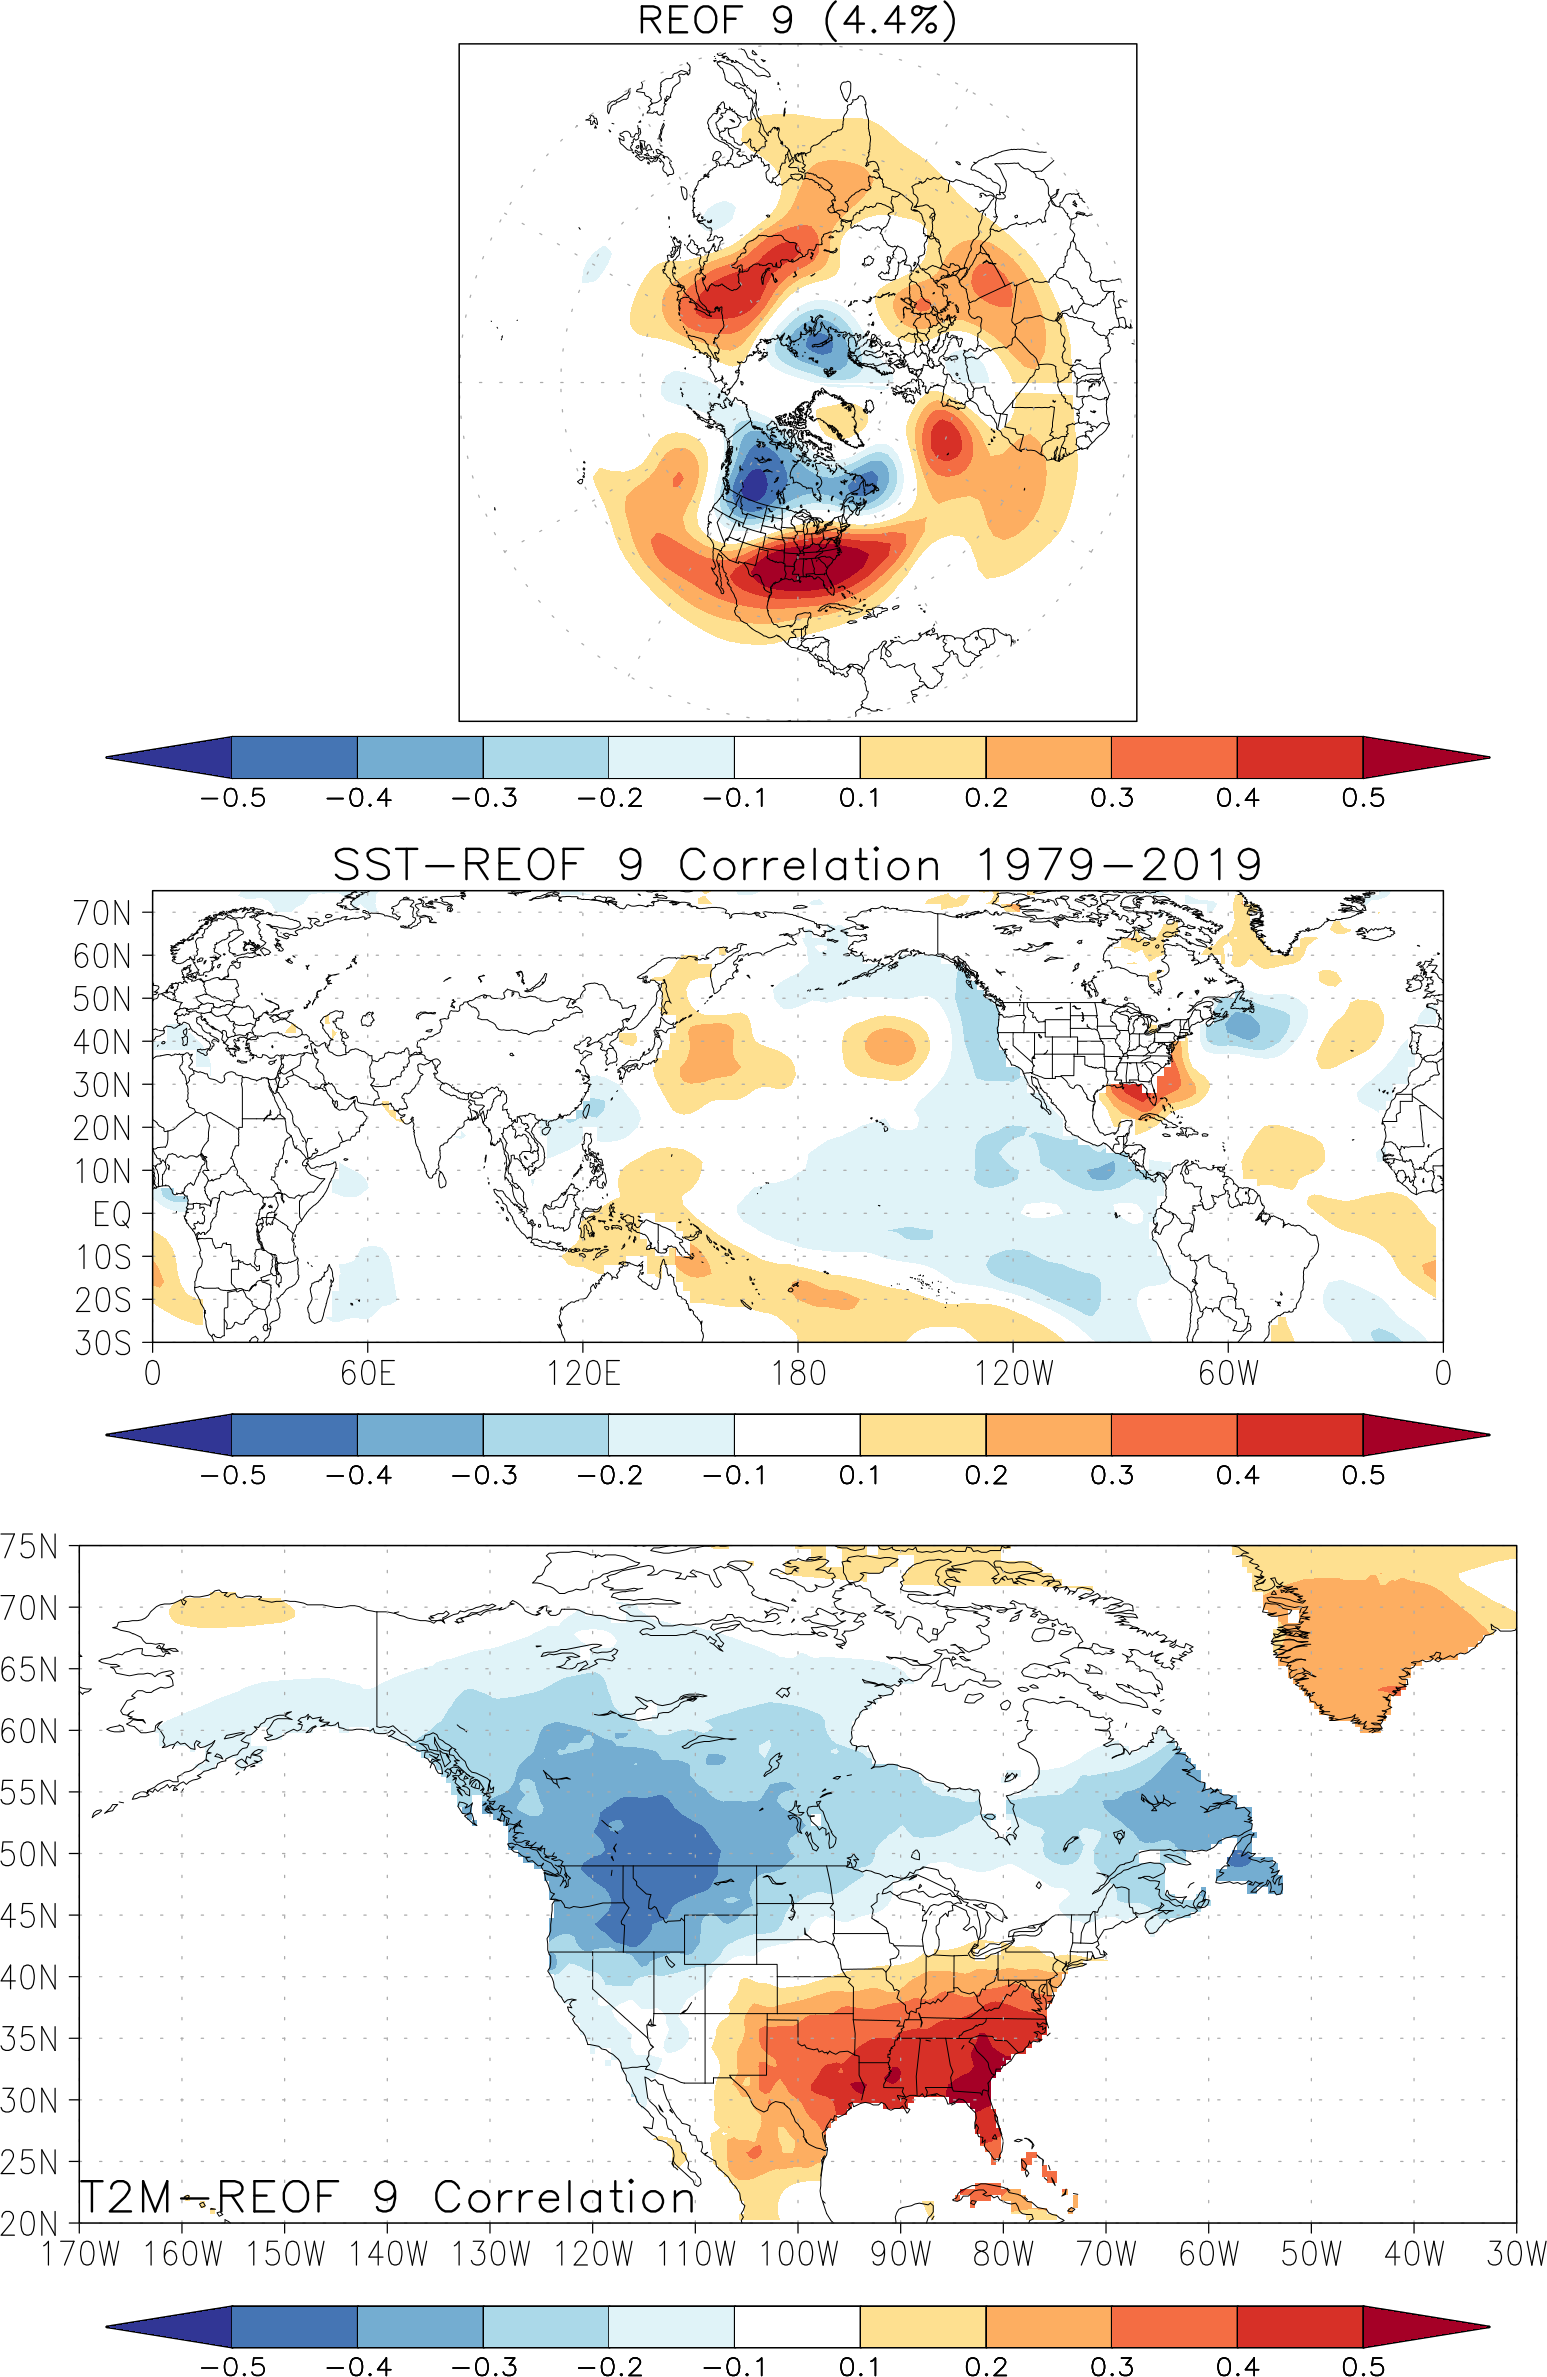
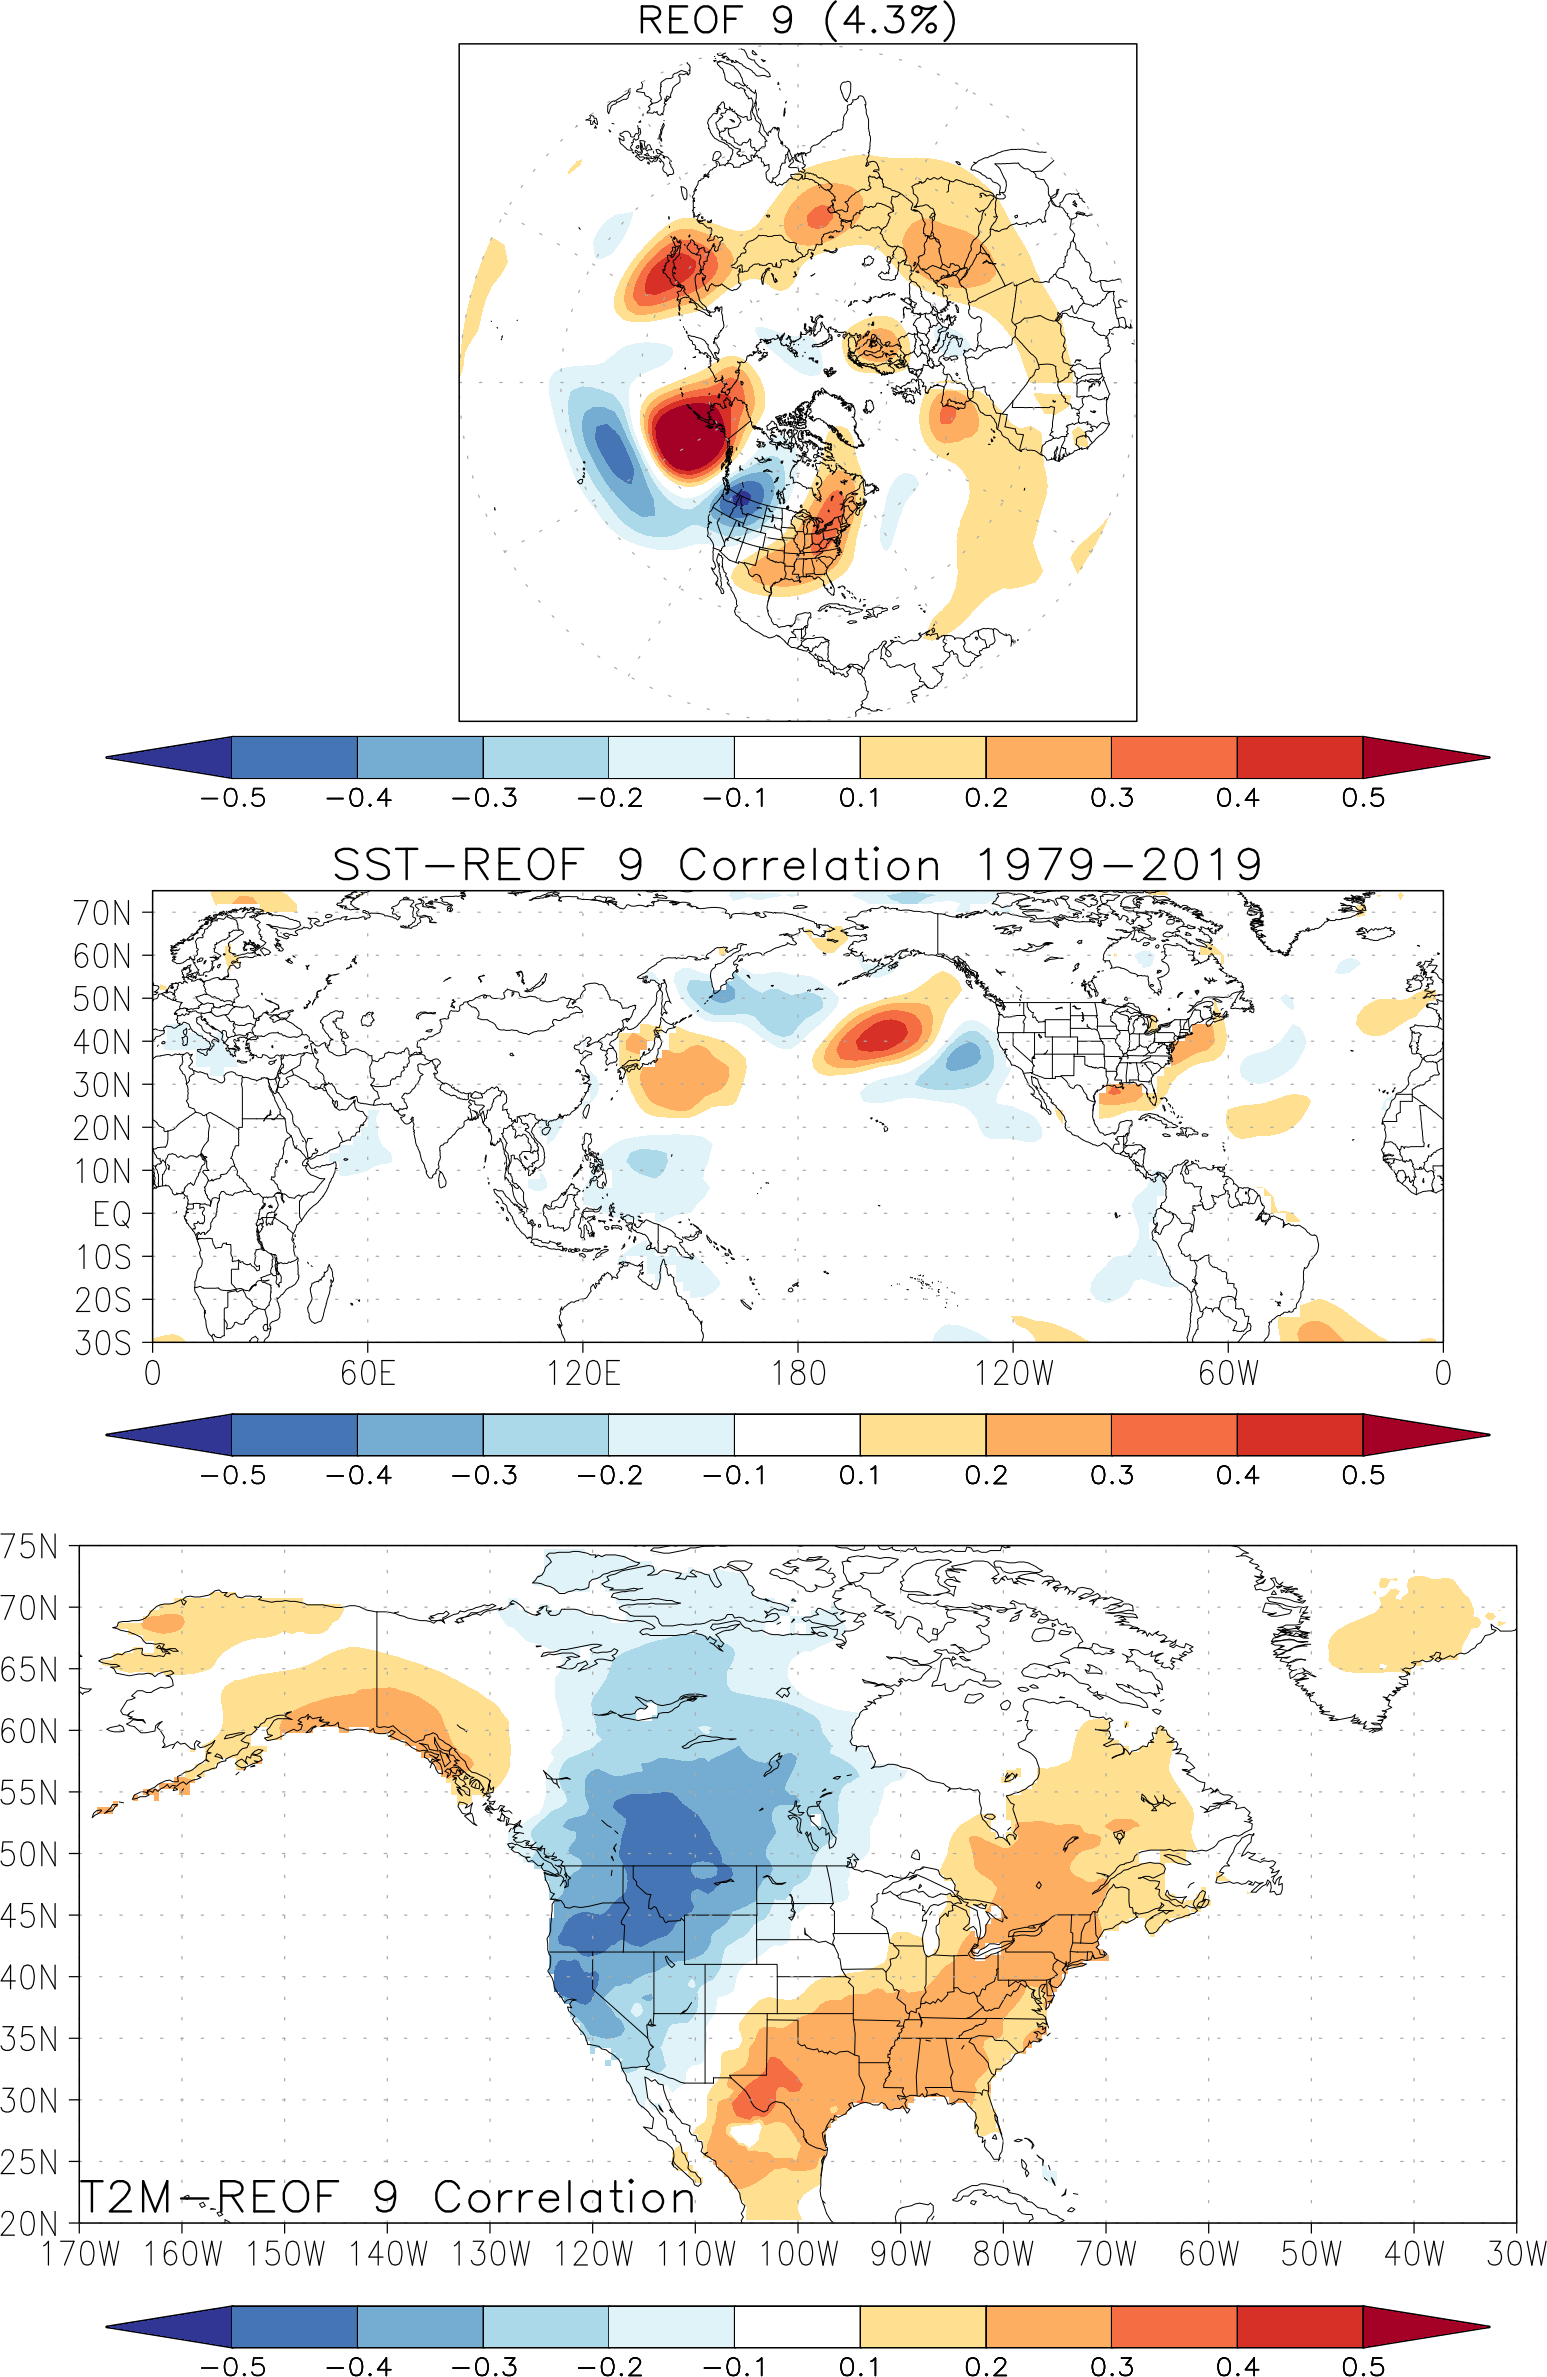
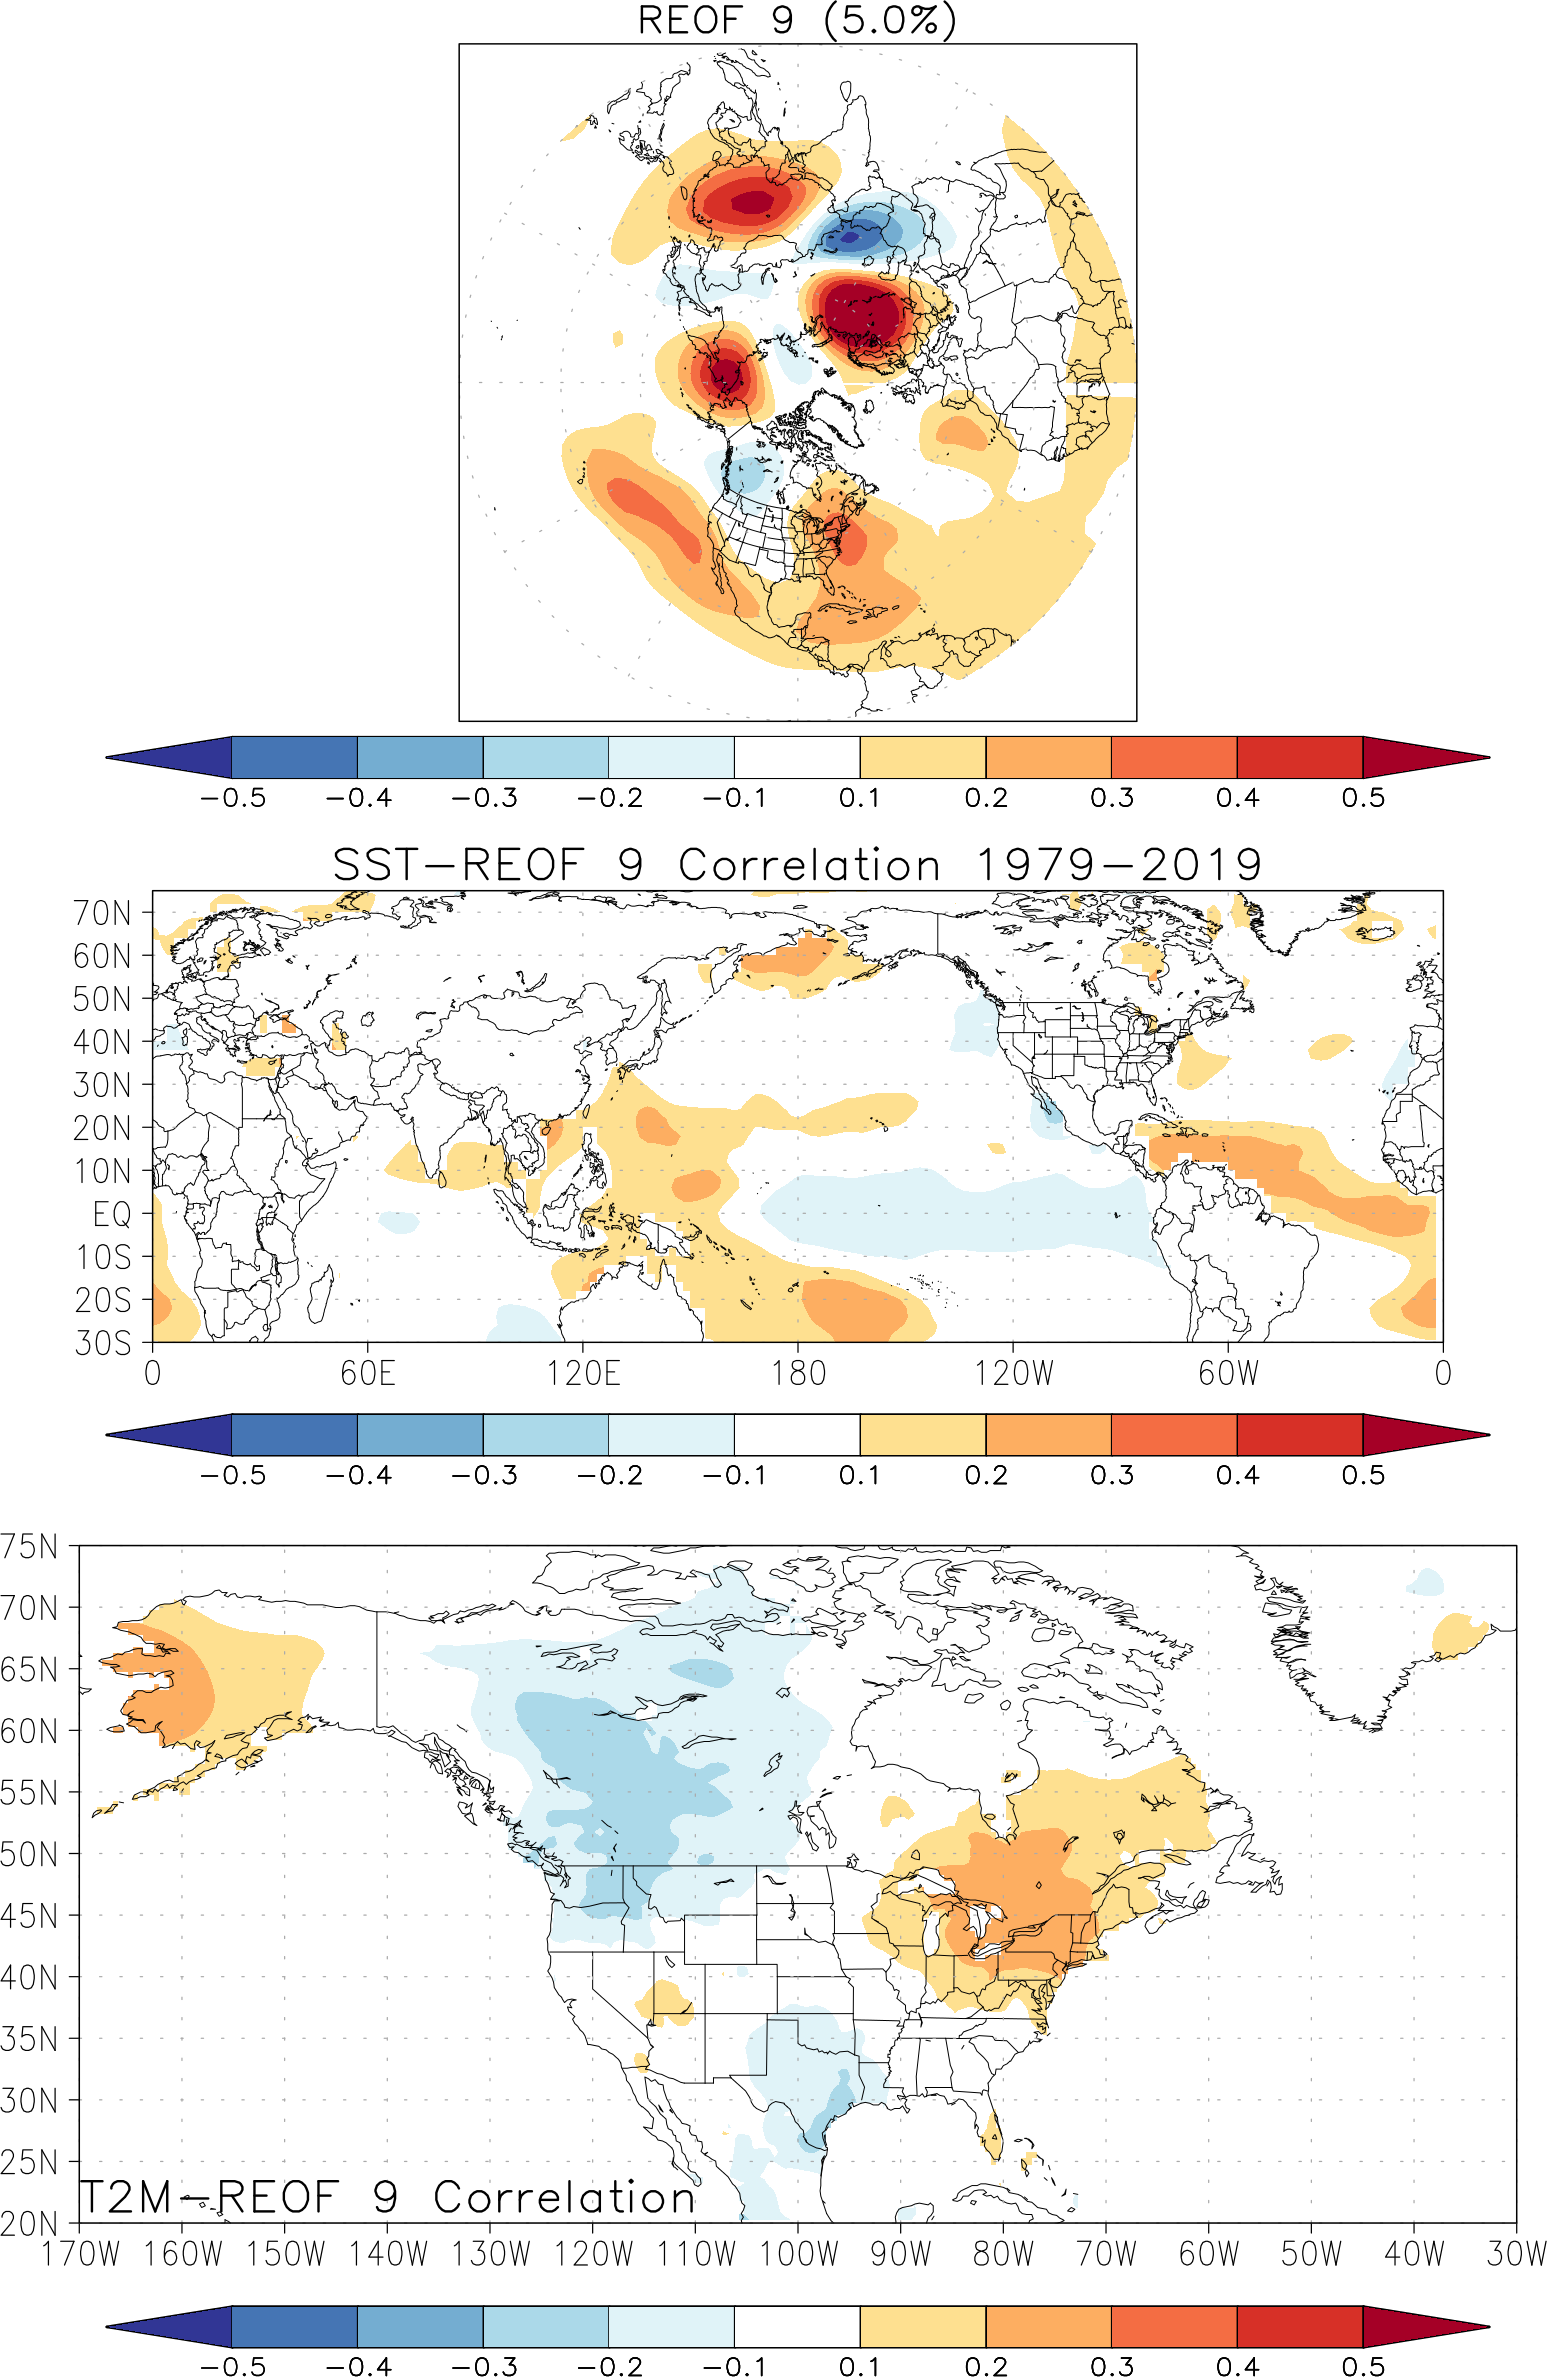
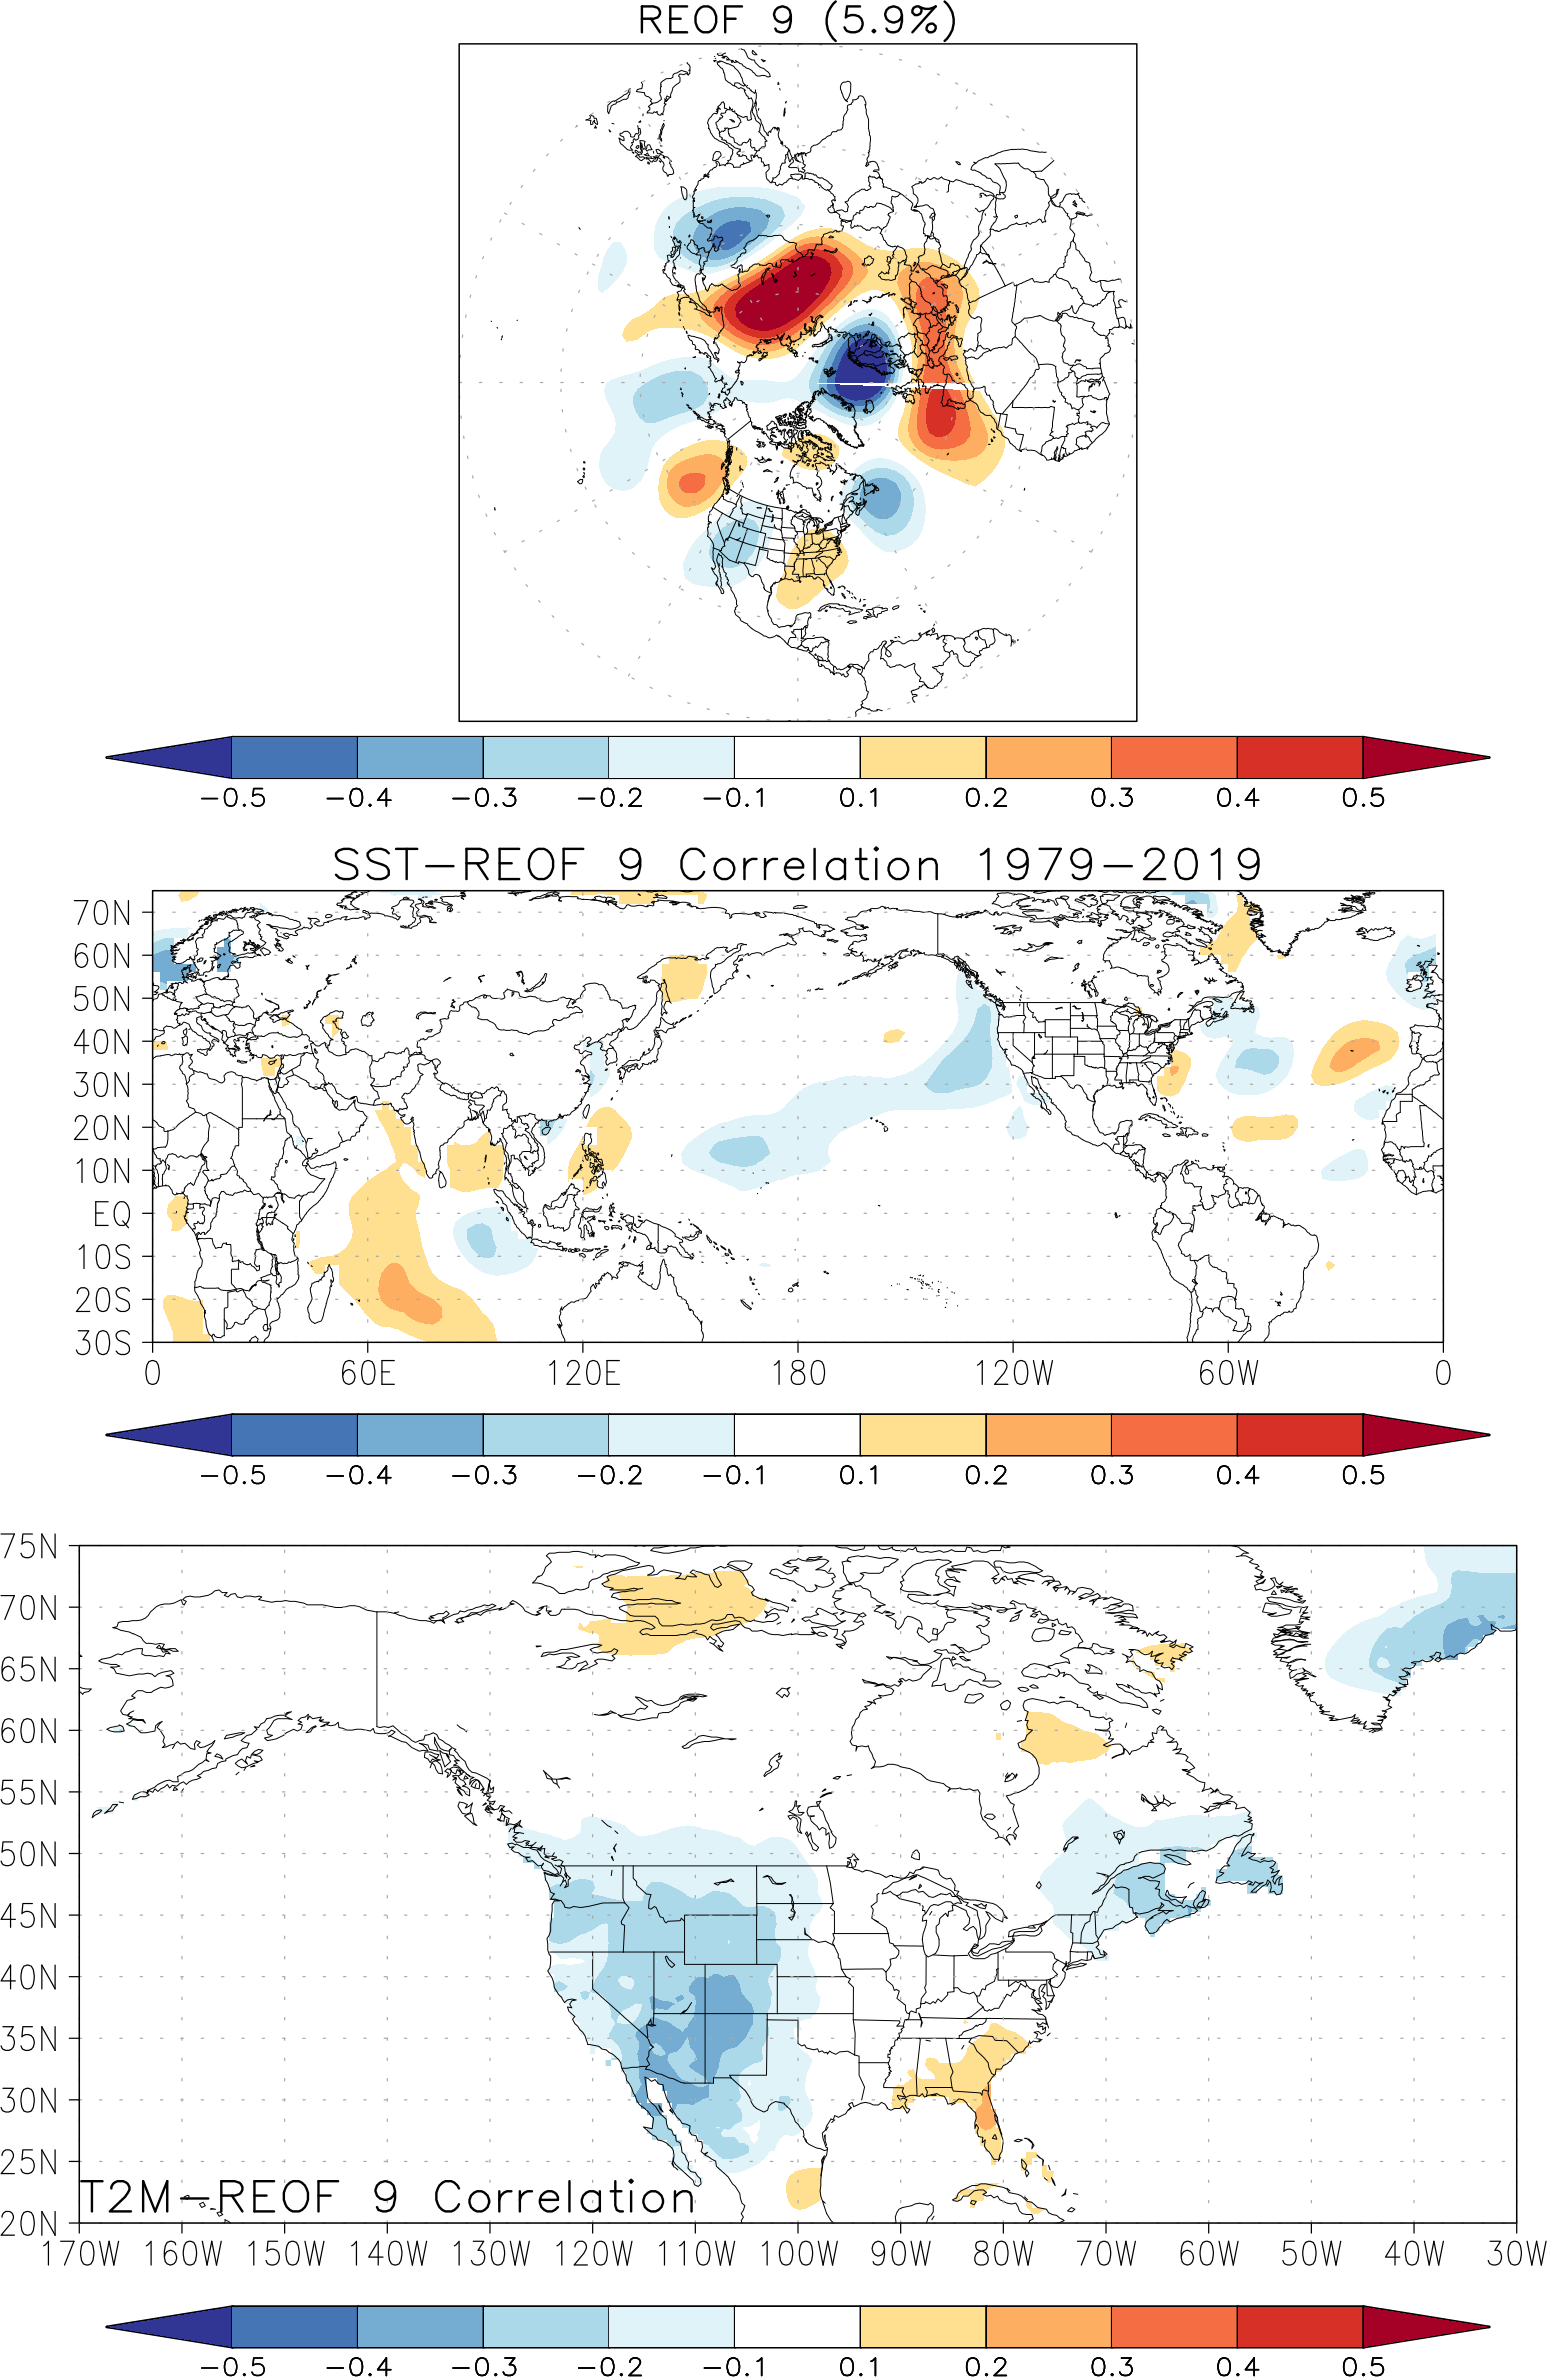
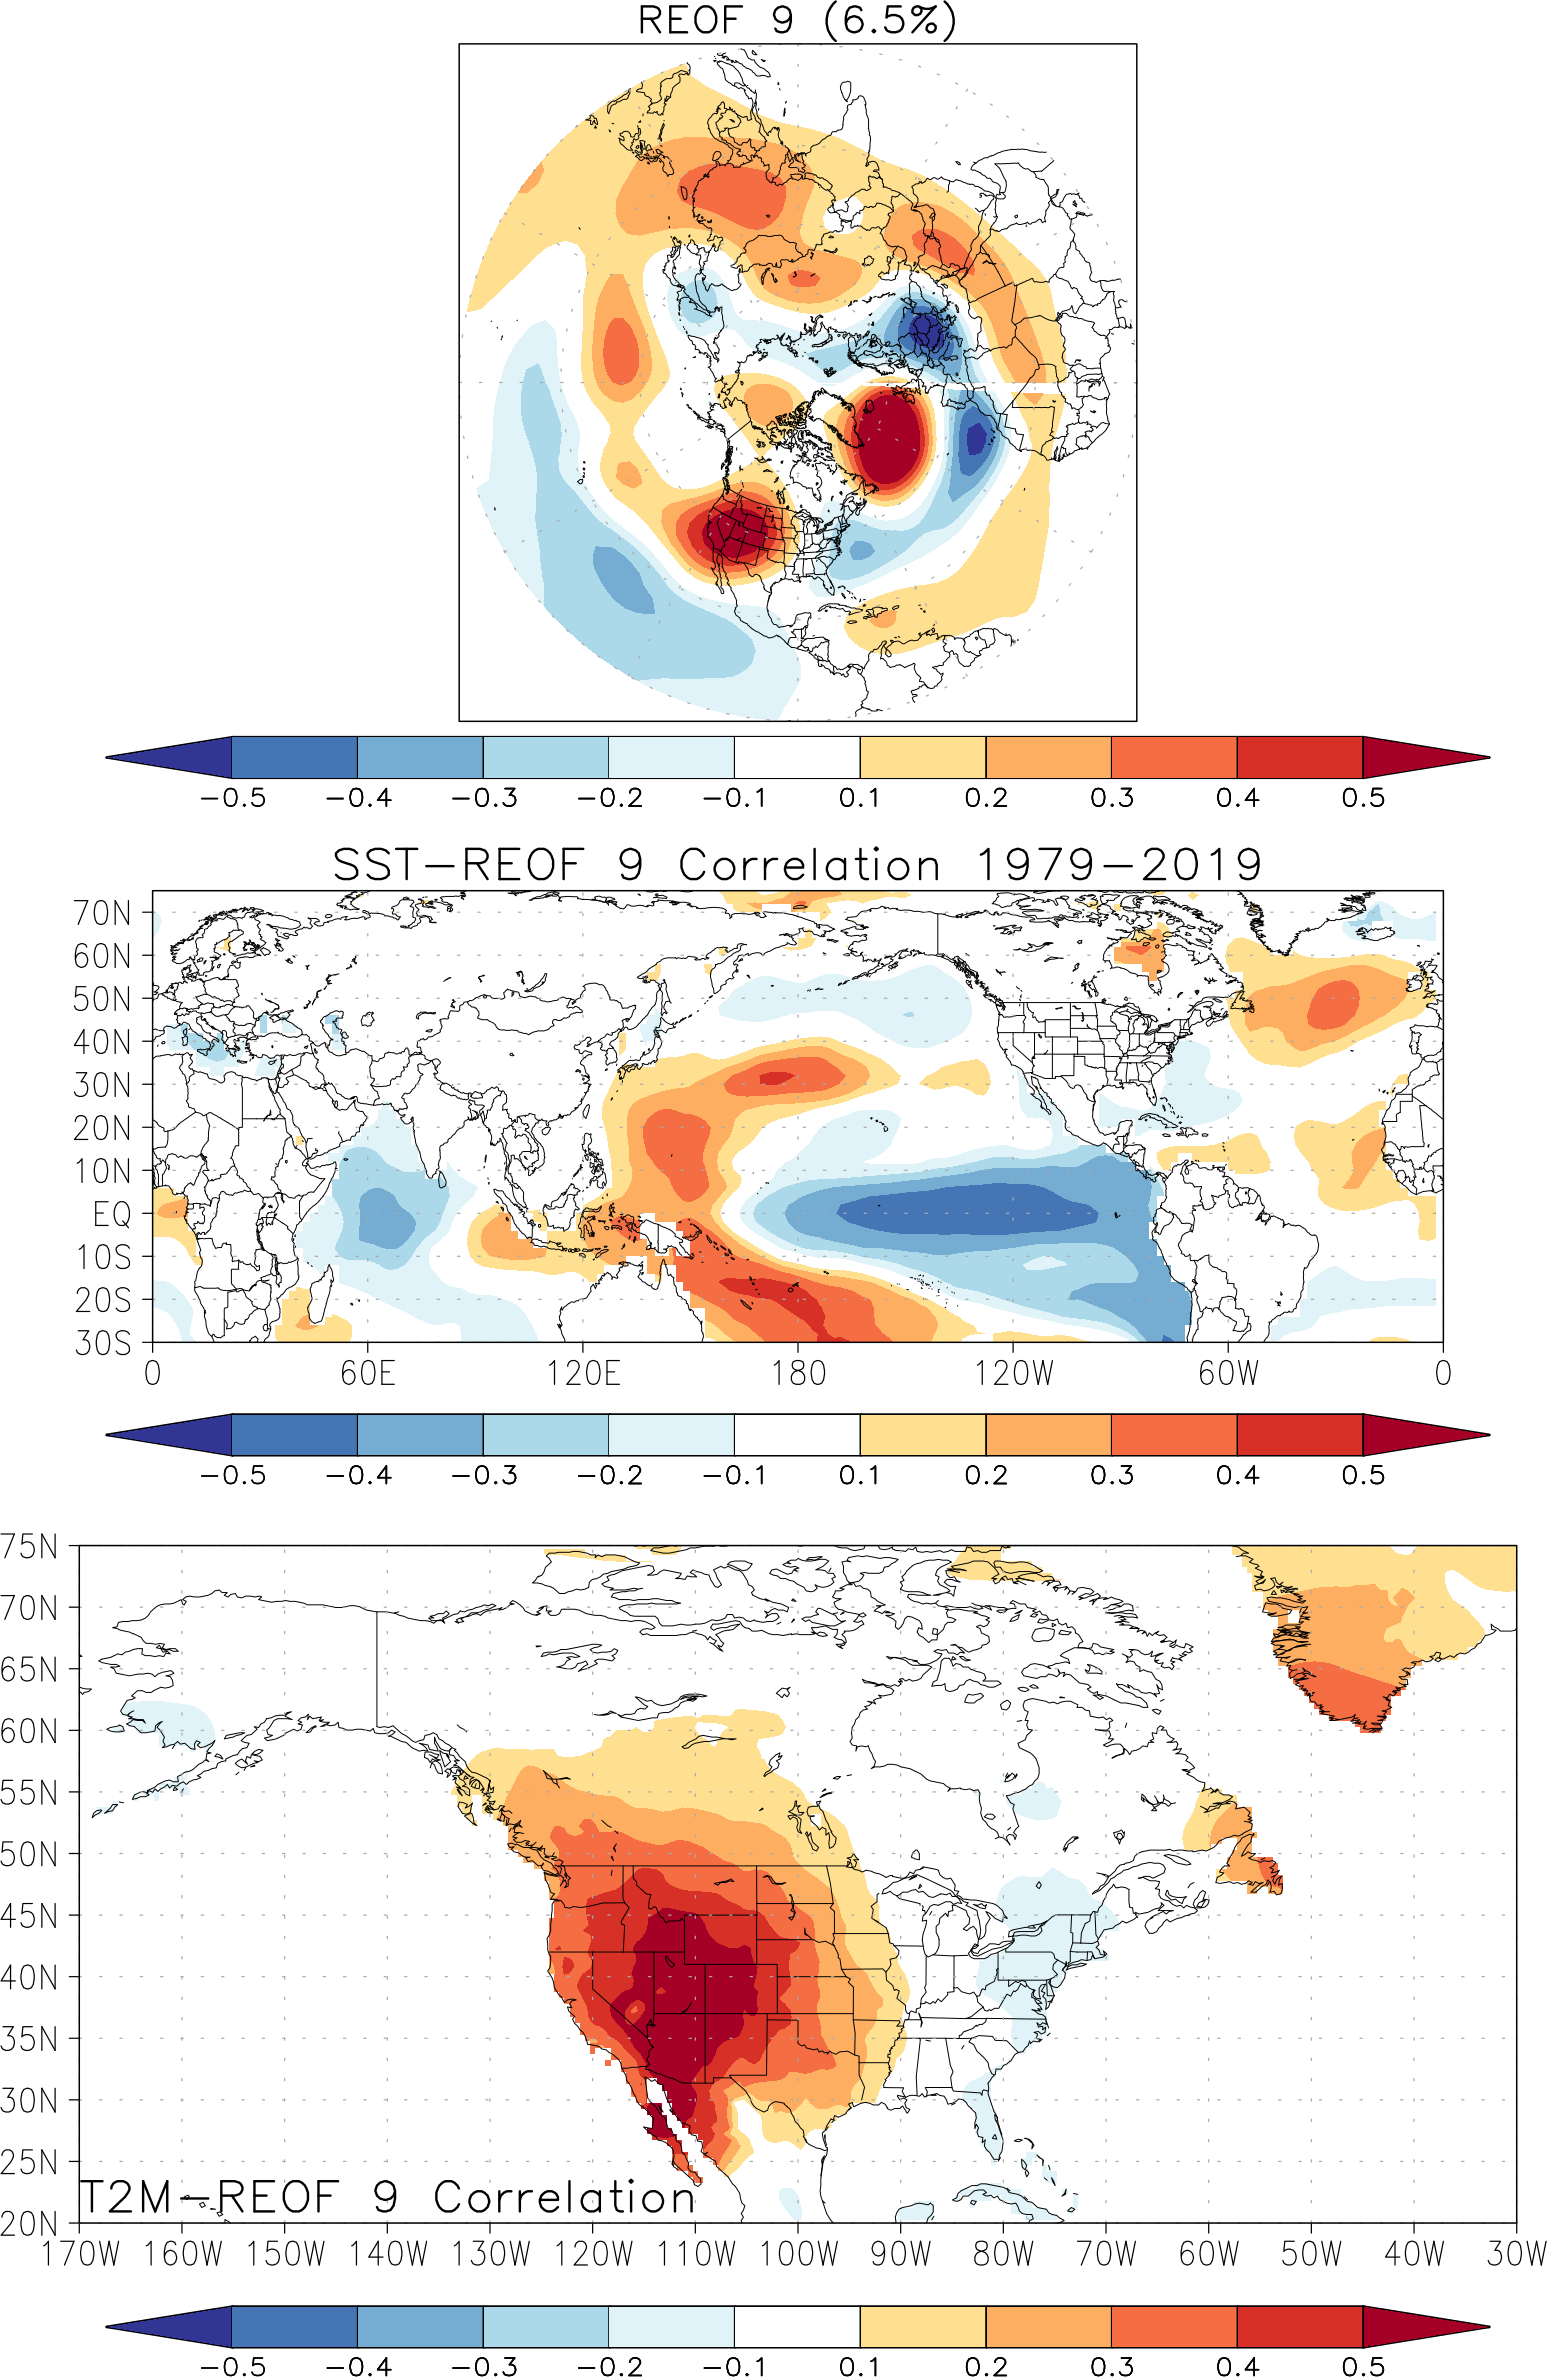
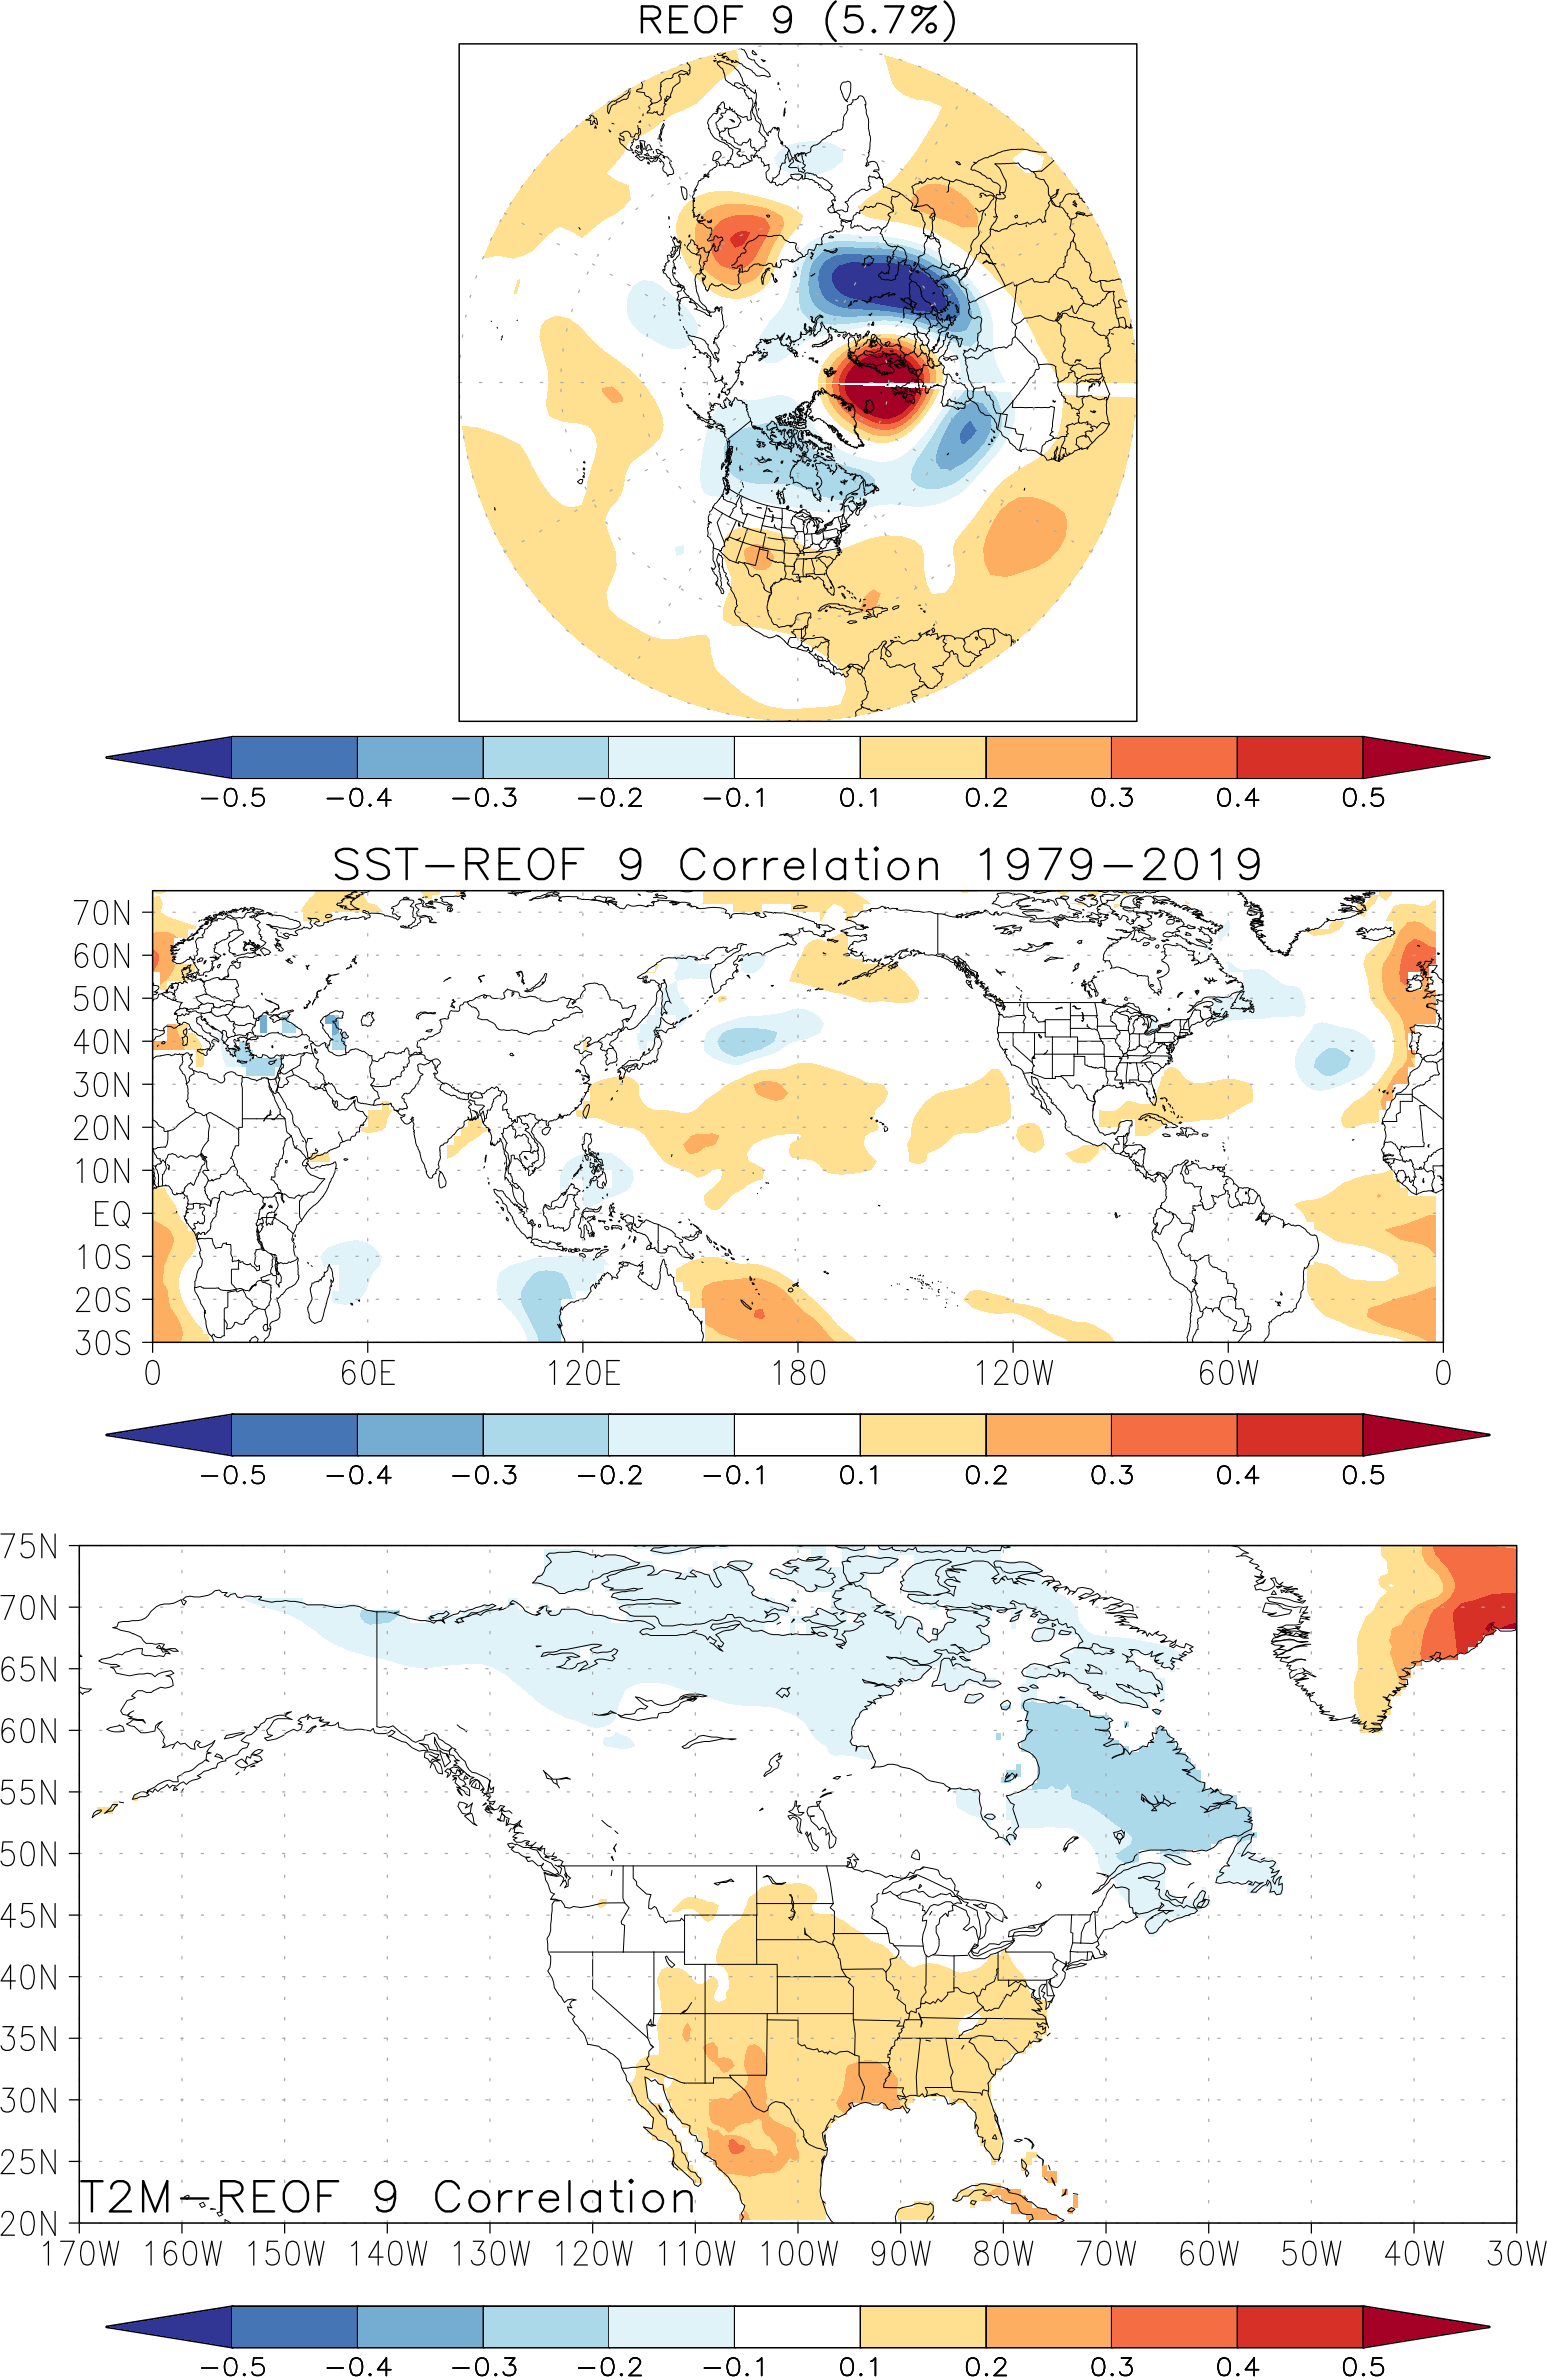
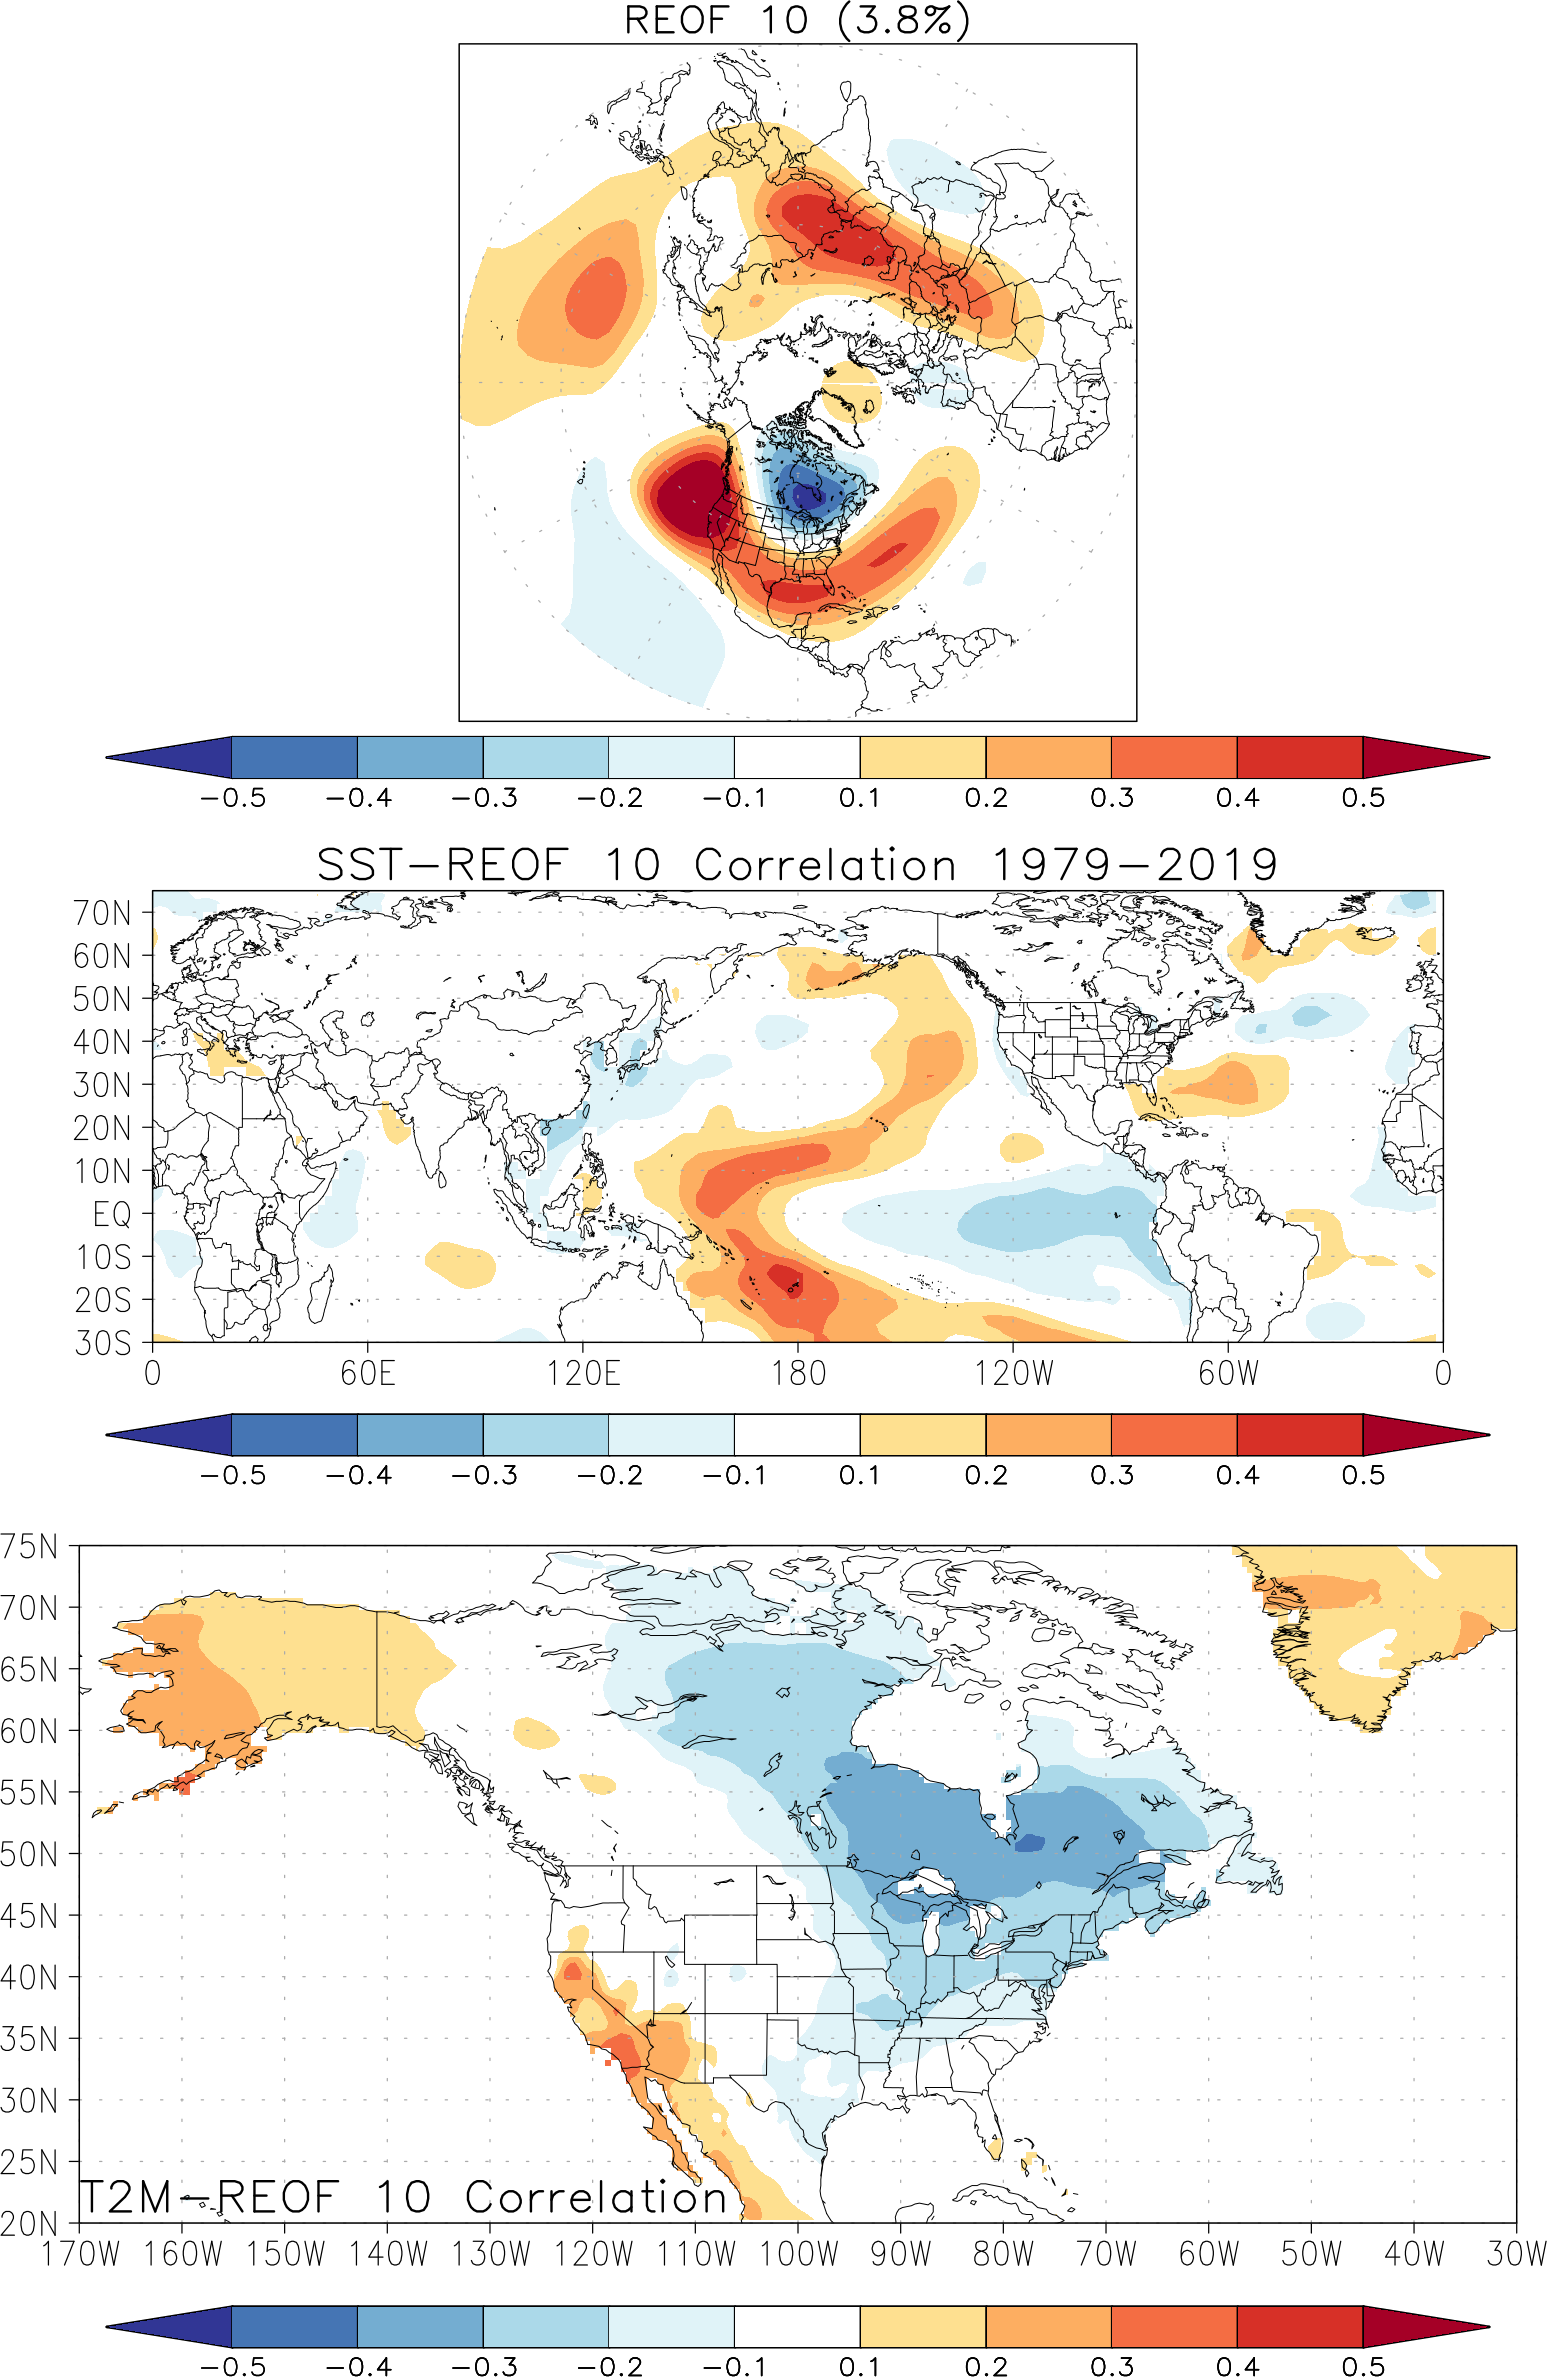
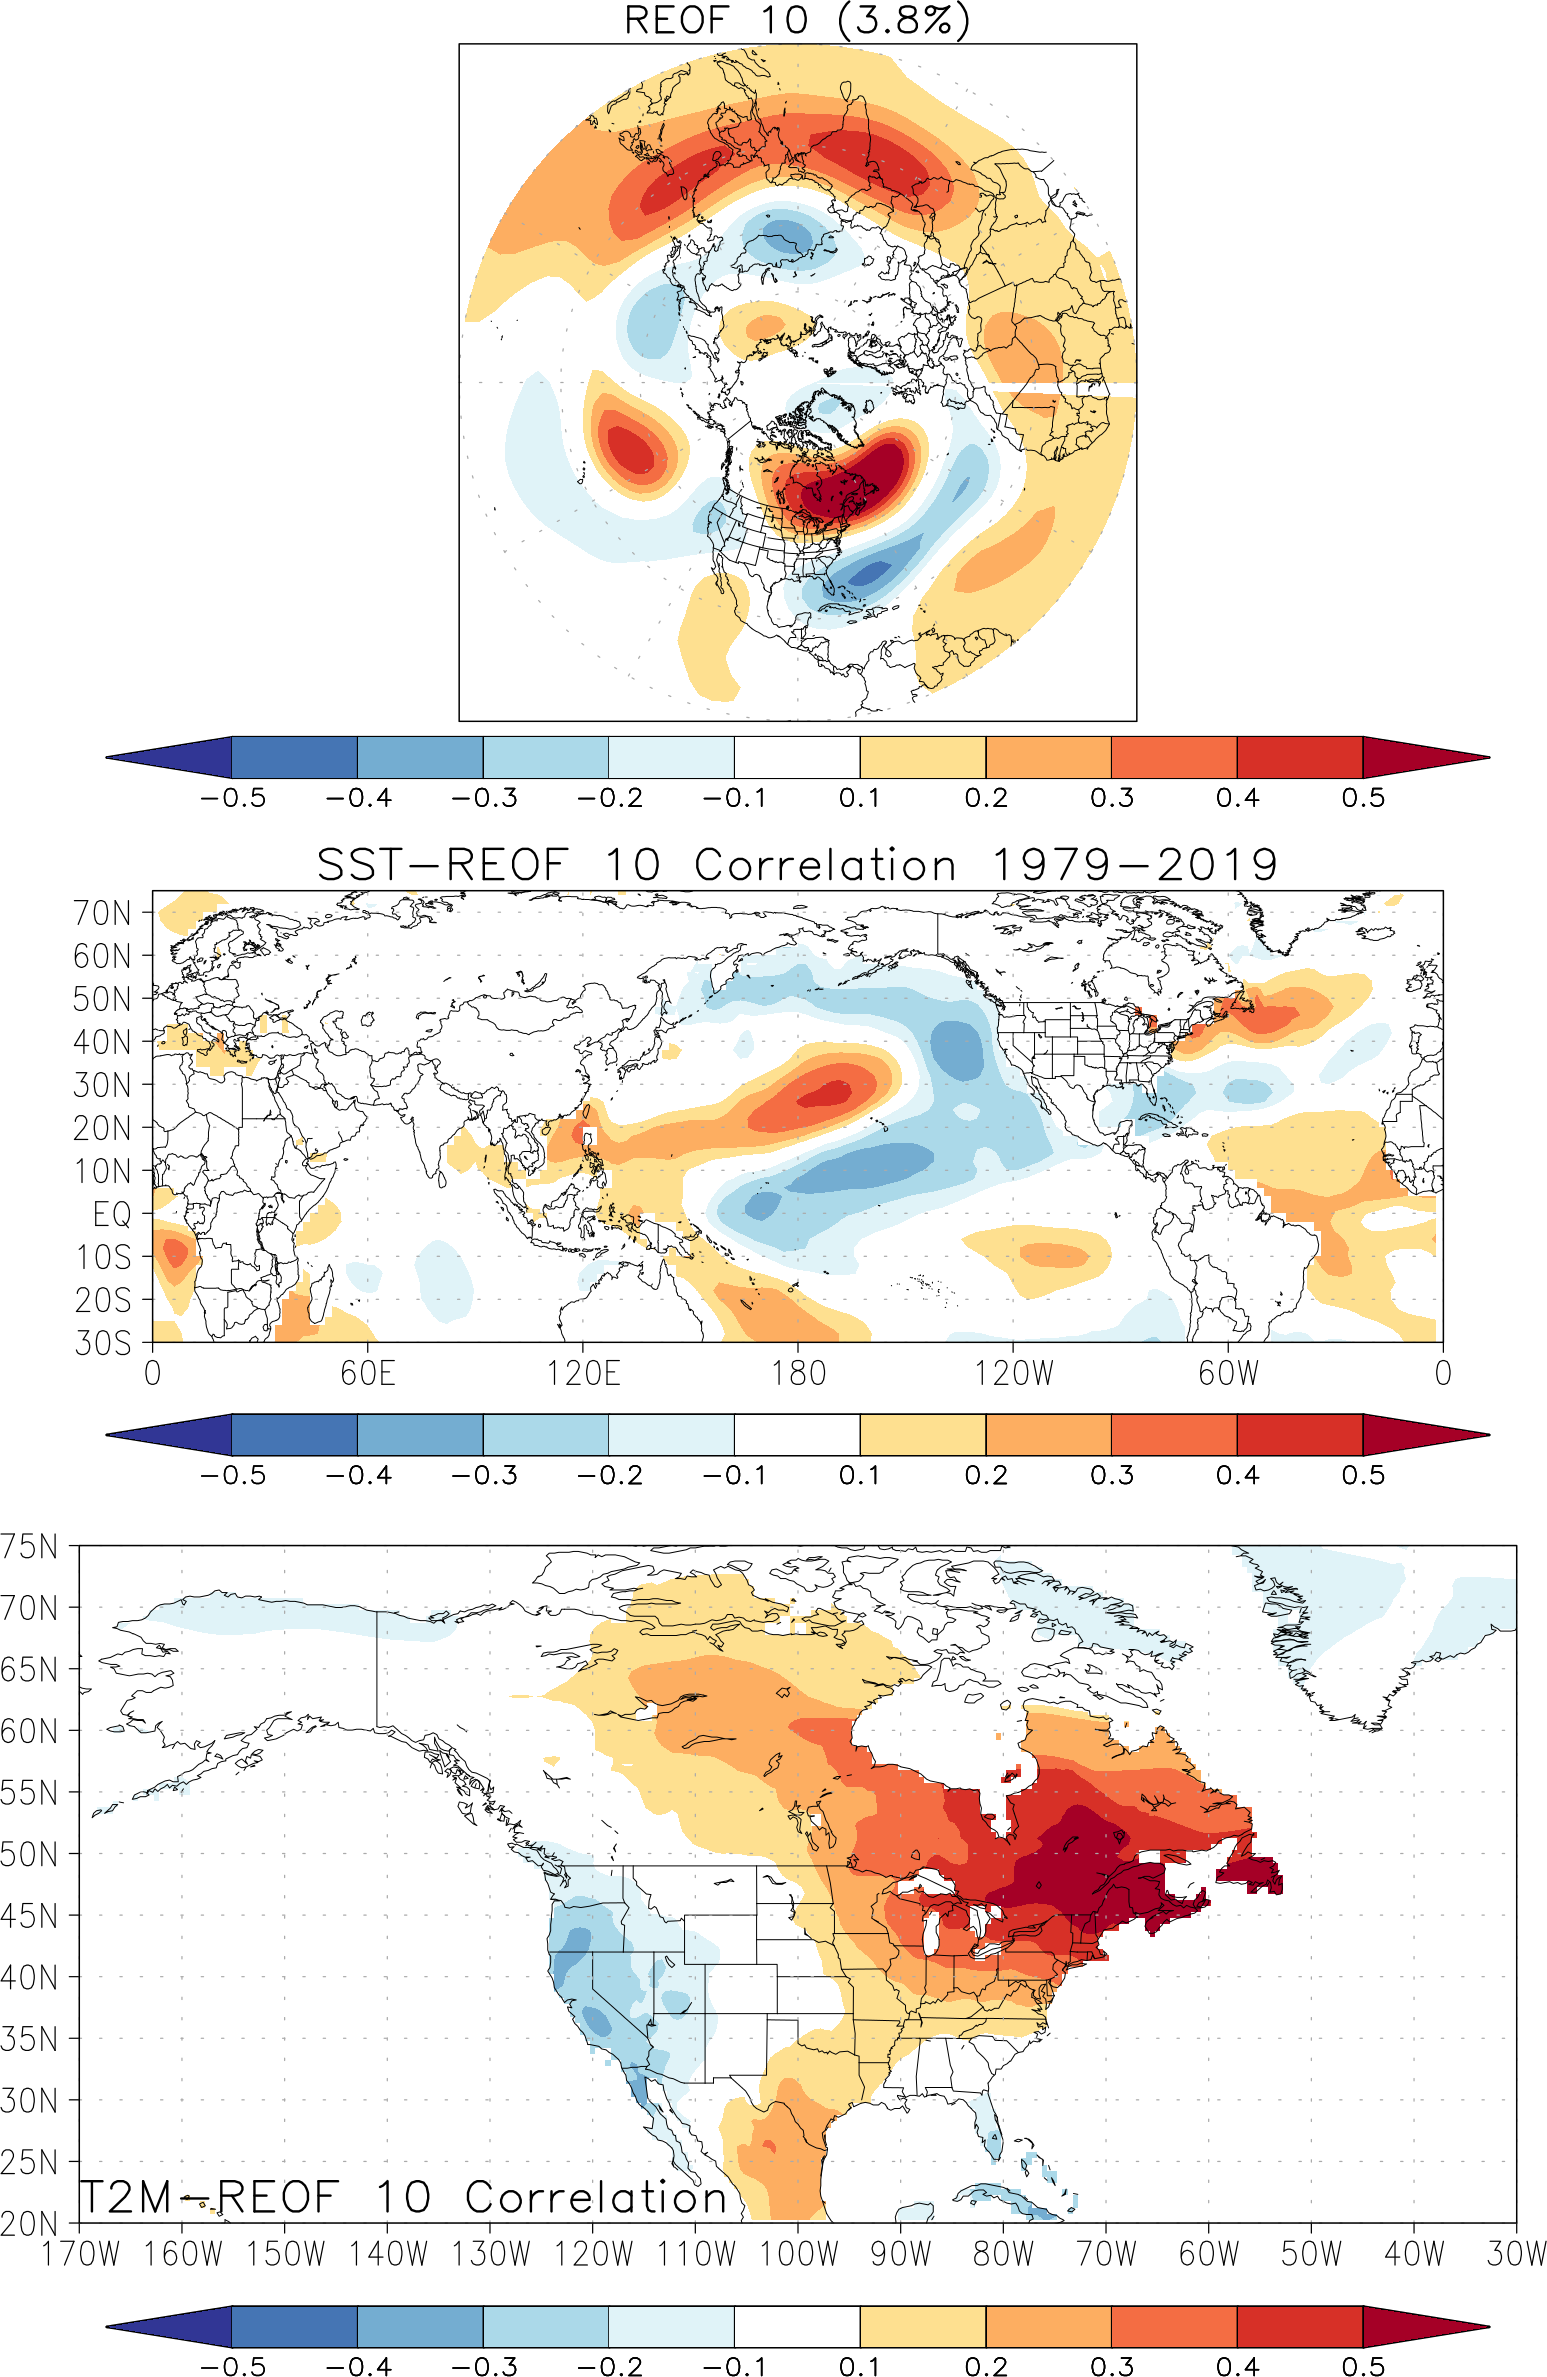
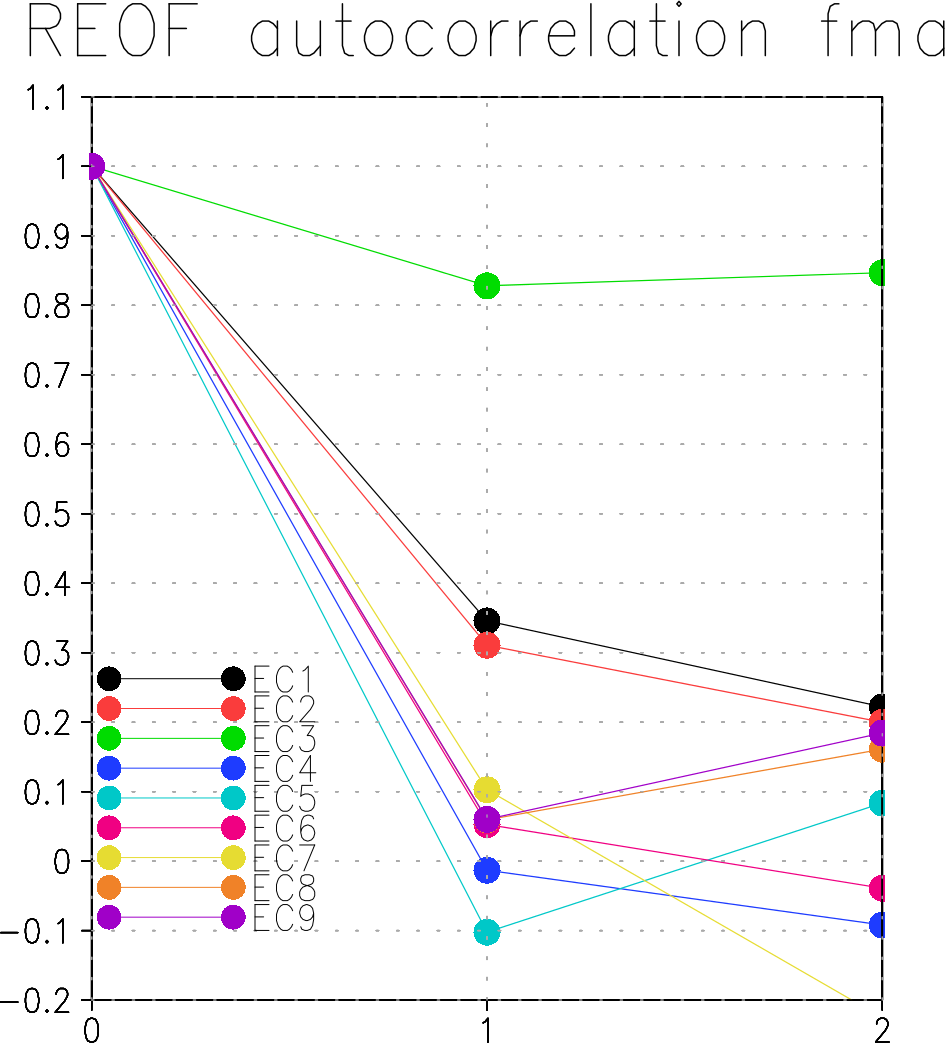
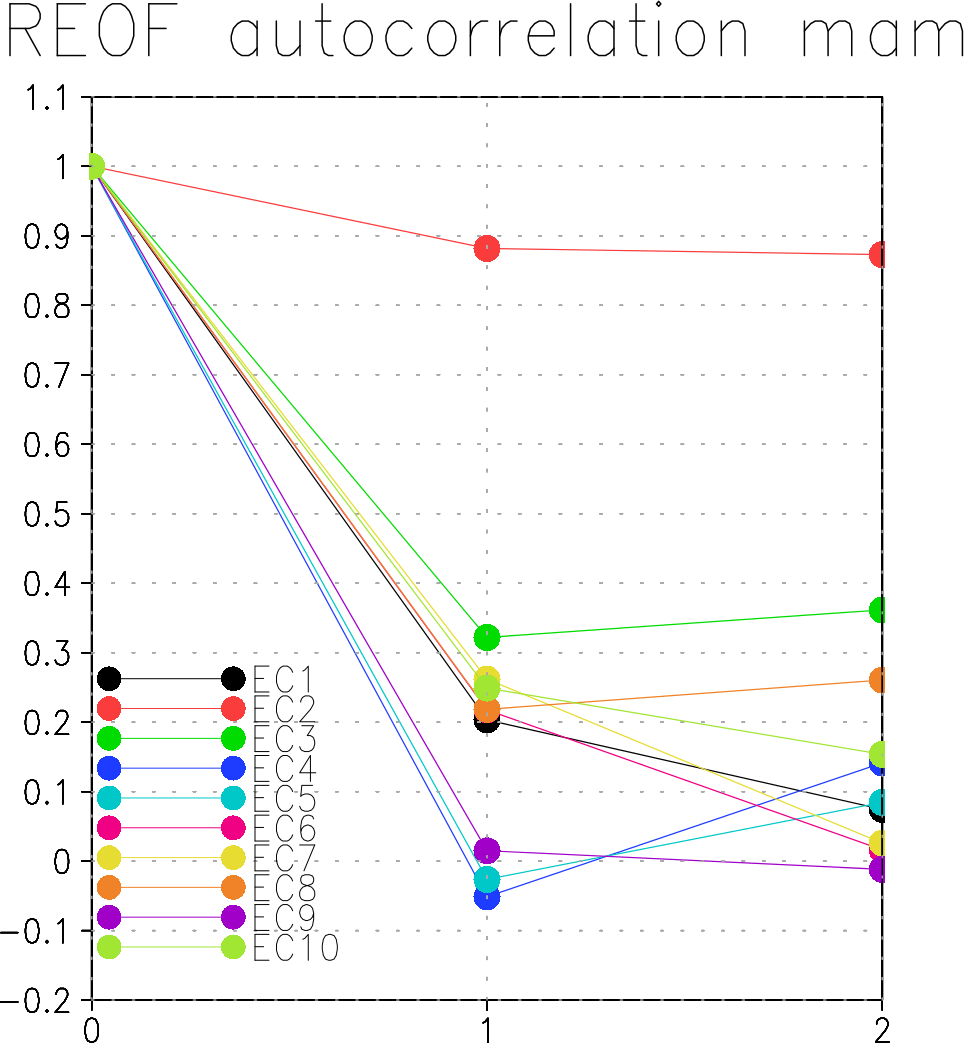
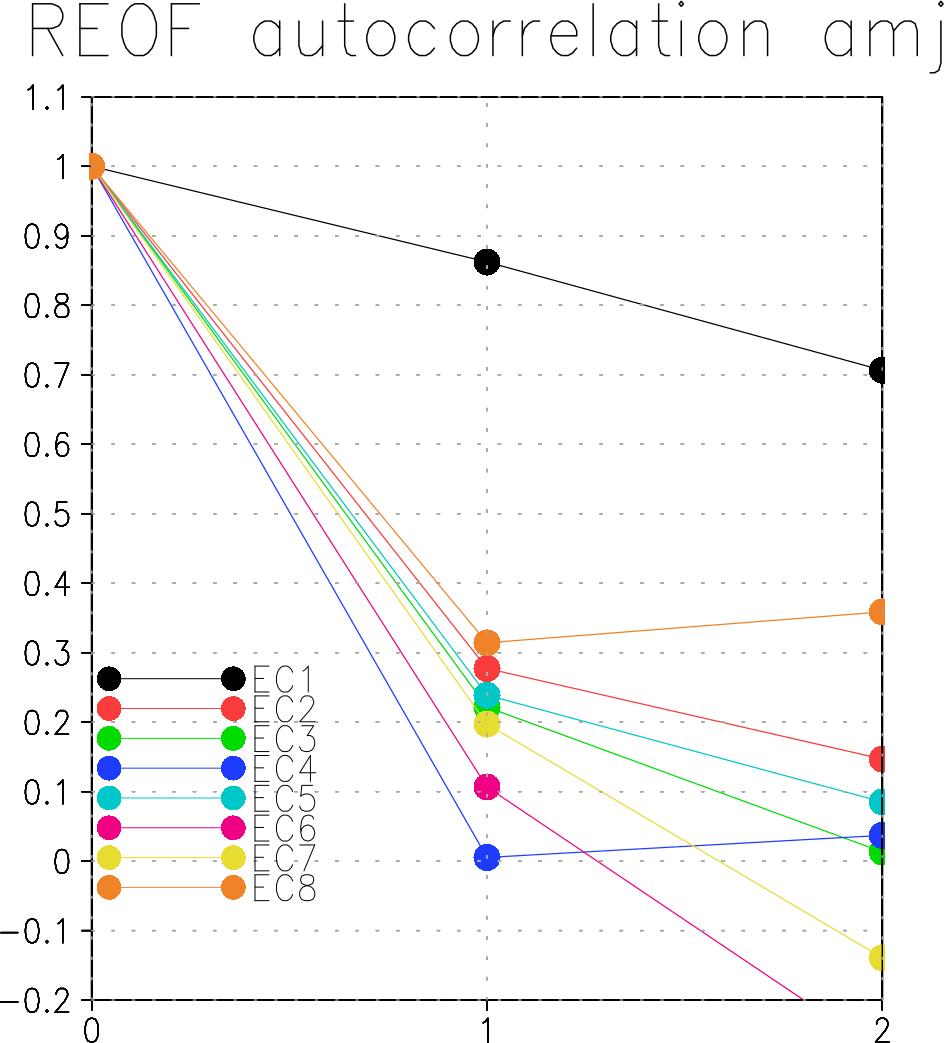
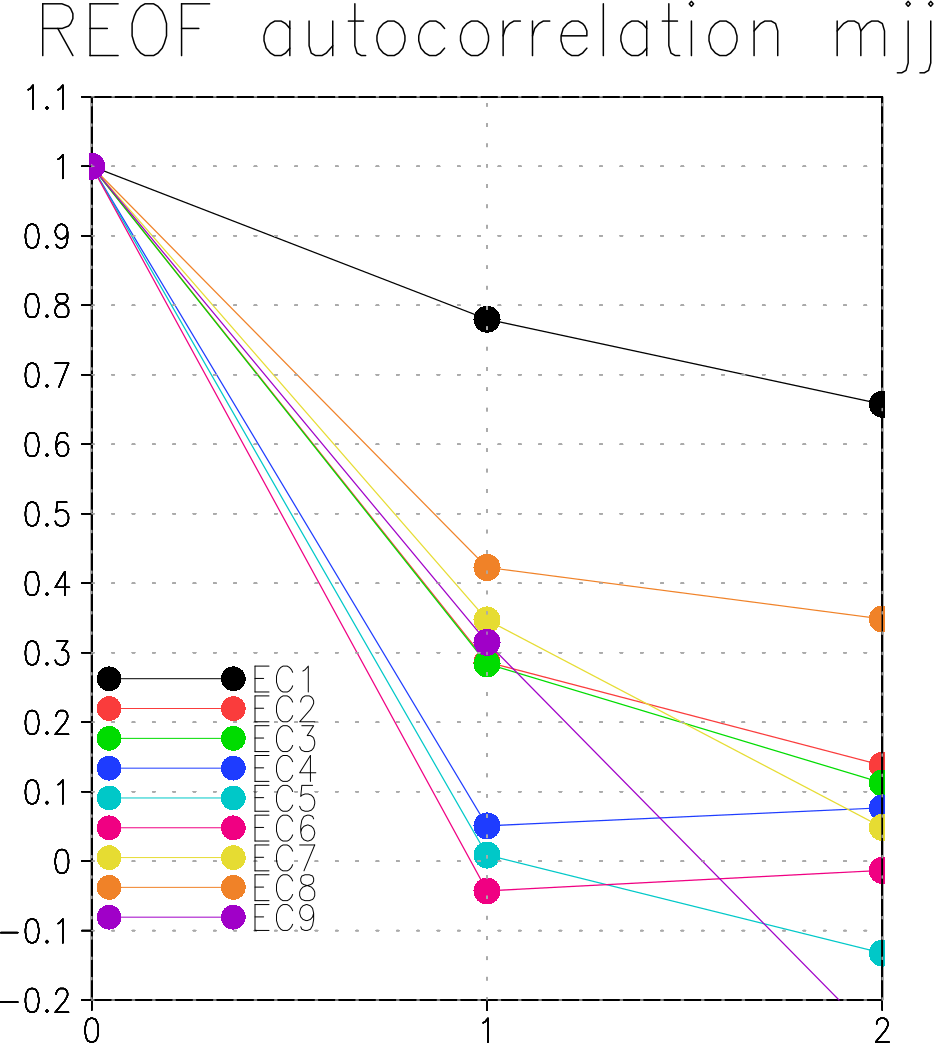
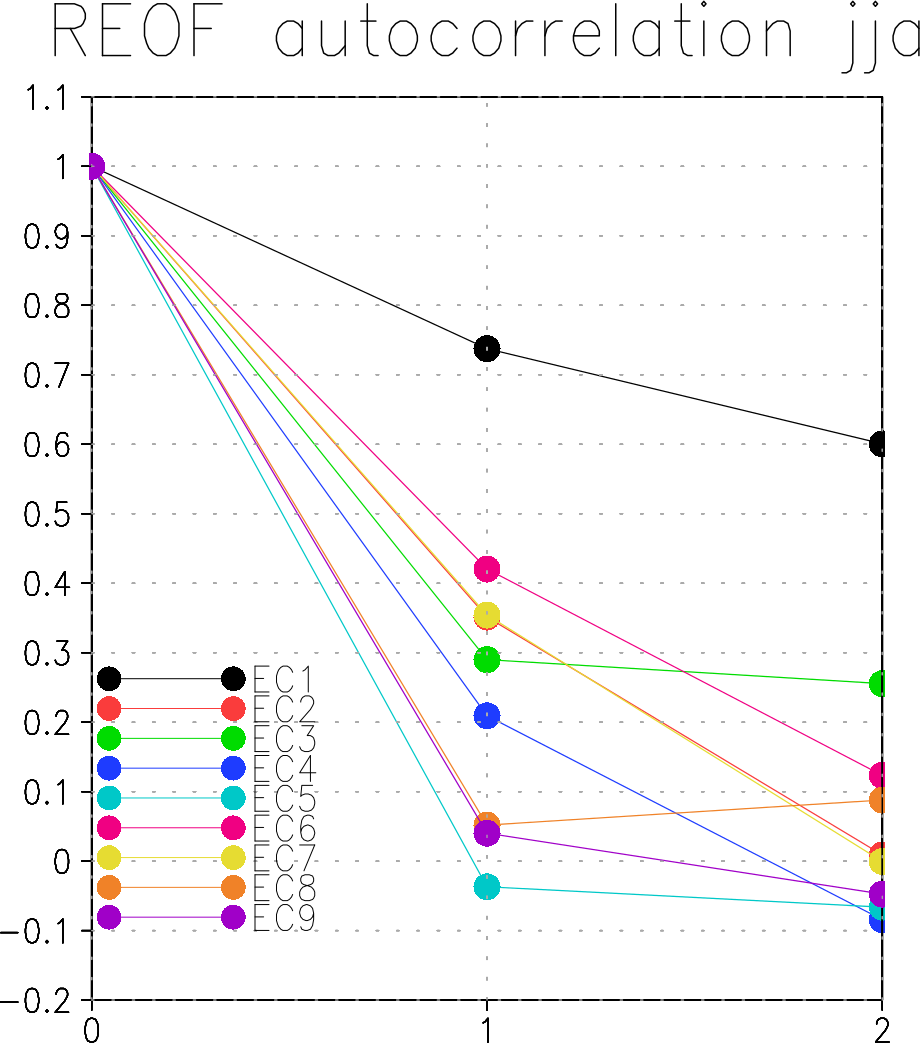
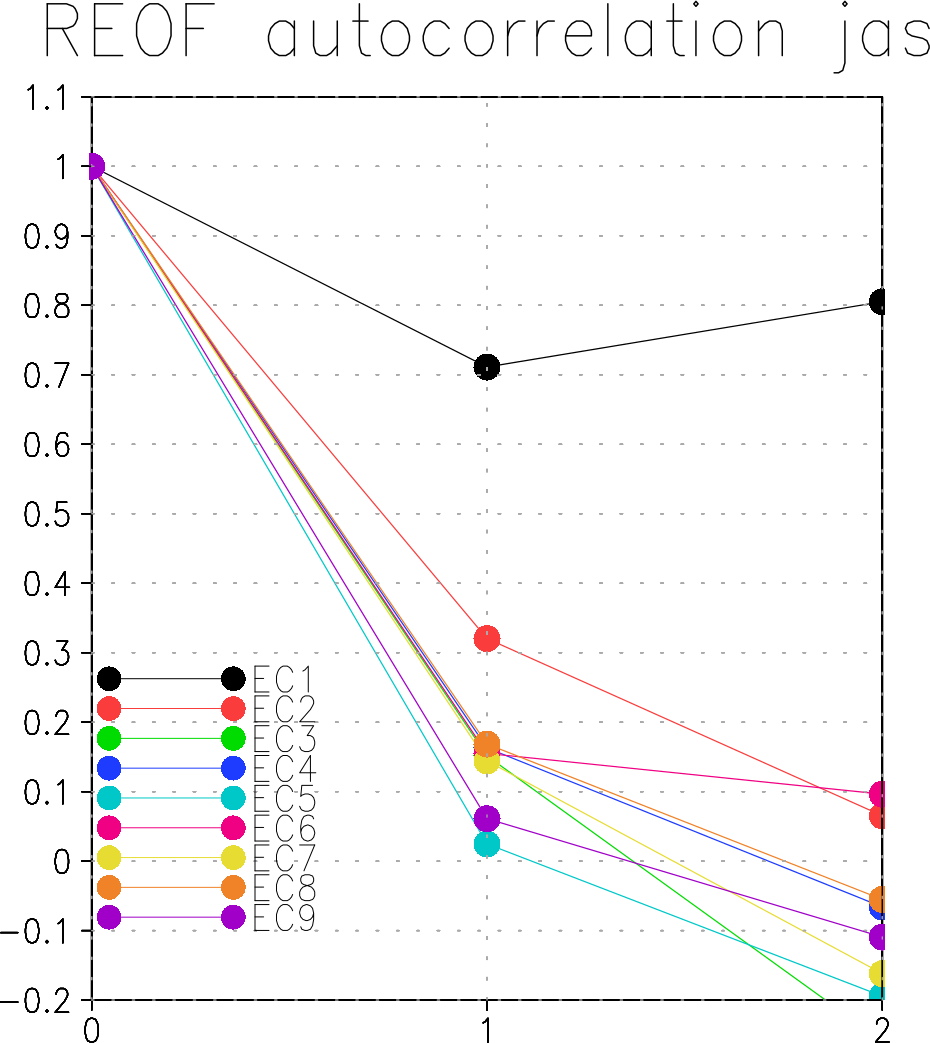
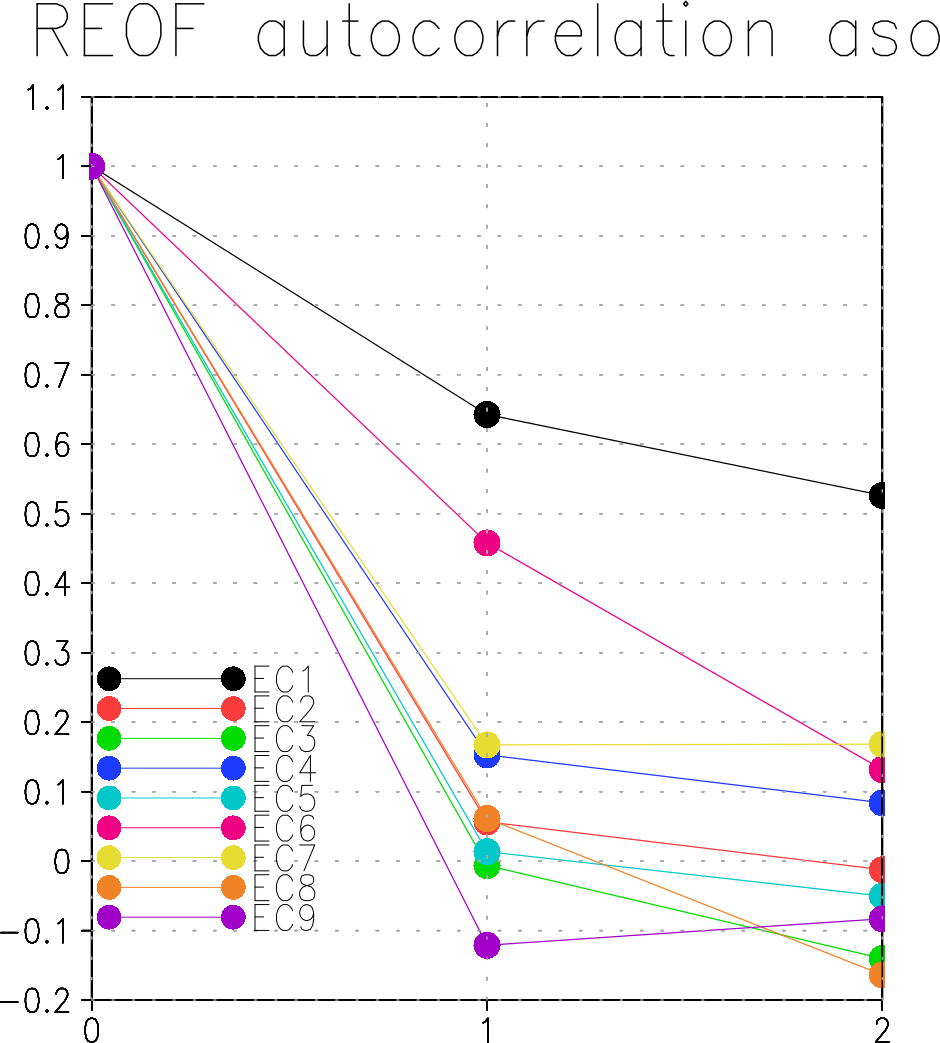
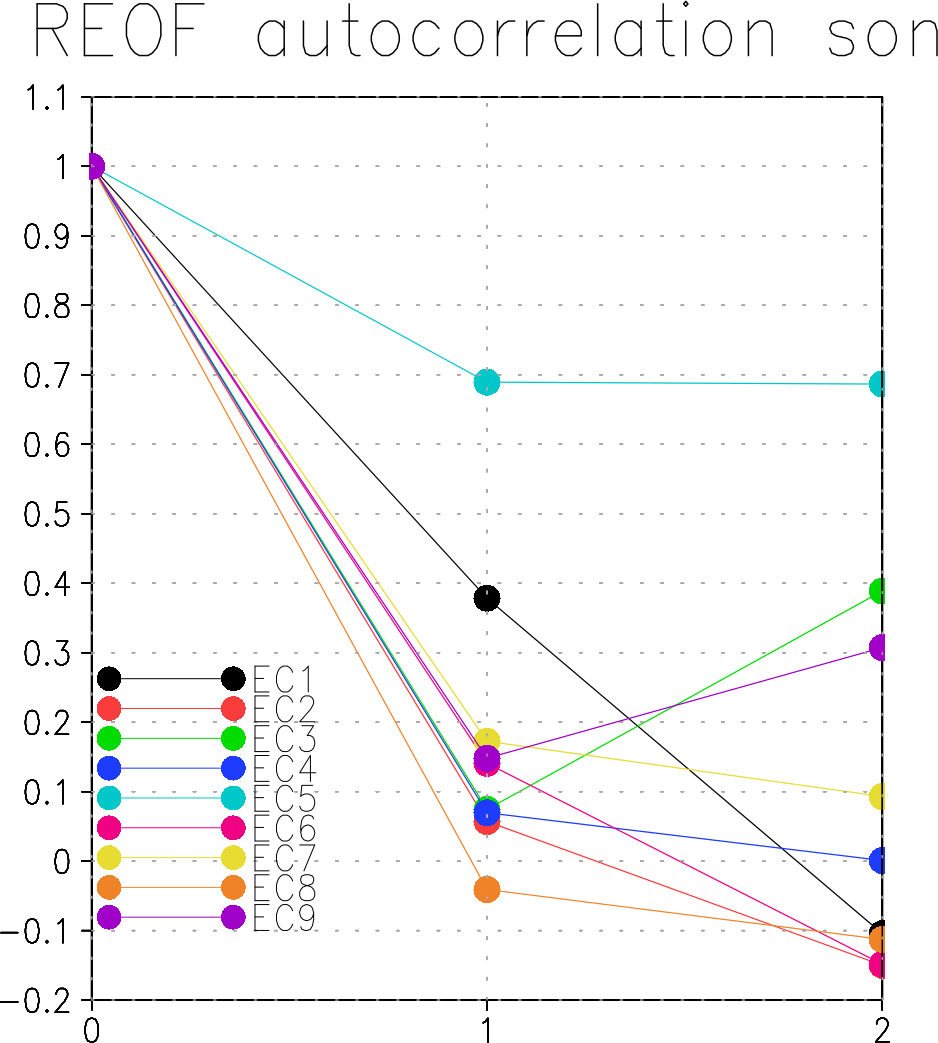
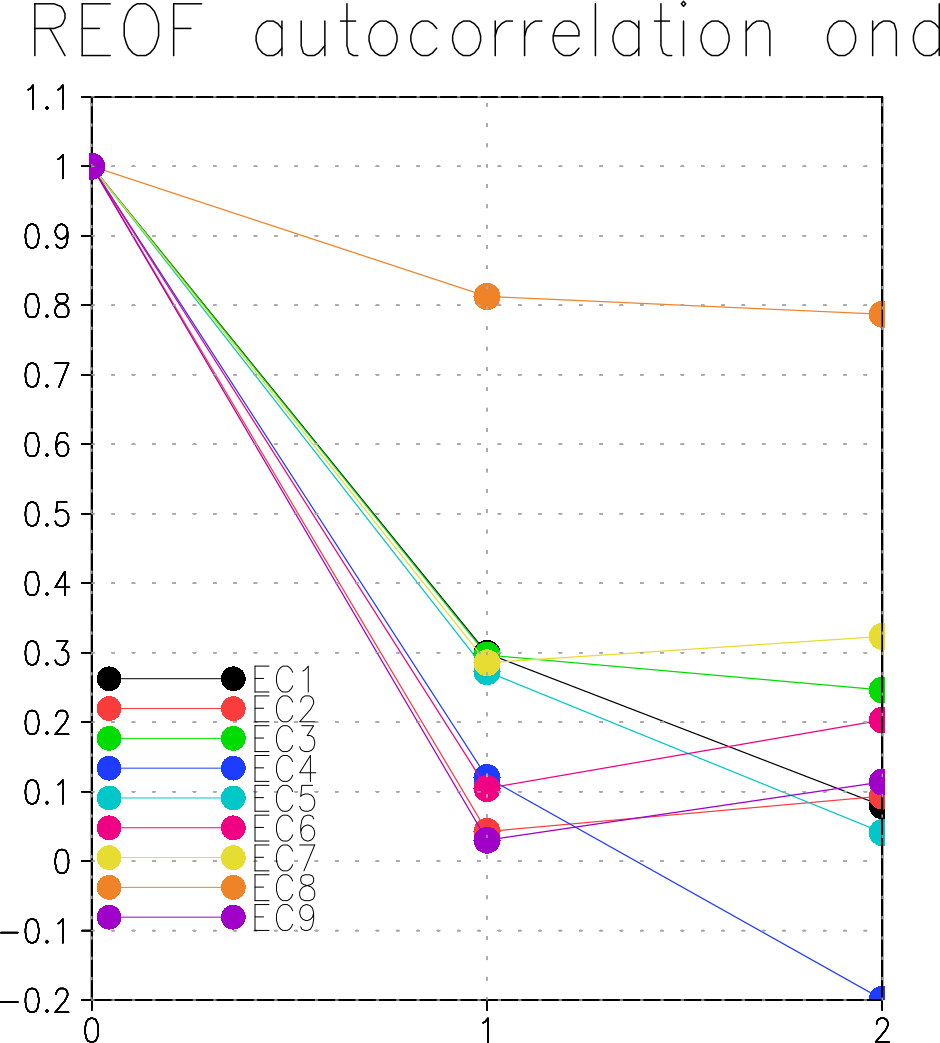
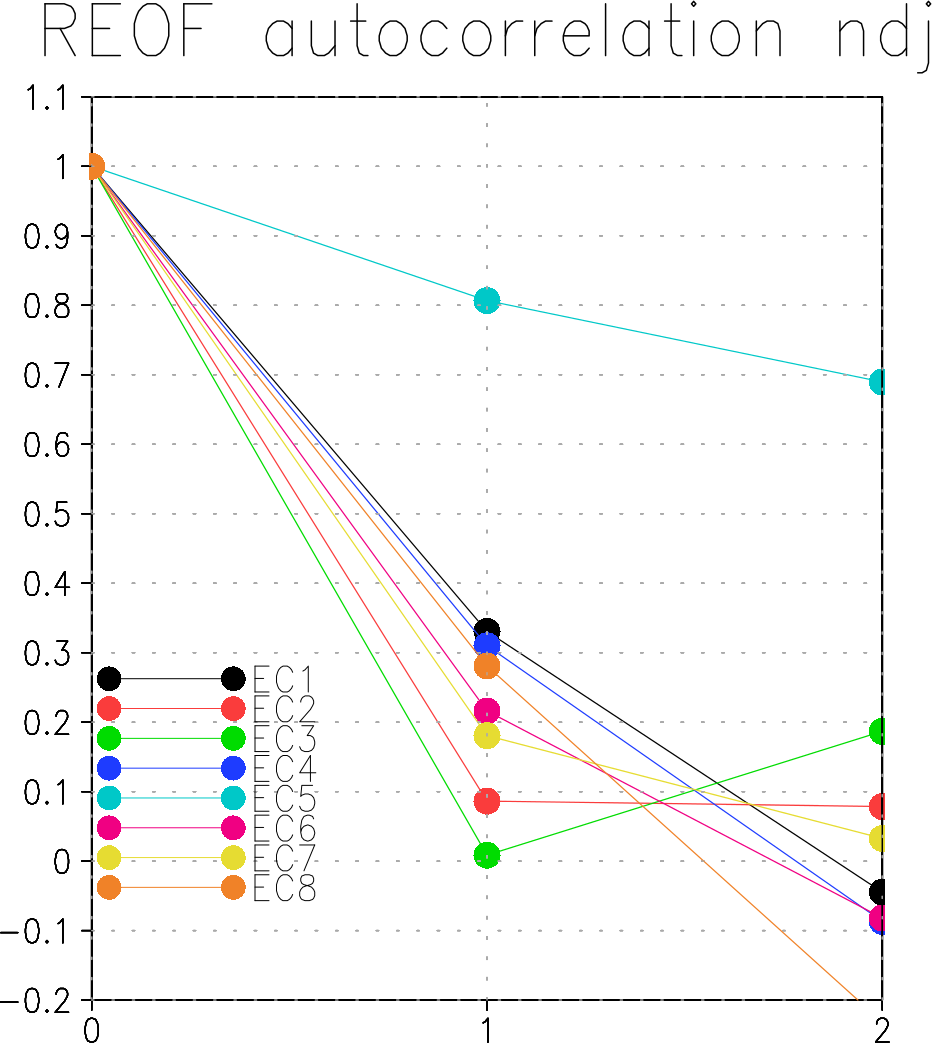
This teleconnection analysis uses rotated EOF analysis of monthly 200-hPa geopotential height anomalies. The analysis period and climate base period are the same: 1979-2018. The analysis uses the Climate Forecast System Reanalysis from 20S-90N; for each three month season, between 8 and 10 patterns are rotated based on analysis of eigenvalues - namely, truncation is preferred between eigenvalues that are reasonably separated. Figures show the correlation between the principal component associated with each pattern and 200-hPa height, SST (from ERSSTv5), and 2-meter temperature (from GHCN+CAMS), all shaded at 0.1 intervals. Importantly, all data are detrended prior to analysis, and the covariance matrix is utilized (weighted by the cosine of latitude).
For lead/lag SST correlations, see here.