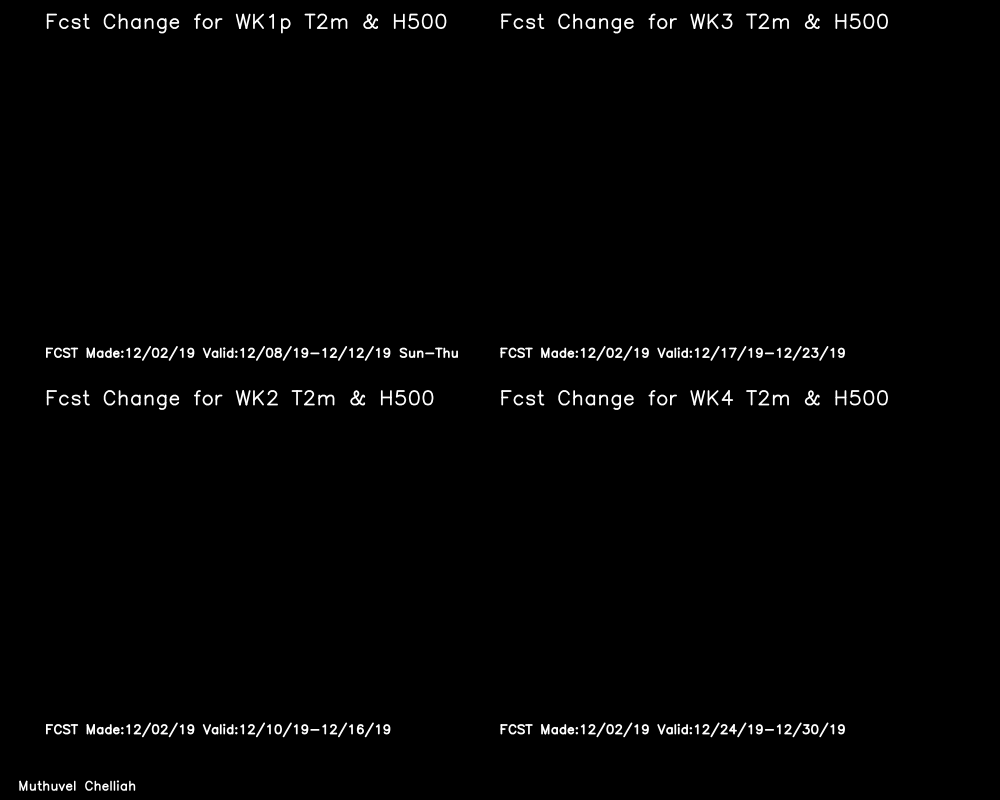
WEEKS 3-4 forecasts for the US & vicinity
How Temperatures across the US will be as compared to Yesterday's Temperatures?
Instead of getting future forecasts as "anomalies/departures" from some long-term (30 years or so)
mean conditions called as climatology or normal (that you may not know or remember), how about,
if you can get the forecasts as "changes" from yesterday's "weather conditions" that
you felt and experienced just yesterday, that you can actually remember and can relate to immediately,
so you can plan ahead!
This page displays Experimental TENDENCY Forecasts (and not the standard anomaly forecasts) based on
the
NCEP coupled forecast system
model version 2 (CFSv2). By tendency forecasts we mean that the
forecasts for future WEEK1P(days 6-10), WEEK 2, WEEK 3, & WEEK 4 periods mean are computed
as DEPARTURES from just the "forecast day" (and not from some long term climatology)
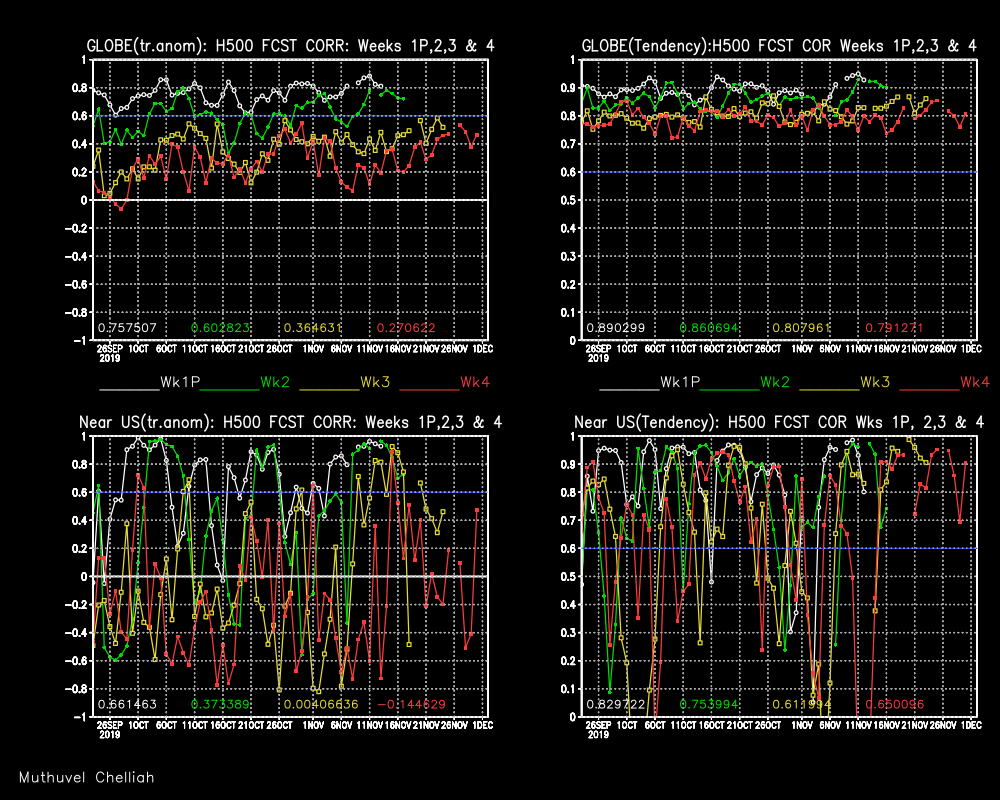
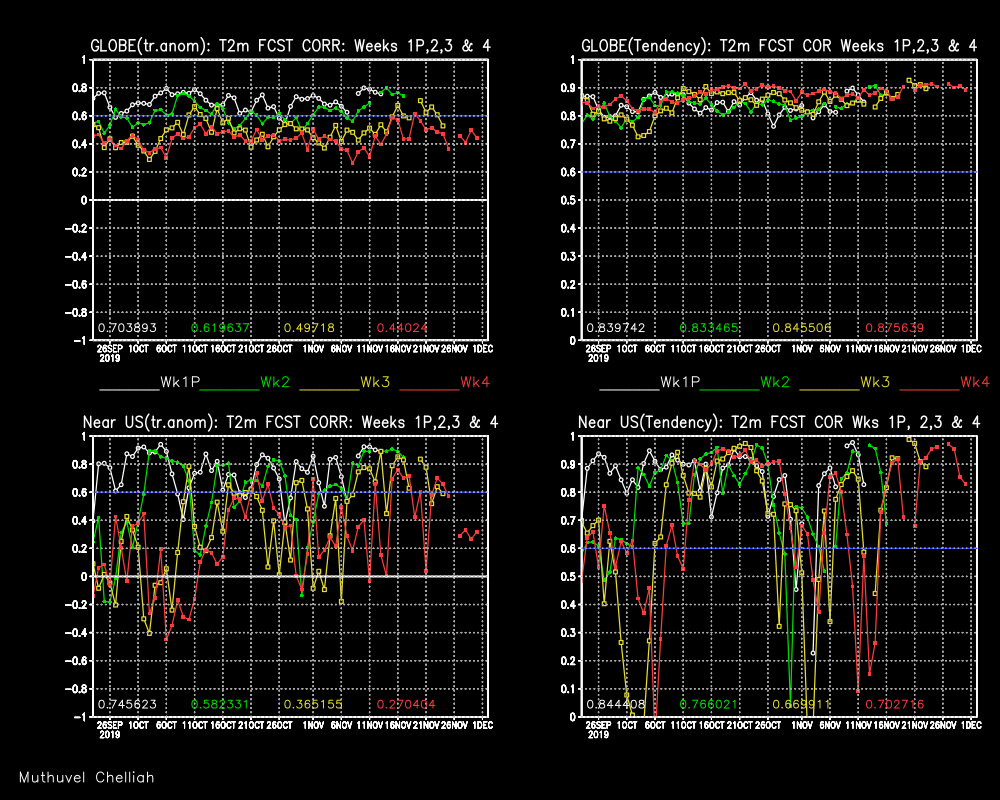
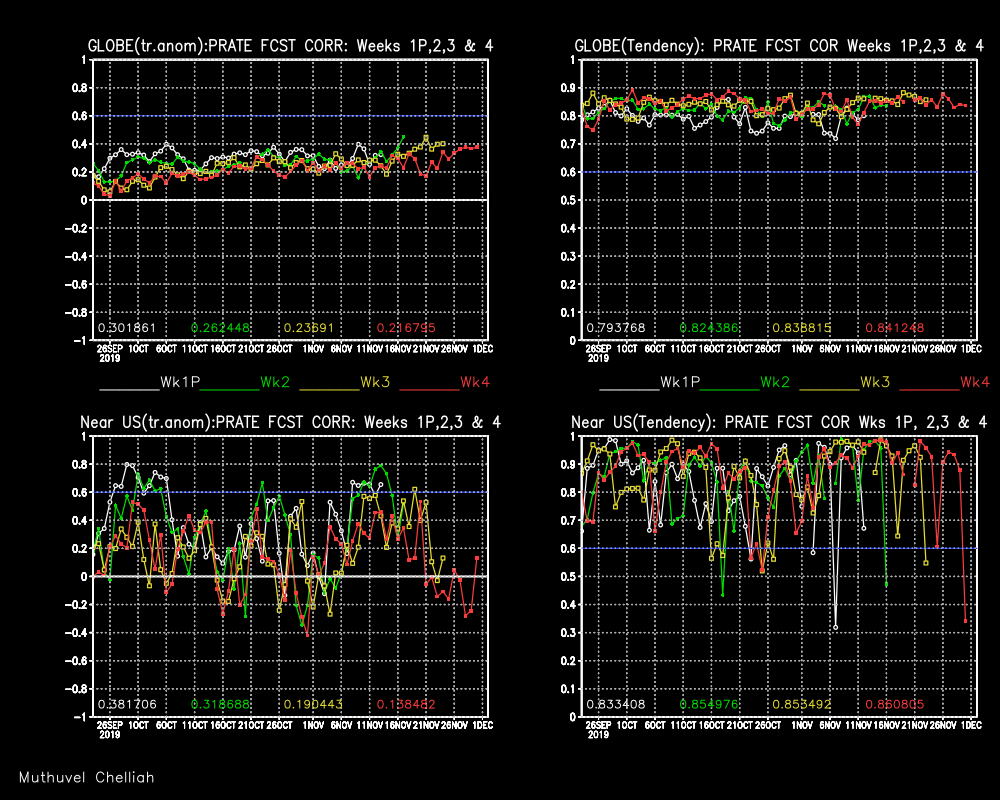
mean analyses. Here the forecast day is yesterday. Time series of Spatial Correlations
between the "forecast tendency map" and the "verification tendency map" for many recent
days are shown as well. Also shown are the most recent performance of wk1p/wk2/wk3/wk4
(all ending yesterday) "tendency forecast" and "tendency verification" maps and their
correlation. For comparison, we will also show side-by-side the 'standard(traditional)
anomaly forecast' map and the corresponding 'verification anomaly' map
over the United States and their correlation. Here, the
traditional "anomaly" is with reference to 1999-2010 base period mean, the period for
which the historical CFSv2 based forecasts are available. Please note The tendency forecast
correlations are generally inflated and are always much higher (as compared to standard
anomaly correlations) as it has the "march of the seasonal cycle" built in, even though
the seasonal cycle in the IC has been removed.
DISCLAIMER: You may use these experimental products only at your own discretion,
as appropriately and with caution.
The forecasts shown here are the average of the 16 member ensembles run every day
(4 per 00/06/12/18 Z) in operations at NCEP.Every day ~5:40 AM EST or 10:40 GMT
16-member(4-each from 00/06/12/18Z) averaged forecasts from previous day (YESTERDAY)
are updated. The first forecast day is today, 2nd forecast day is tomorrow,
and so on upto week 4. All days refer to Greenwich Mean Times(GMT).
CAUTION :
While every effort will be made to routinely update the products in this
website, the products shown here may not always update everyday
since the jobs run on research and not operational computers.
More importantly, the forecasts shown here
are not the official CPC or NCEP or NWS forecasts or outlooks.
The official forecasts or outlooks, may be found at official
CPC website.
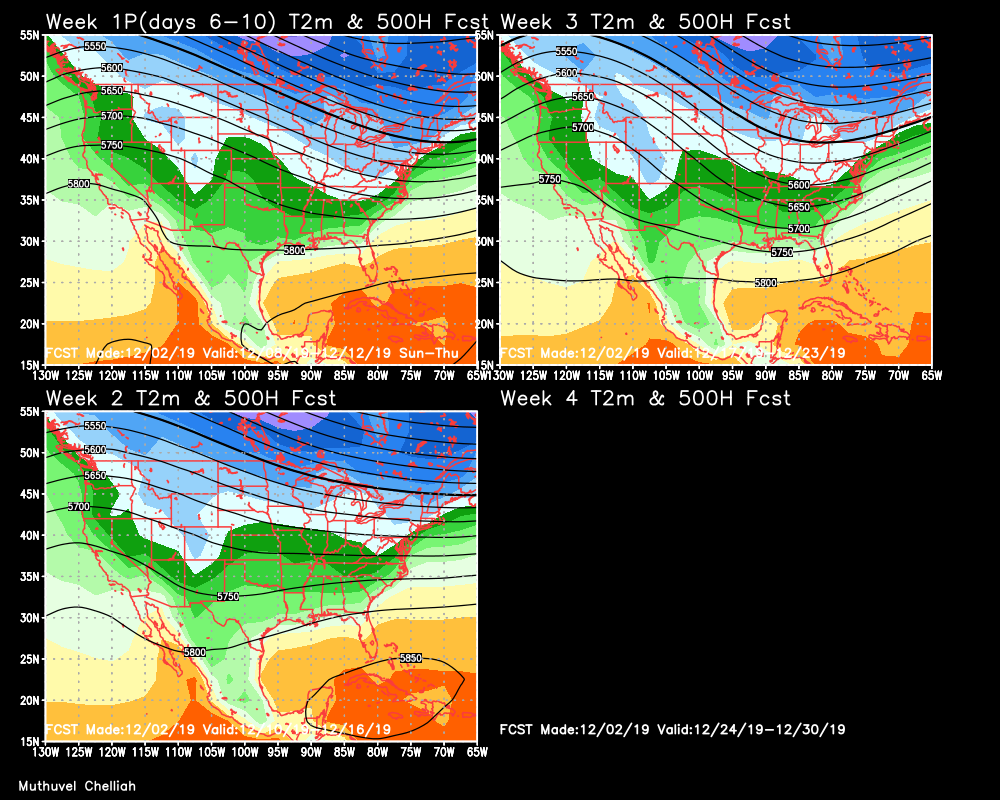
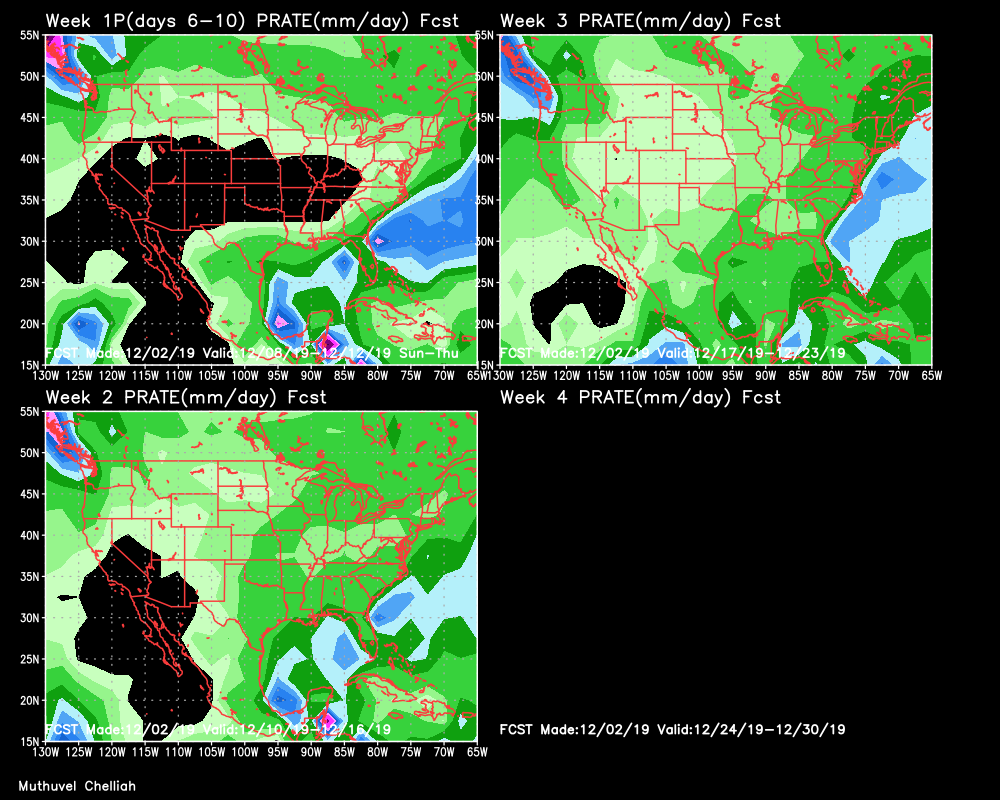
Future Weekly Forecasts as CHANGES/Differences from
THIS yesterday mean condition - updated daily
Future Weekly Forecasts as Total fields
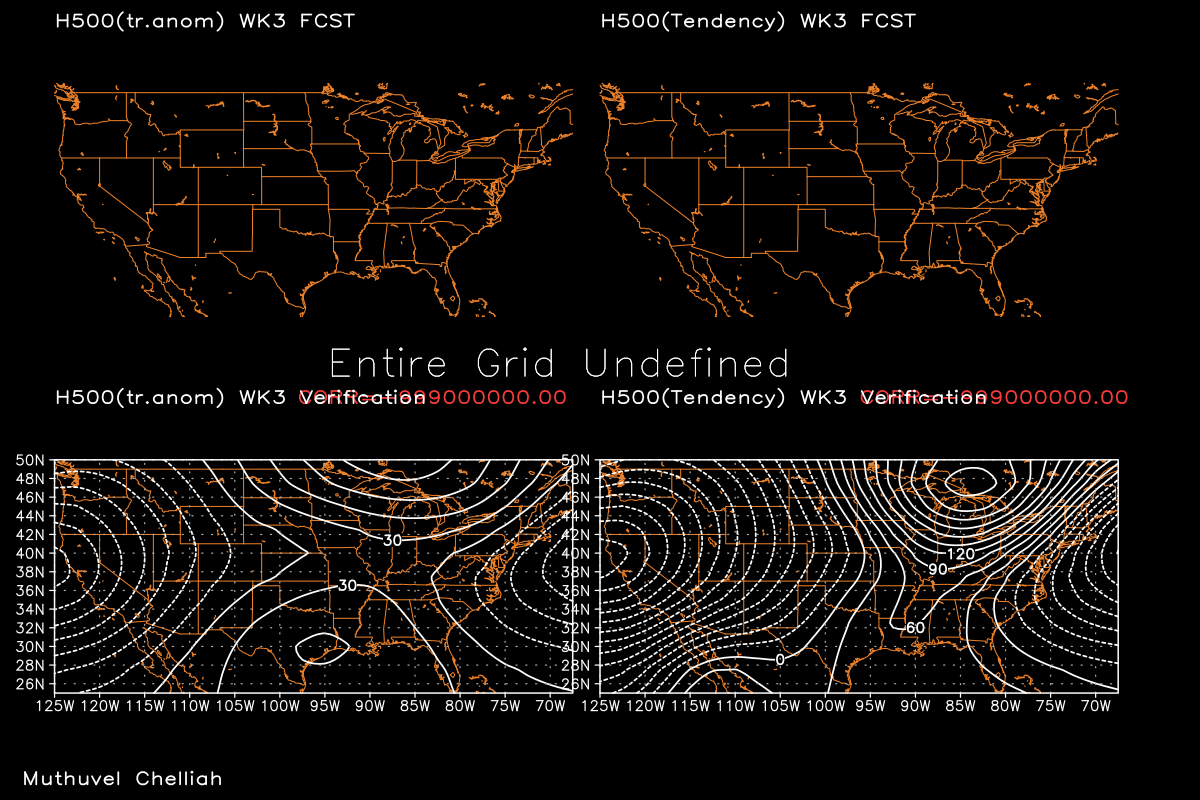
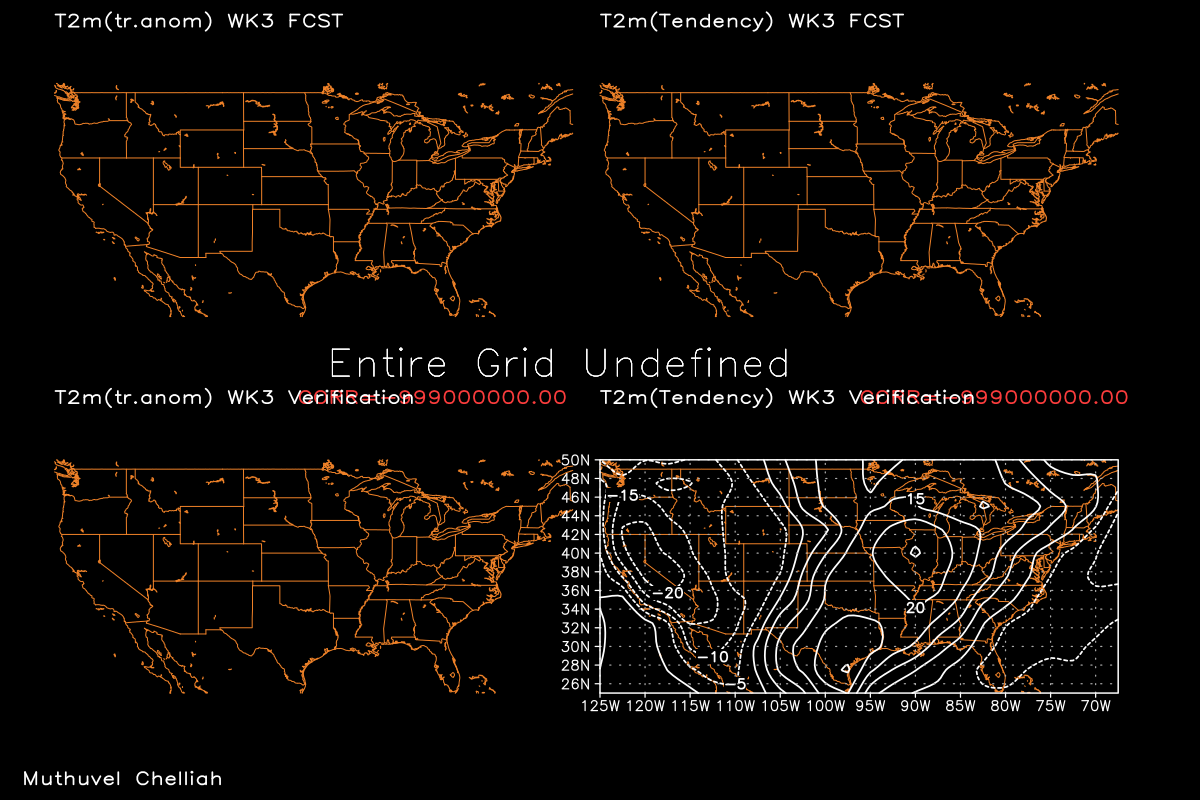
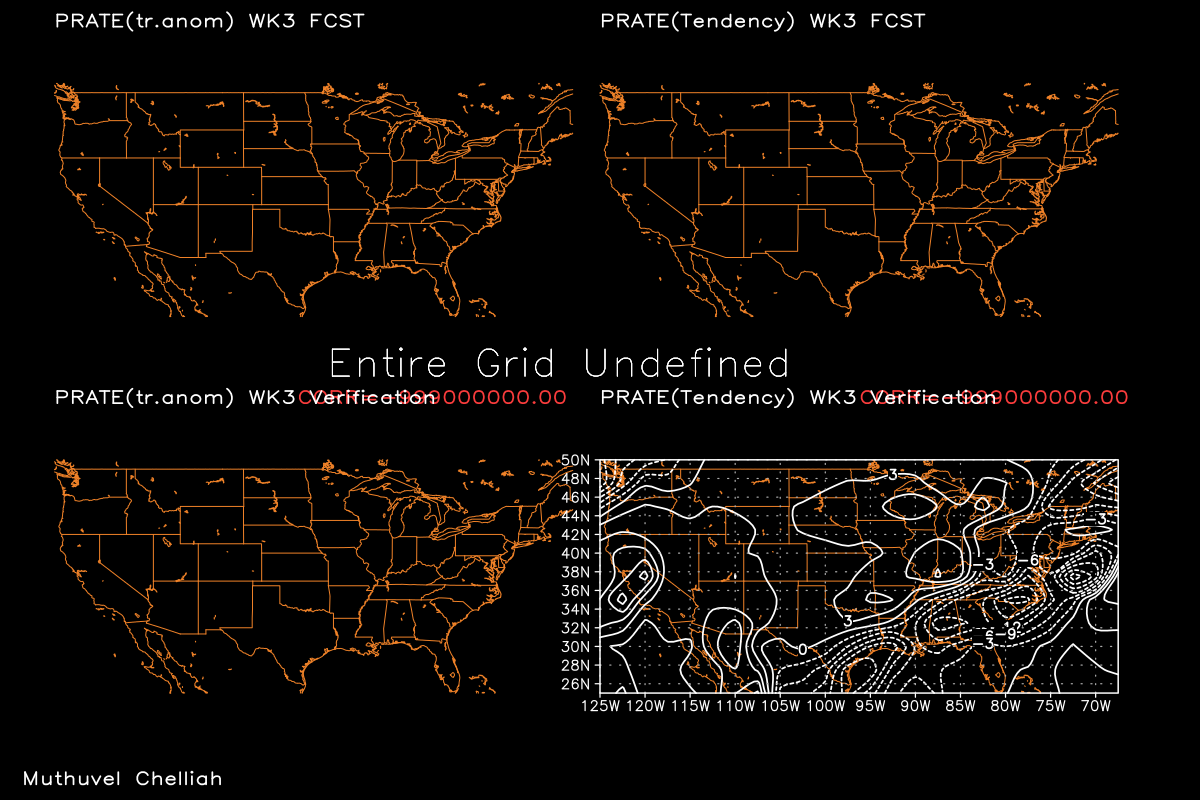
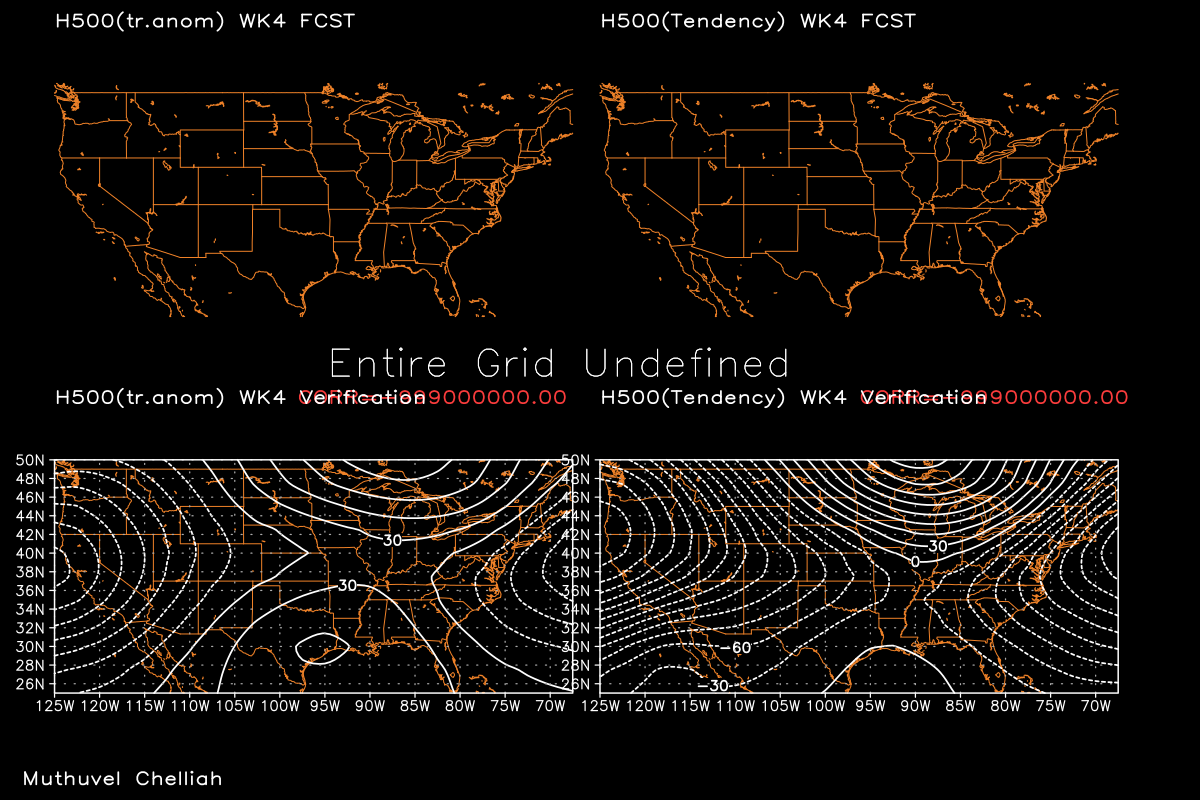
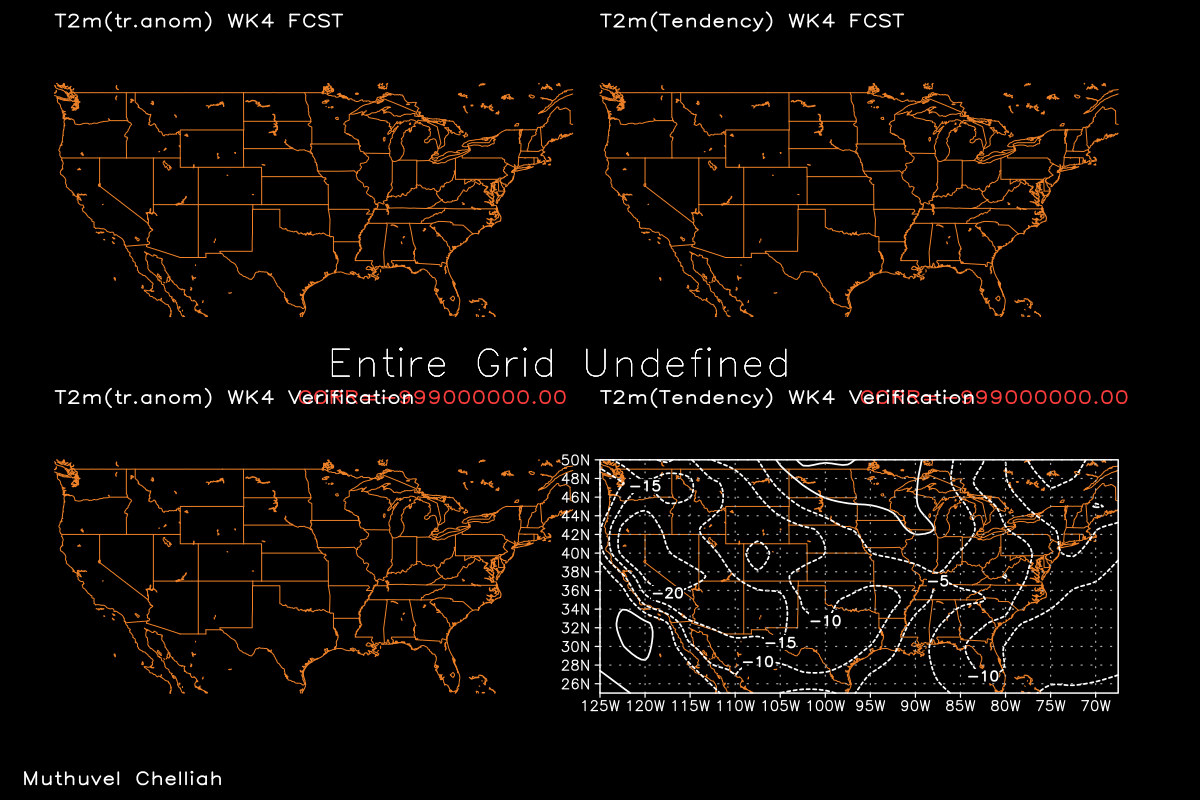
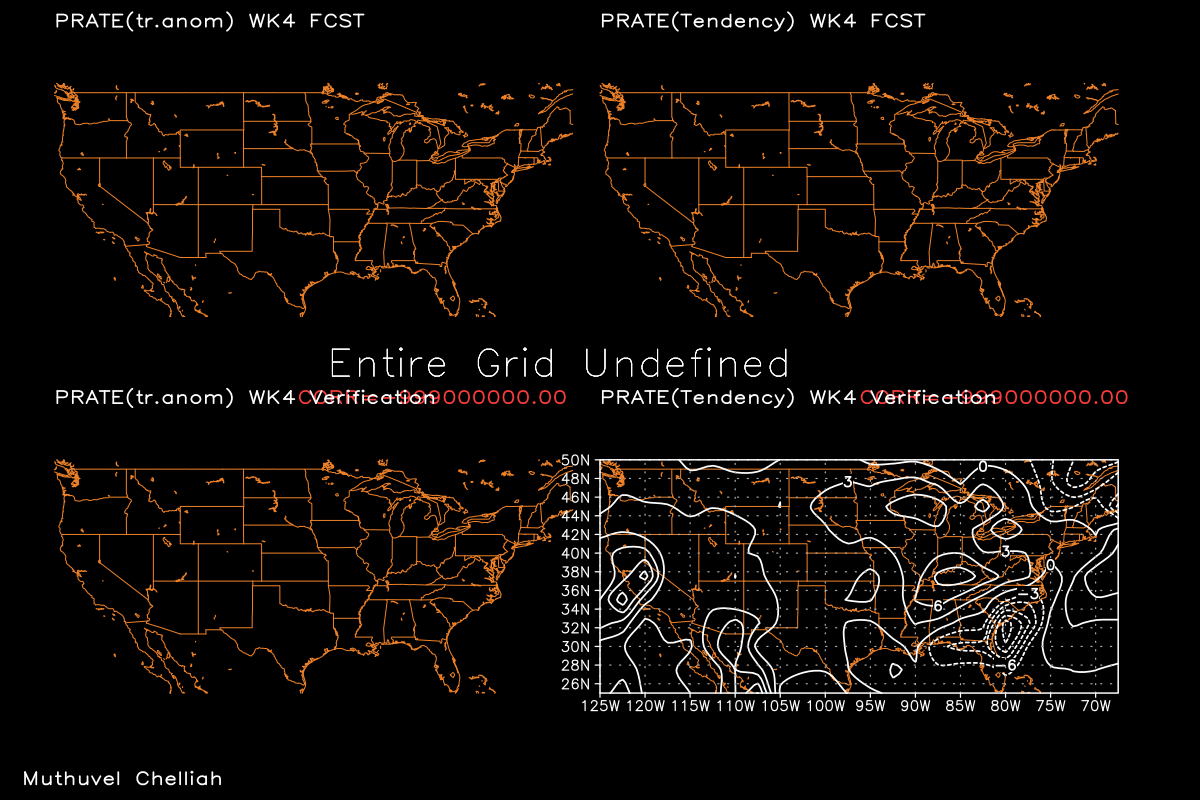
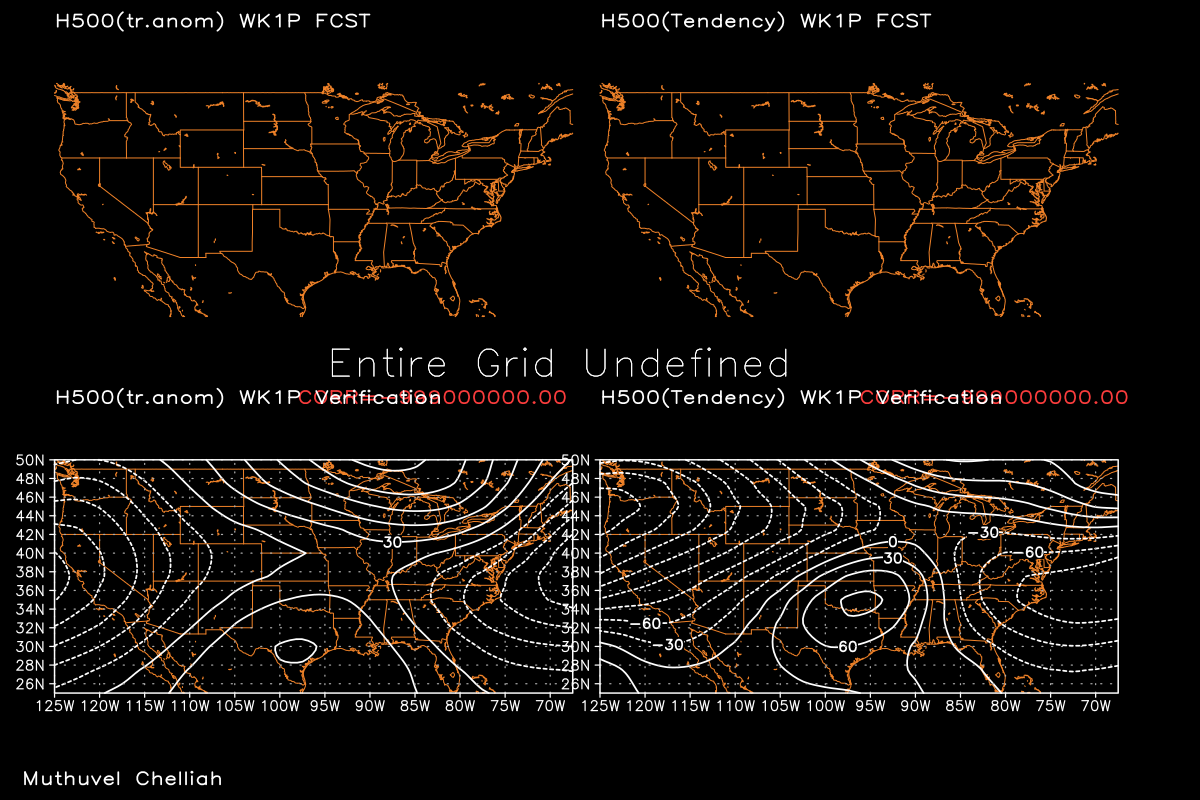
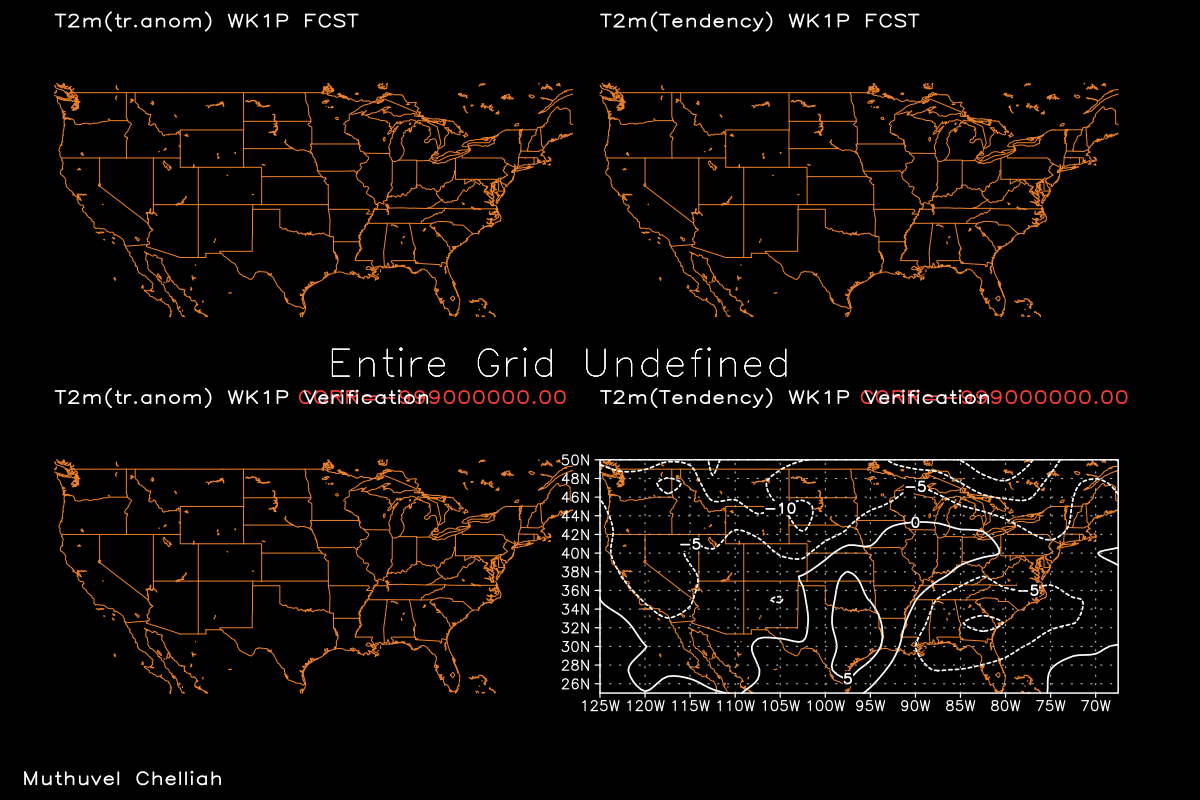
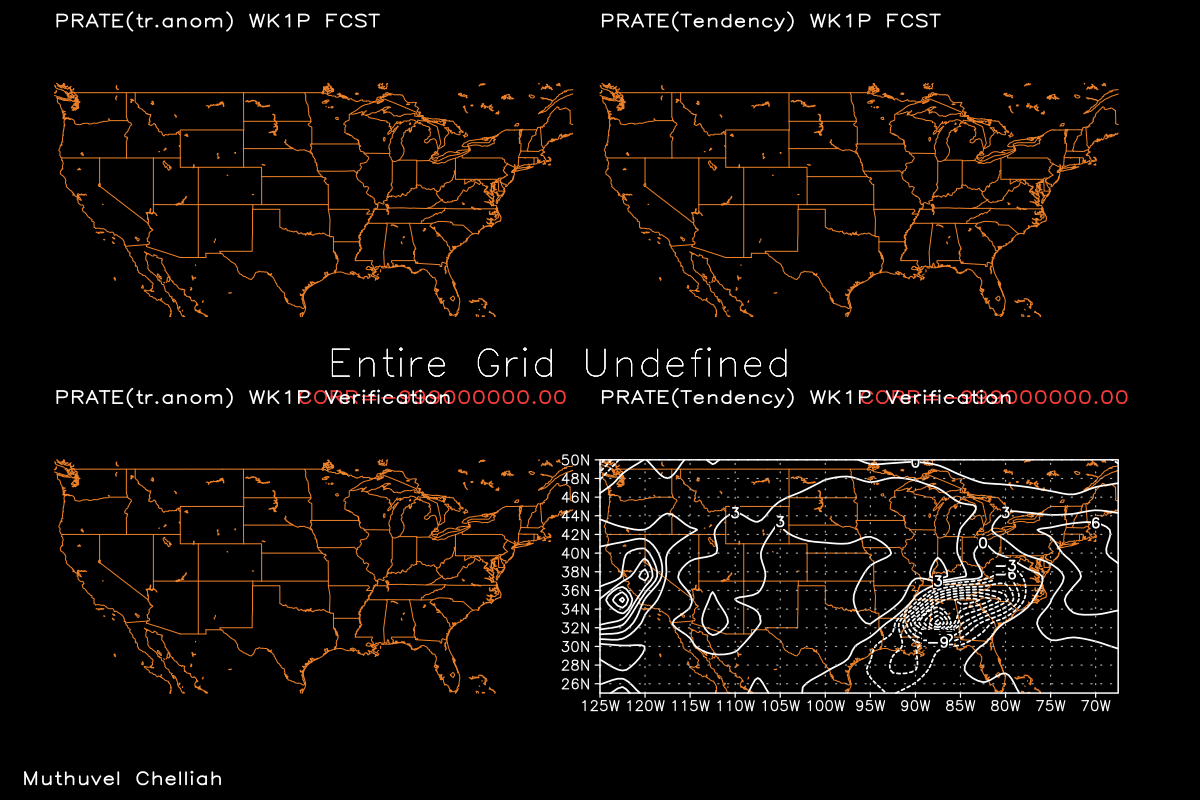
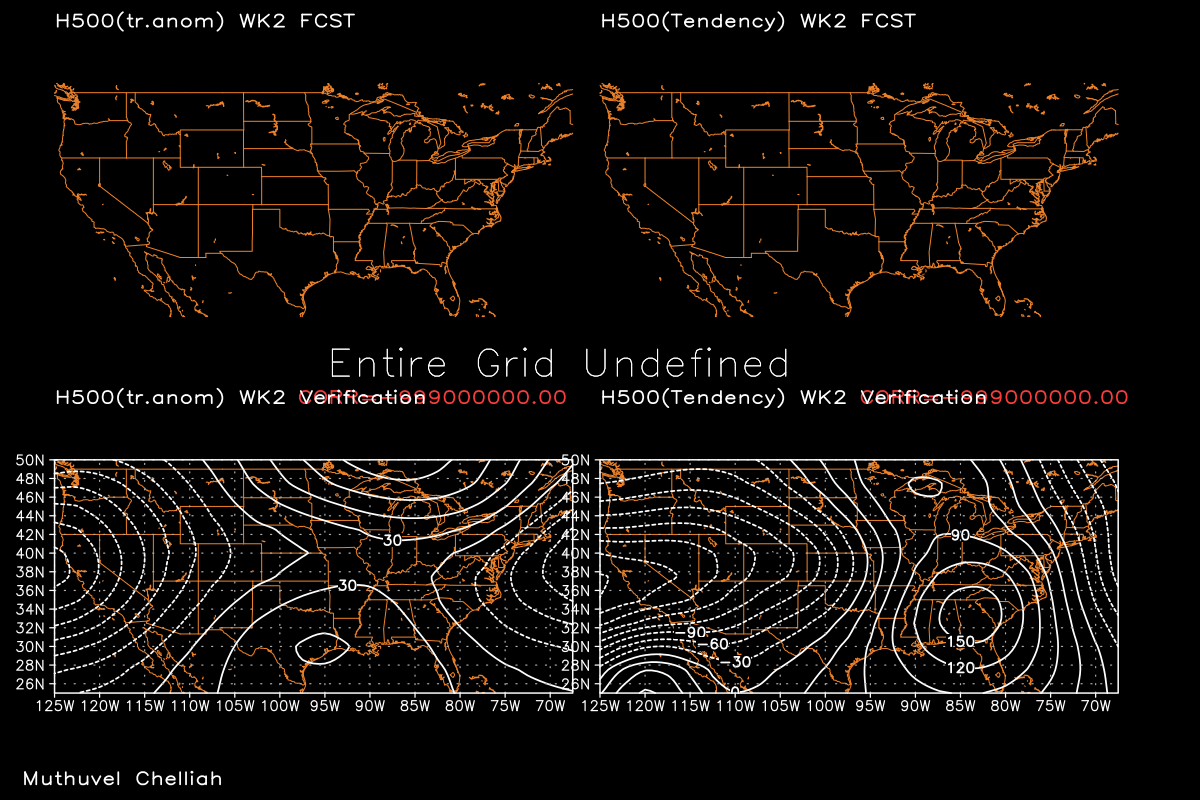
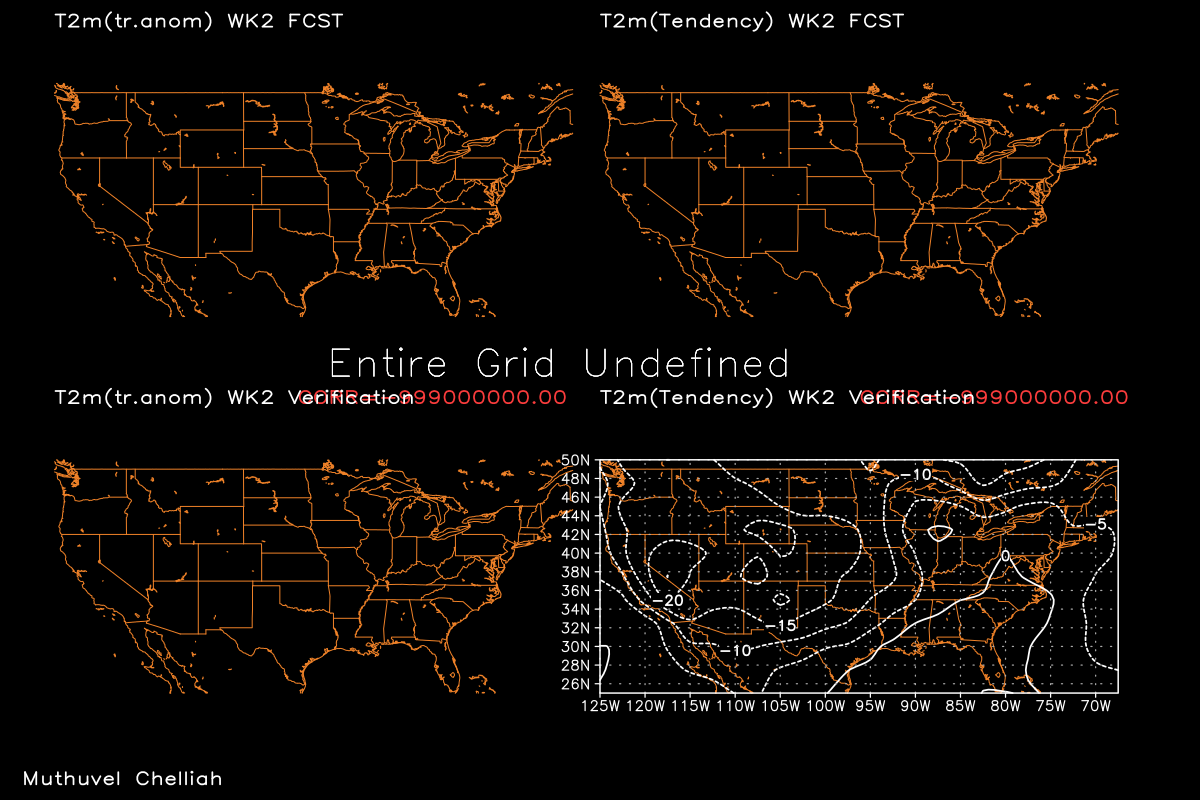
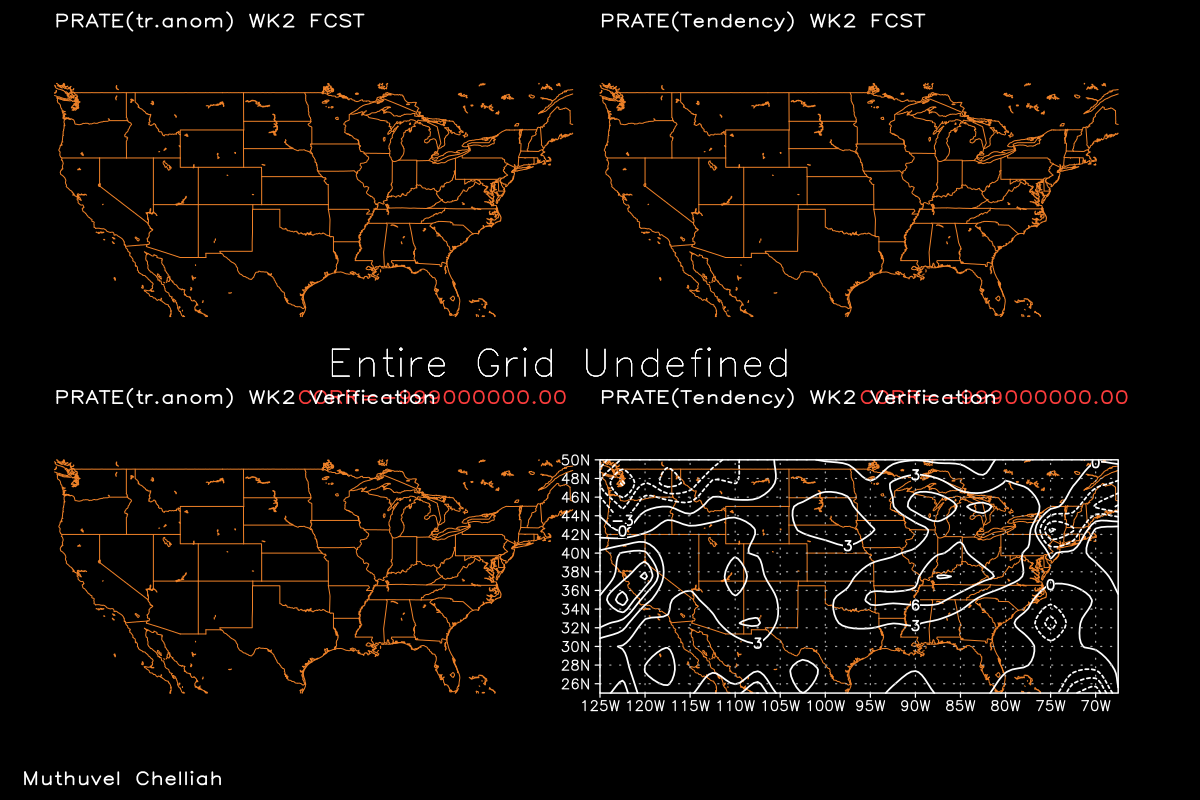
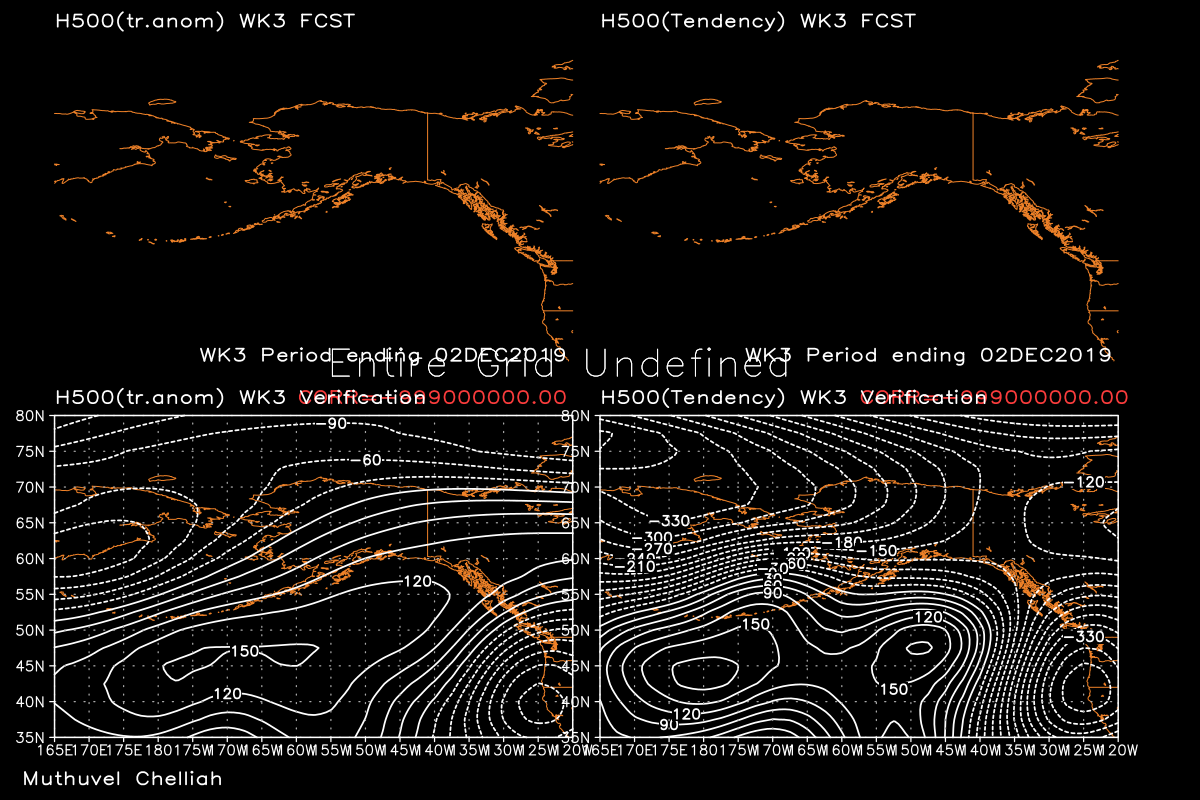
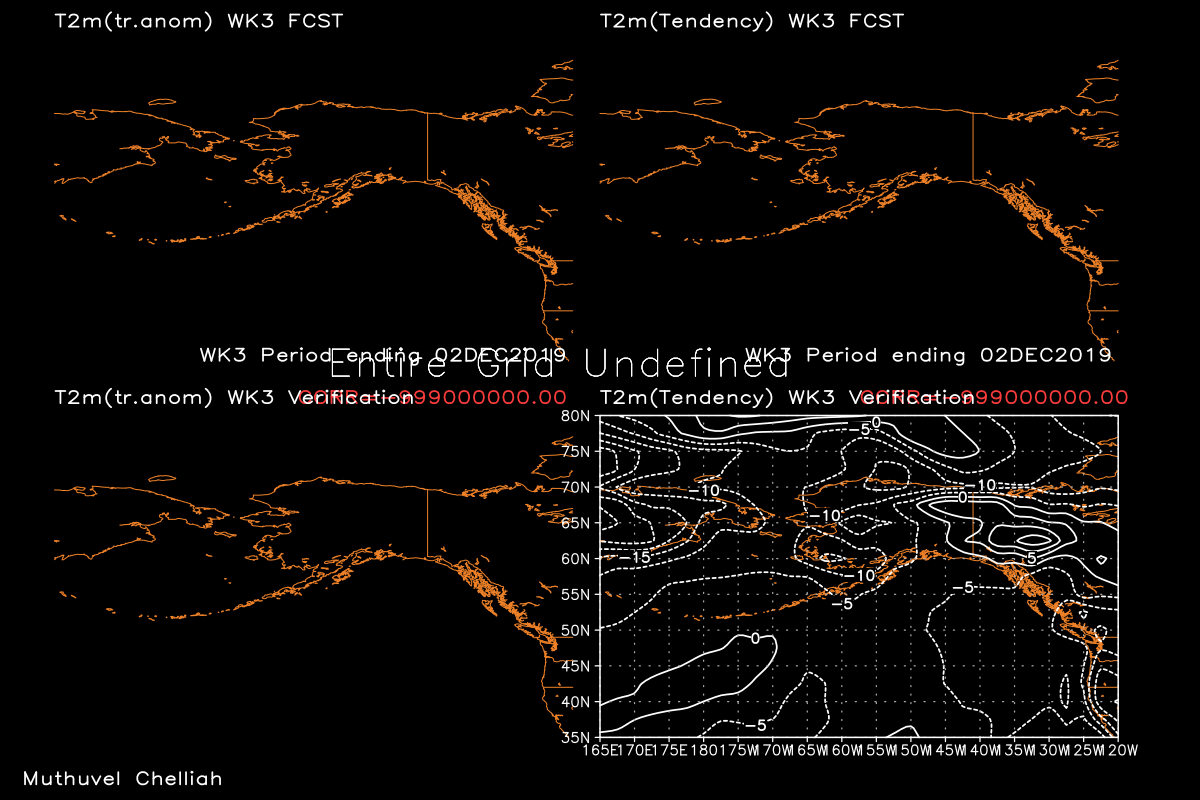
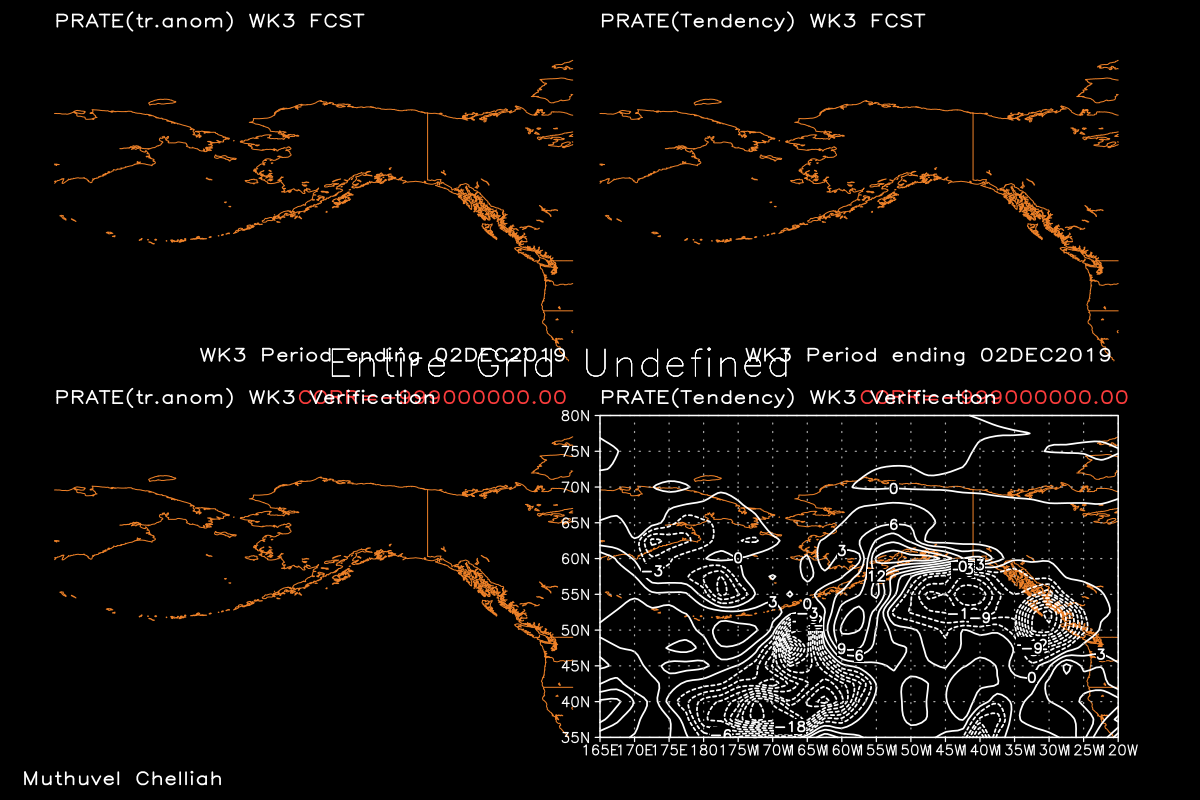
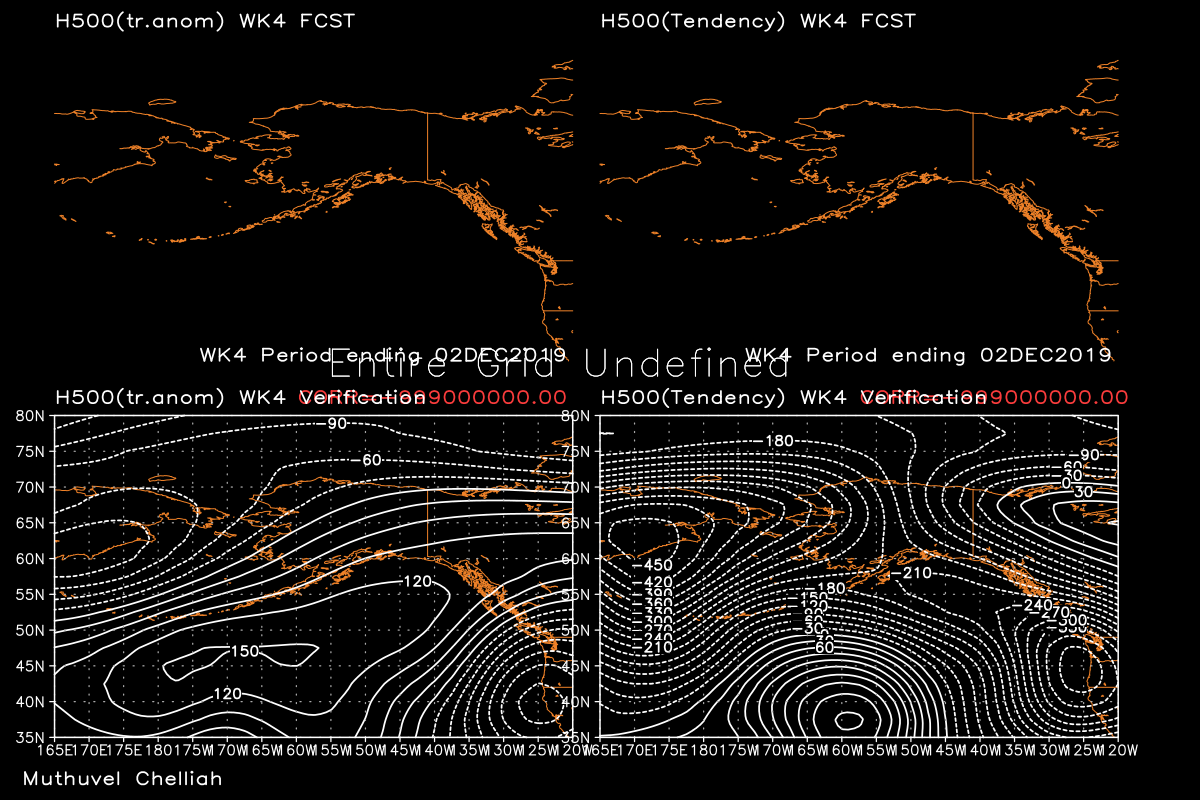
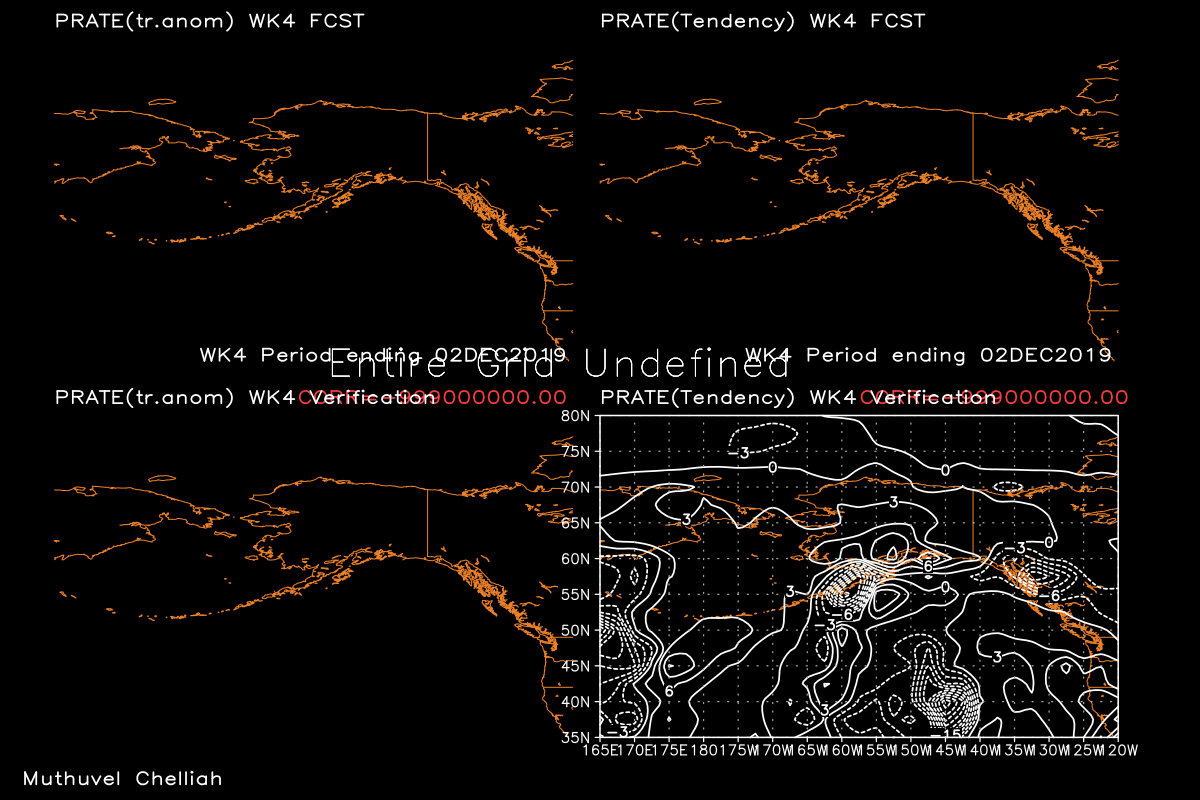
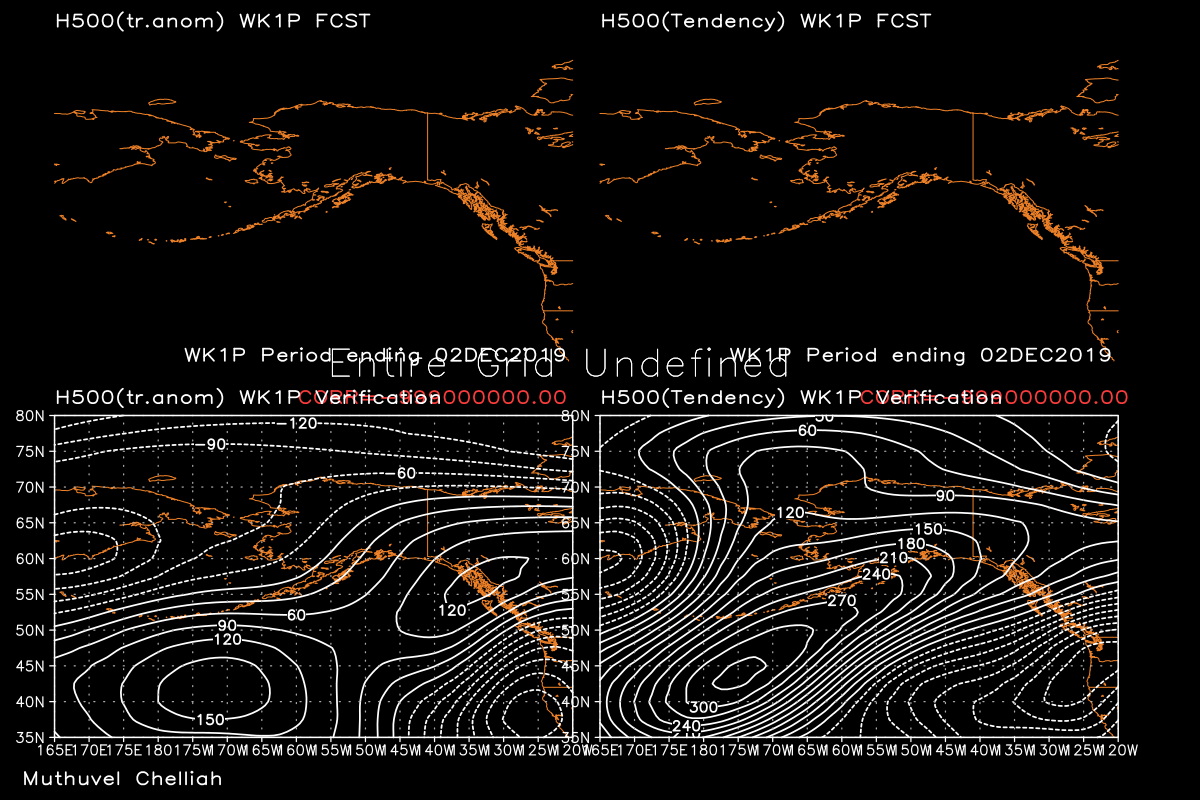
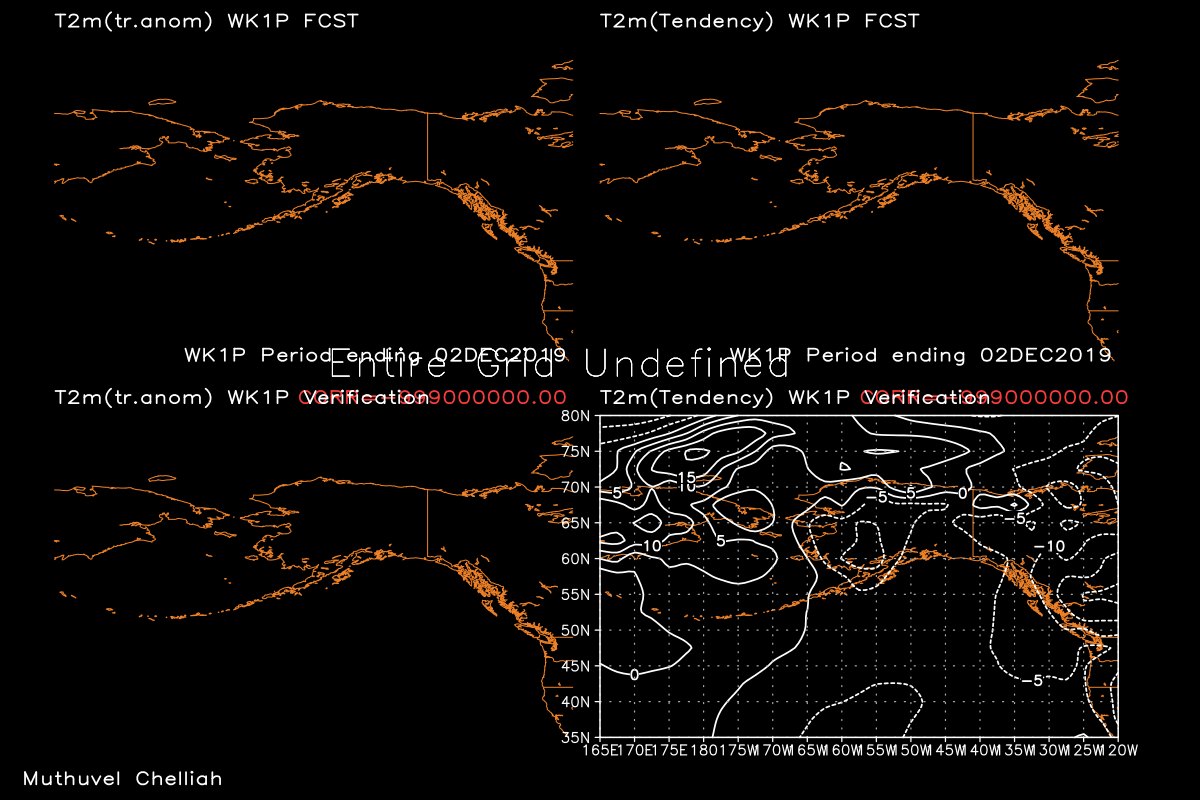
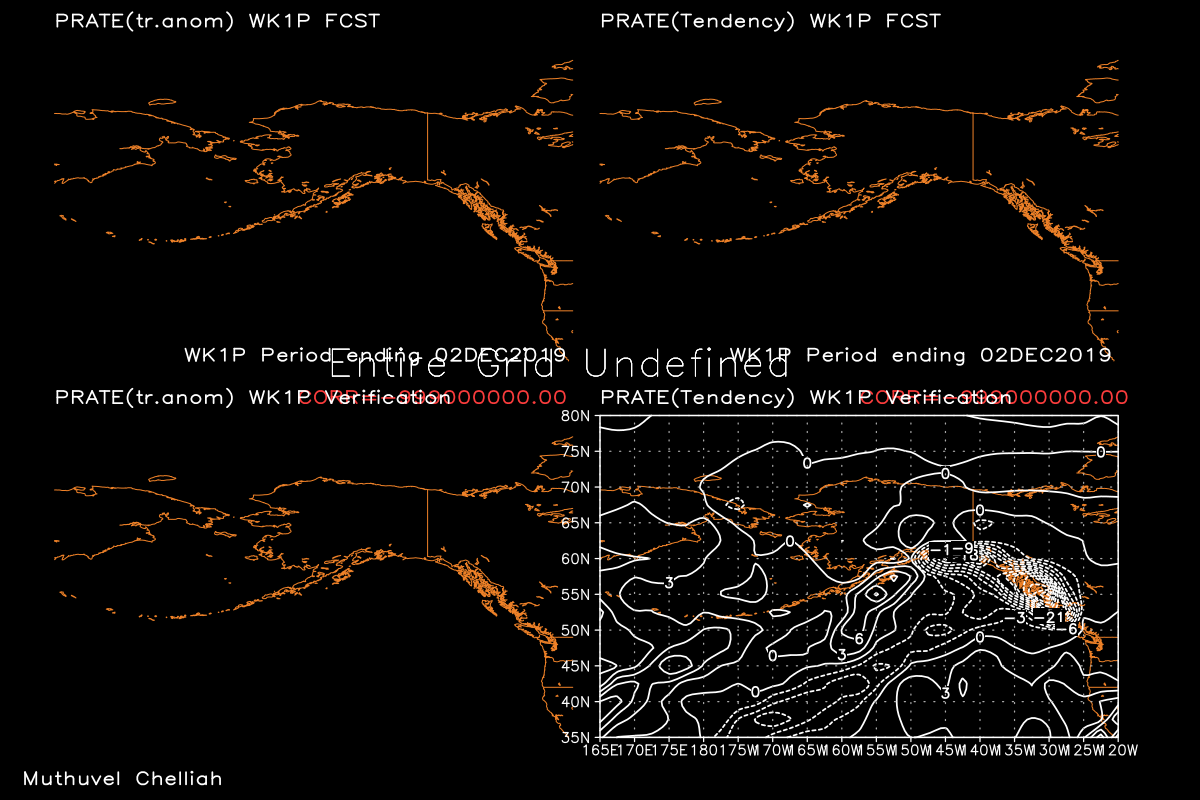
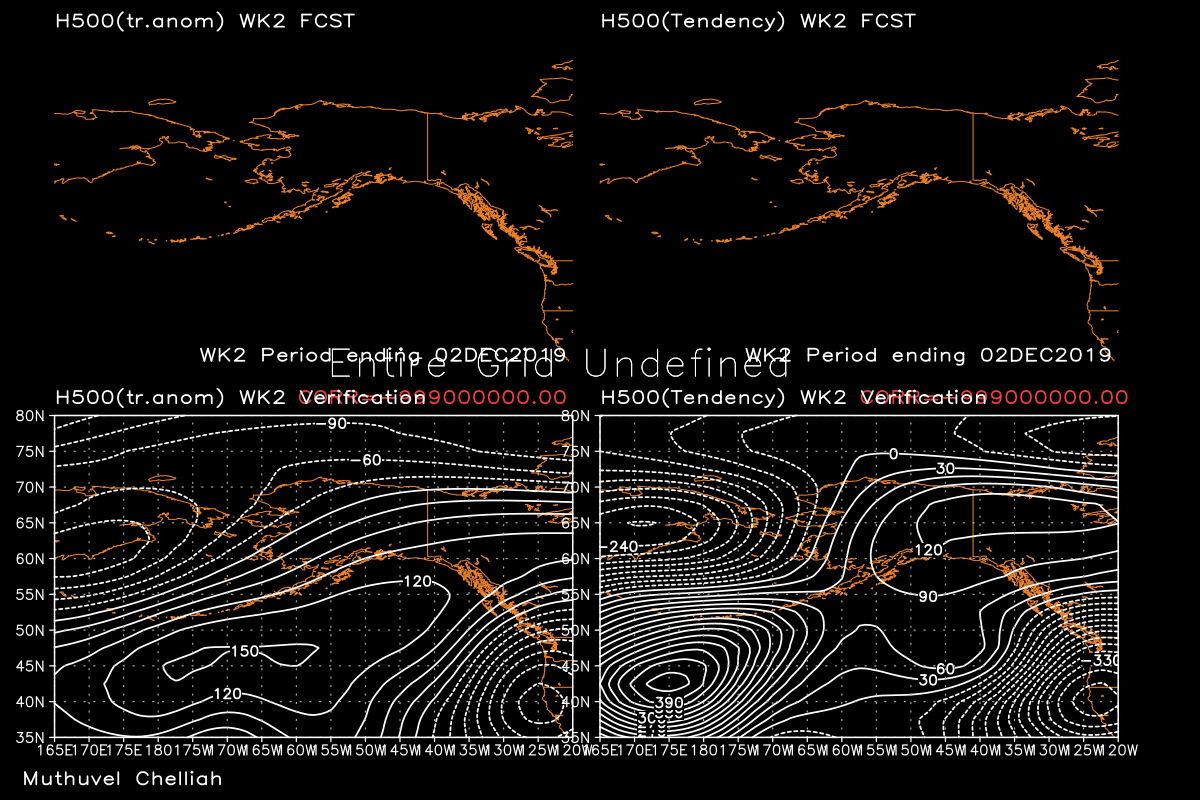
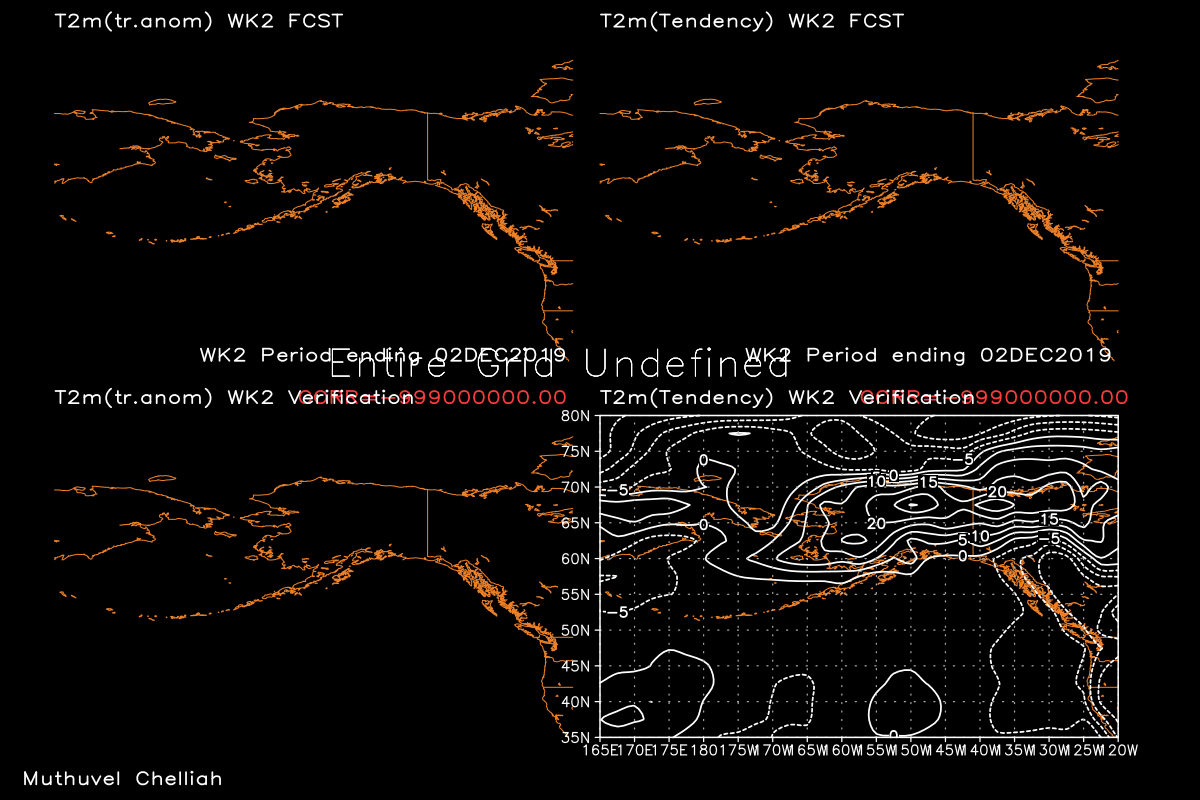
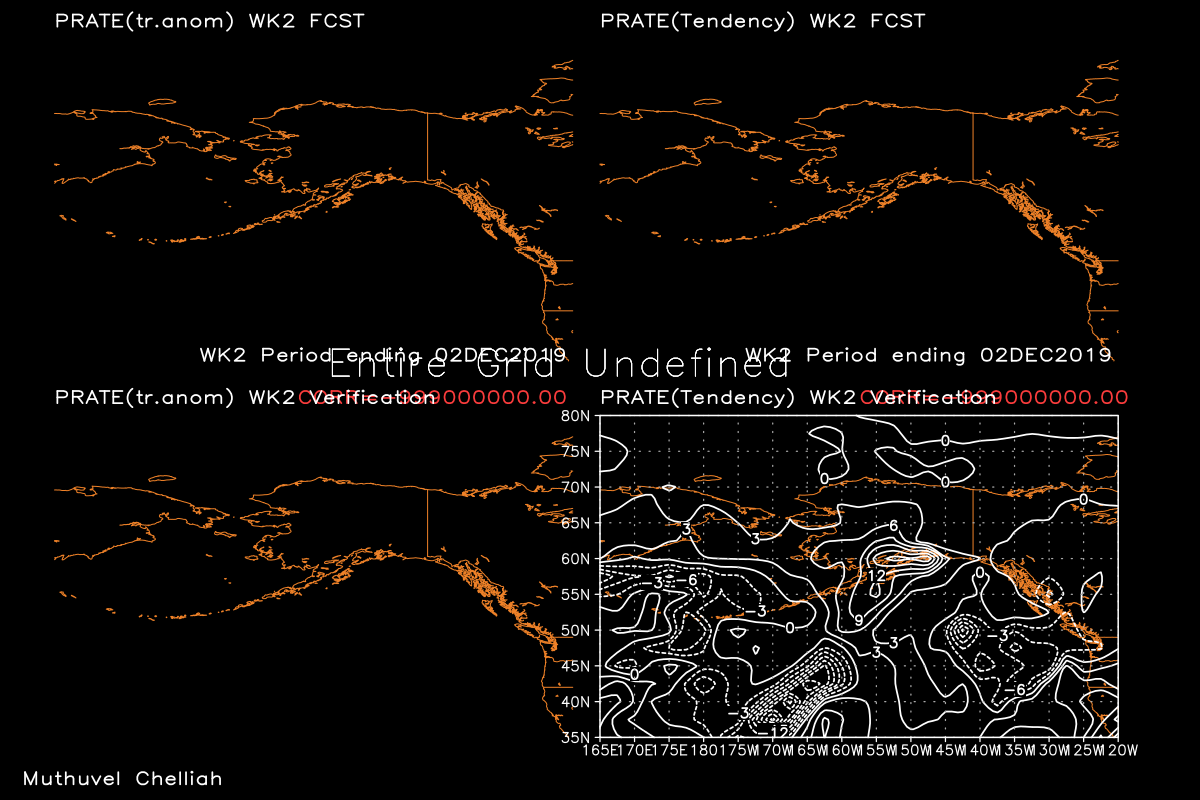
Verification: How the various Weekly TENDENCY forecasts that ENDED YESTERDAY actually verified over the US.
The following past forecasts were made as departures from these:
H500
T2m
Prate
(Also shown are Traditional Anomaly forecast and verification maps on left panels)
Verification: Time Series of Weekly Tendency Correlation and Traditional Anomaly Correlation for the past 60 days.
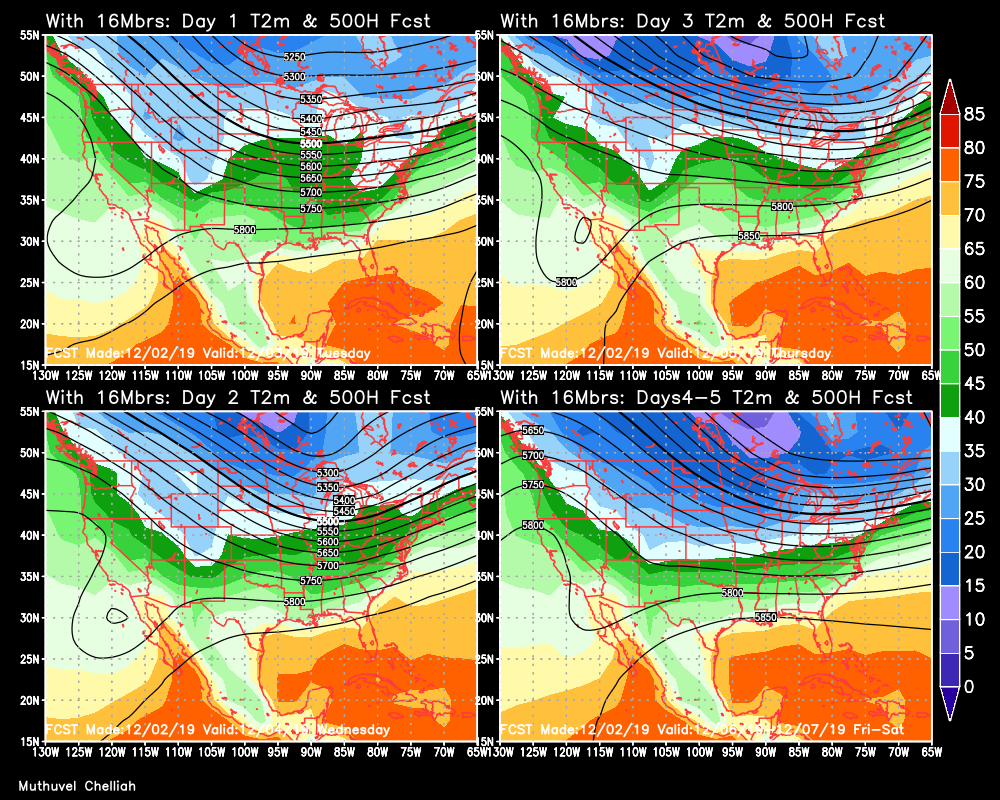
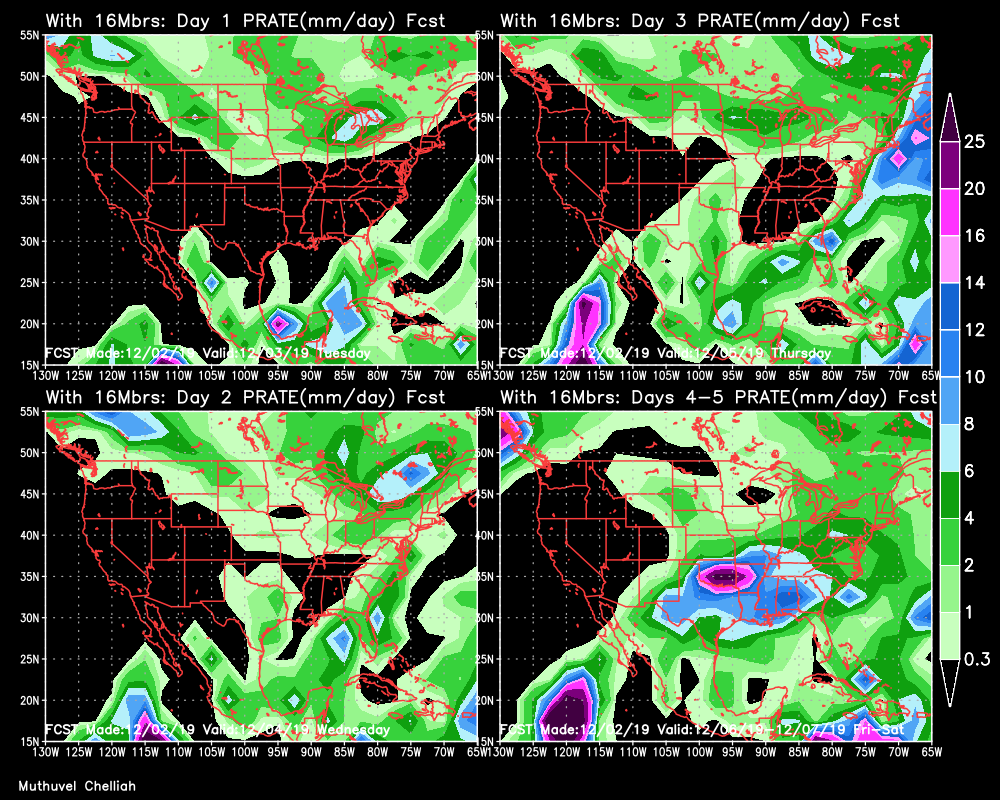
The maps below in this subsection are to also just display the
next few day's fcsts as tendencies over the US region following the same format as the weekly forecasts
displayed above. By just looking at the colors, You can get an idea if it is going to get colder/warmer or
wet/dry in your location.
Next few days' Forecasts are also shown as CHANGES/Differences from
THIS yesterday mean condition - updated daily
Next Few days'Forecasts as Total fields
-------------------------------------------------------------------------------------------------------------------
Weekly Tendency FORECASTS over ALASKA and vicinity
Future Weekly Forecasts as CHANGES/Differences from
THIS yesterday mean condition - updated daily
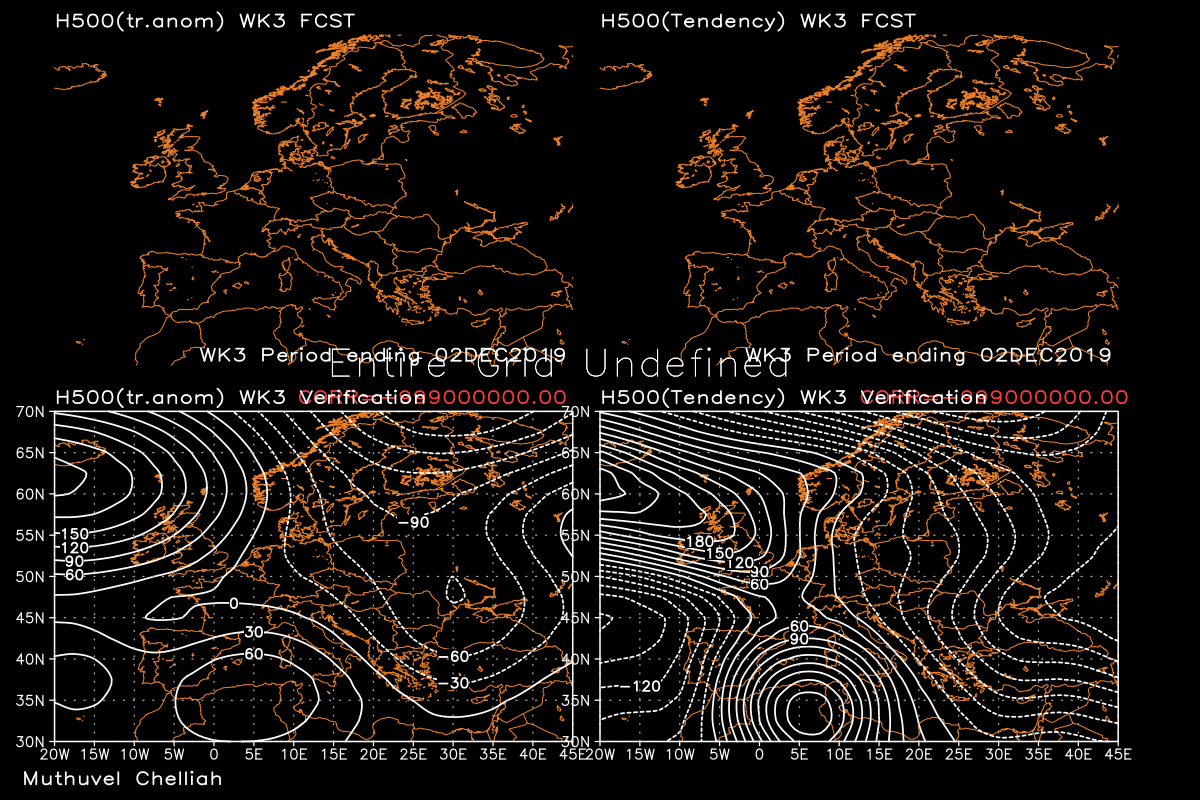
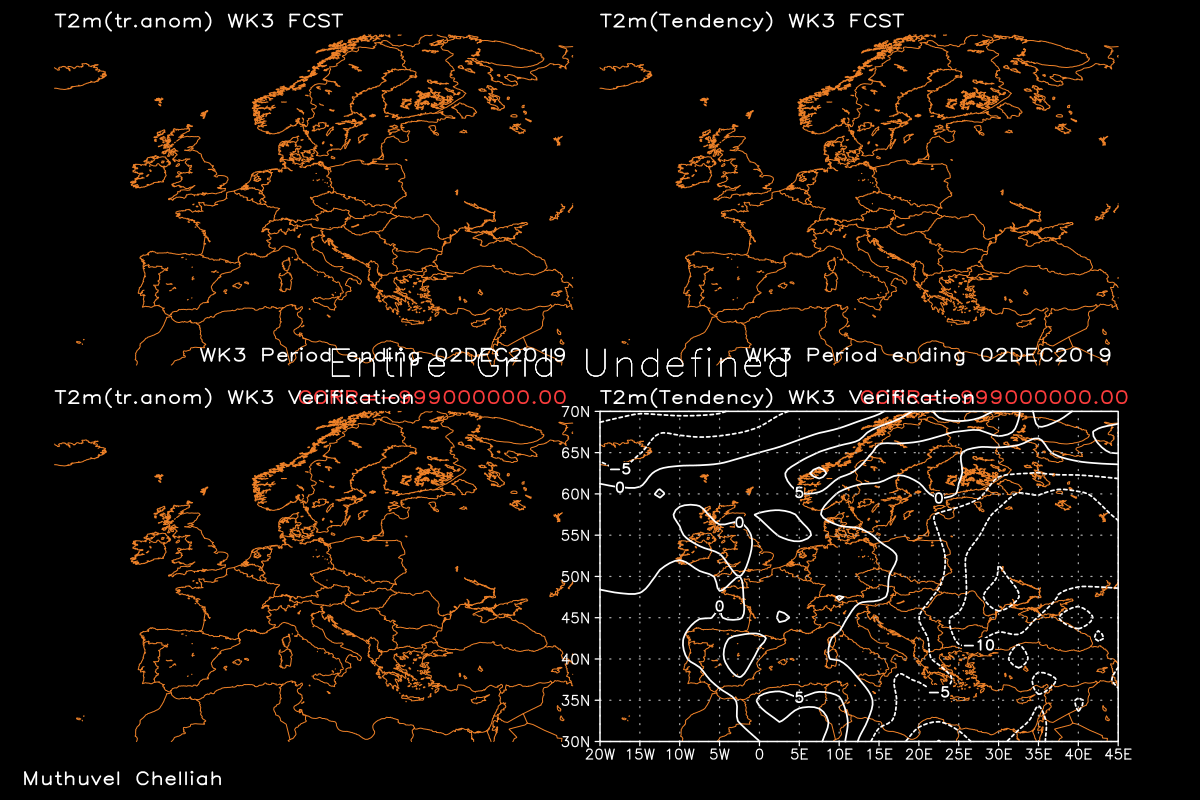
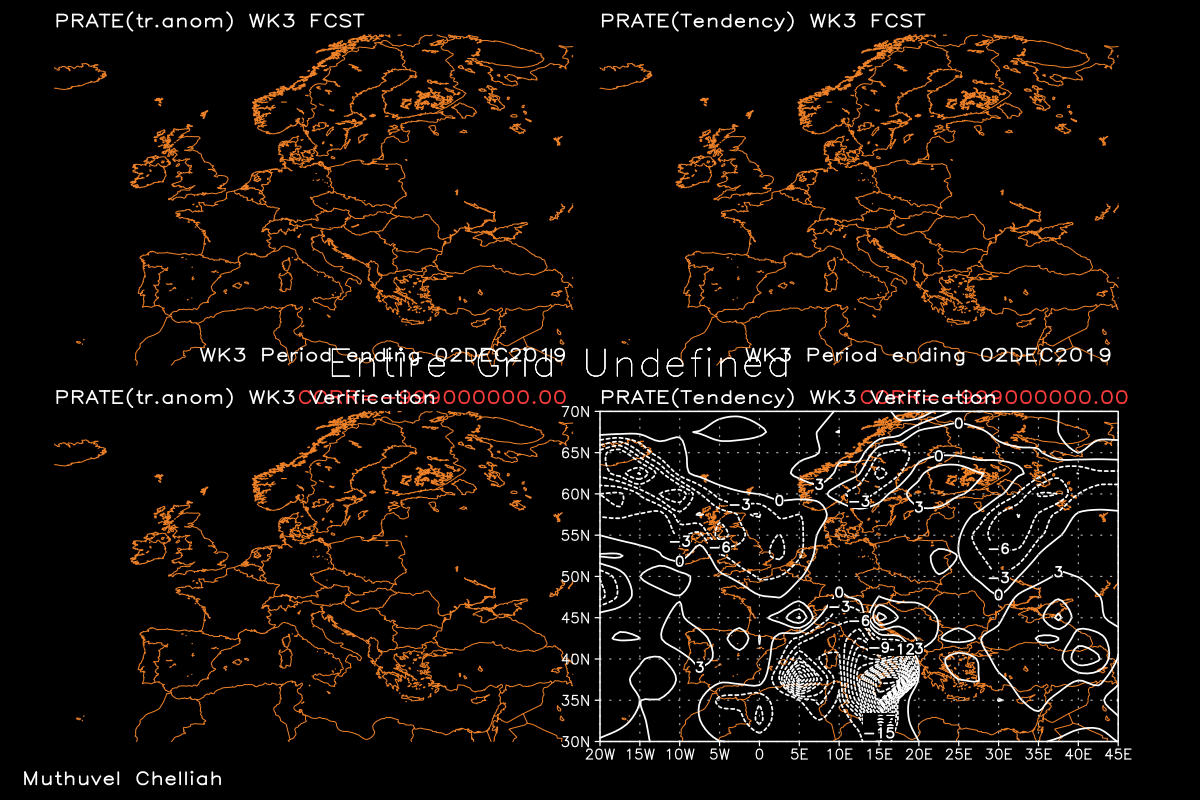
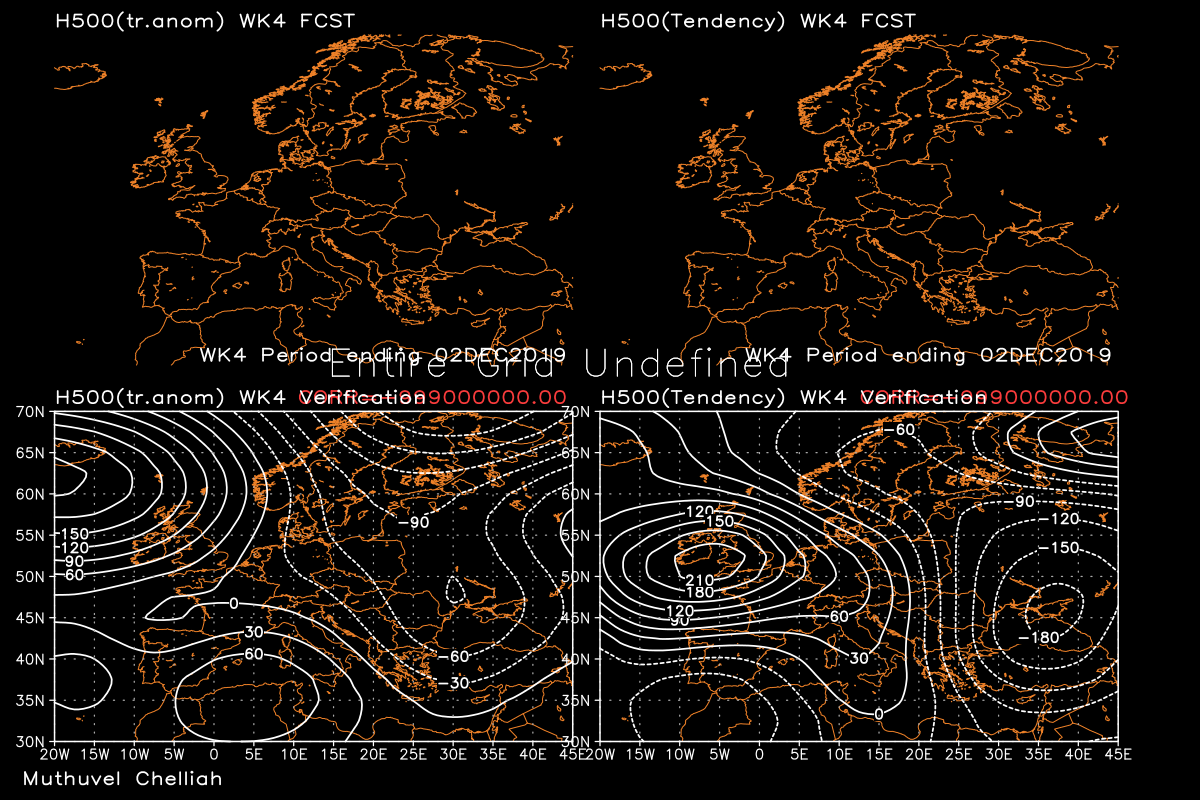
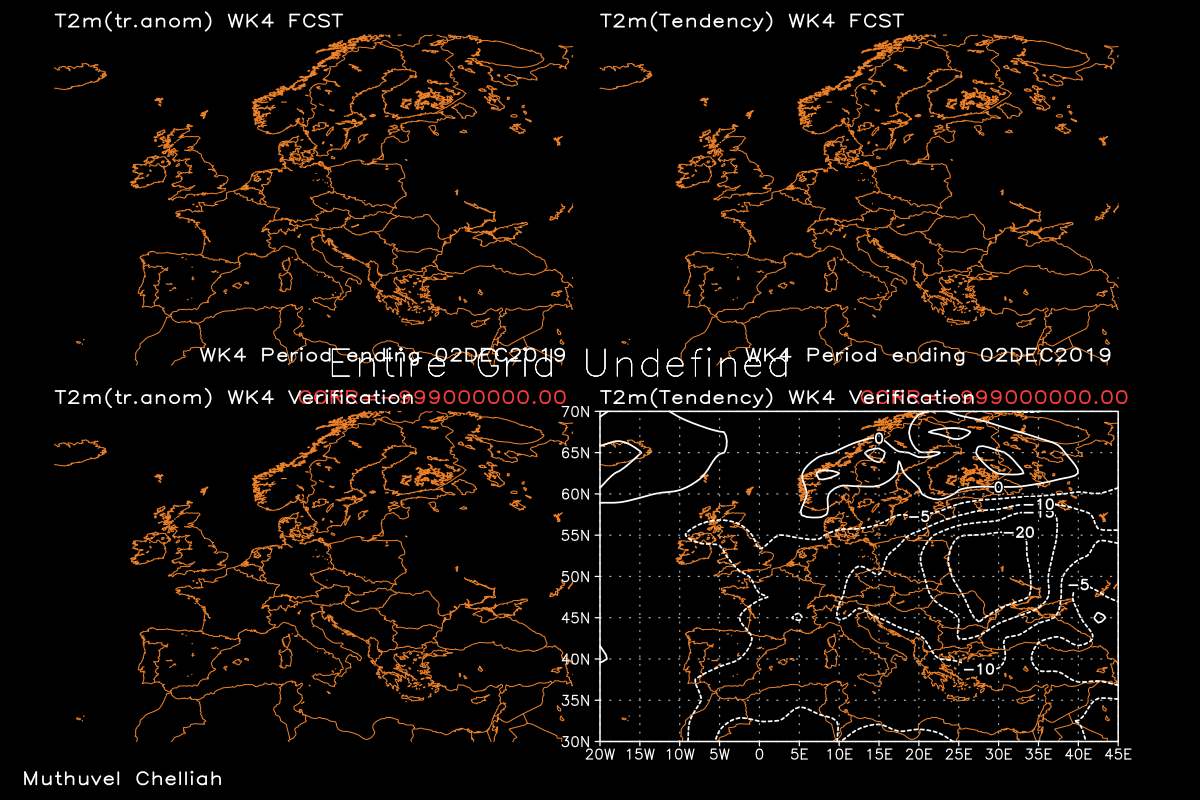
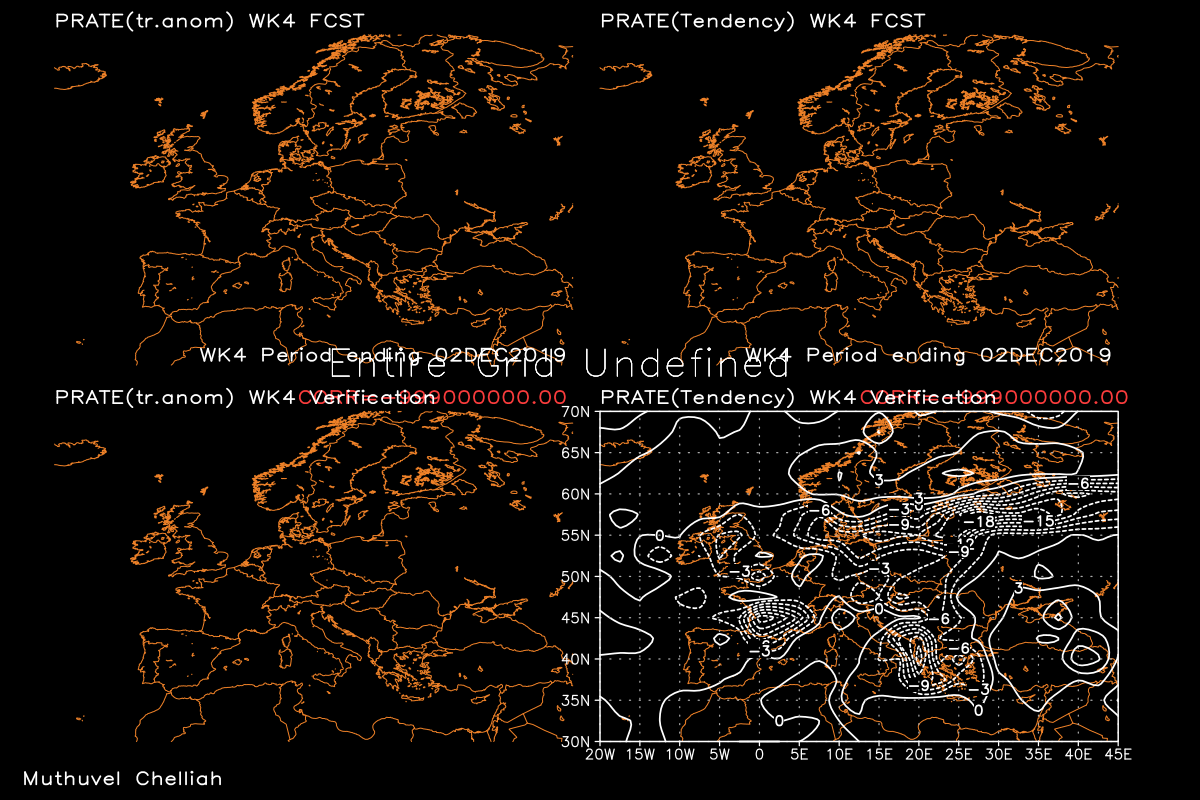
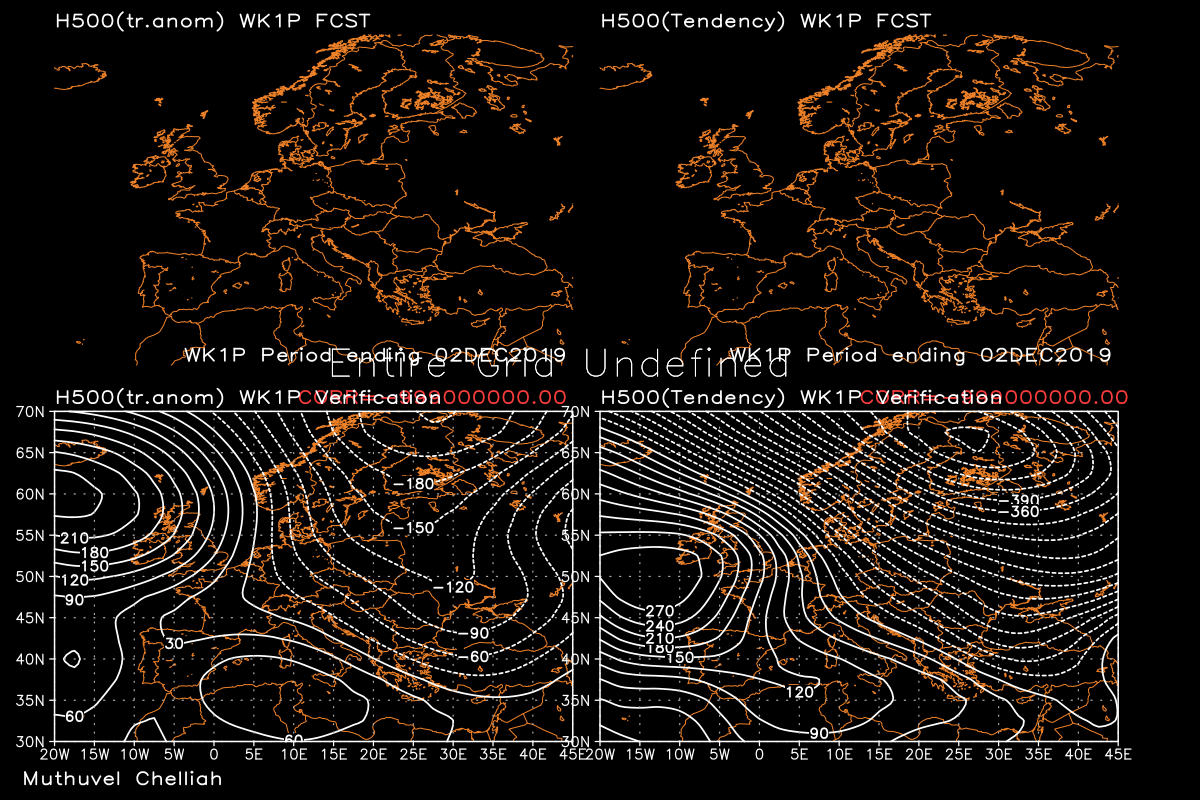
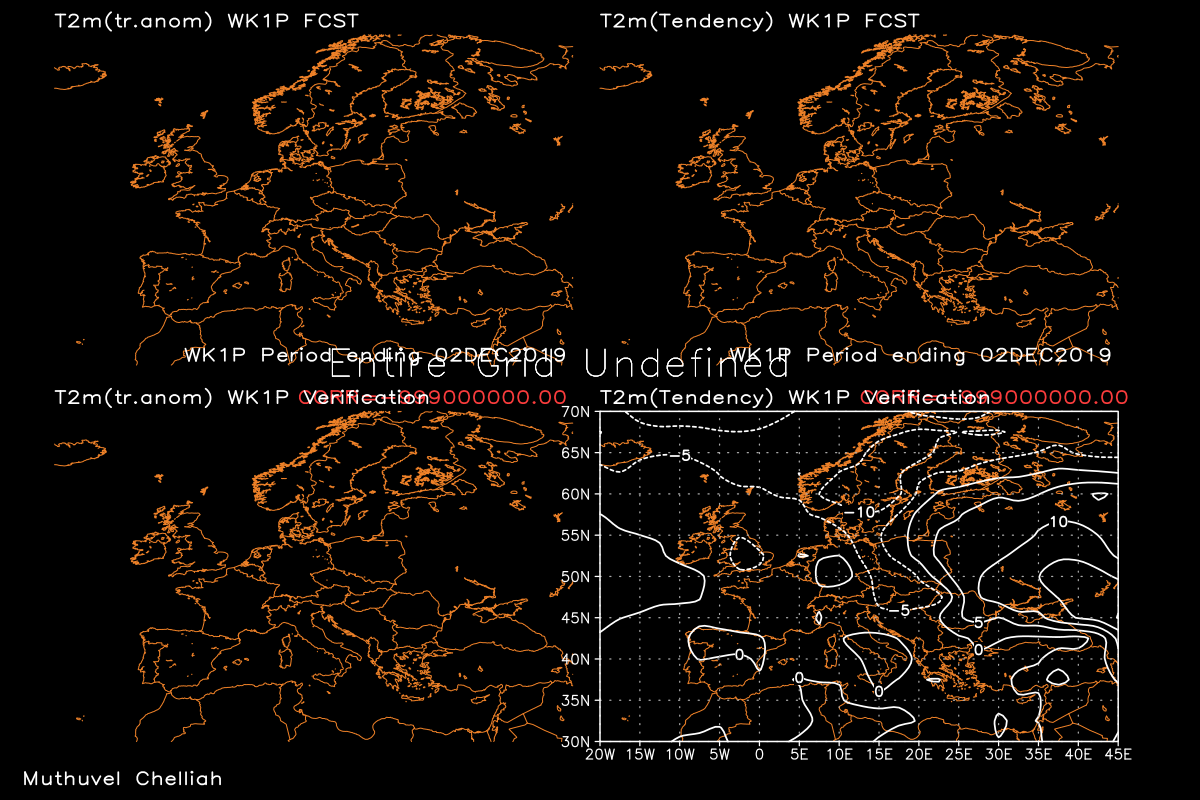
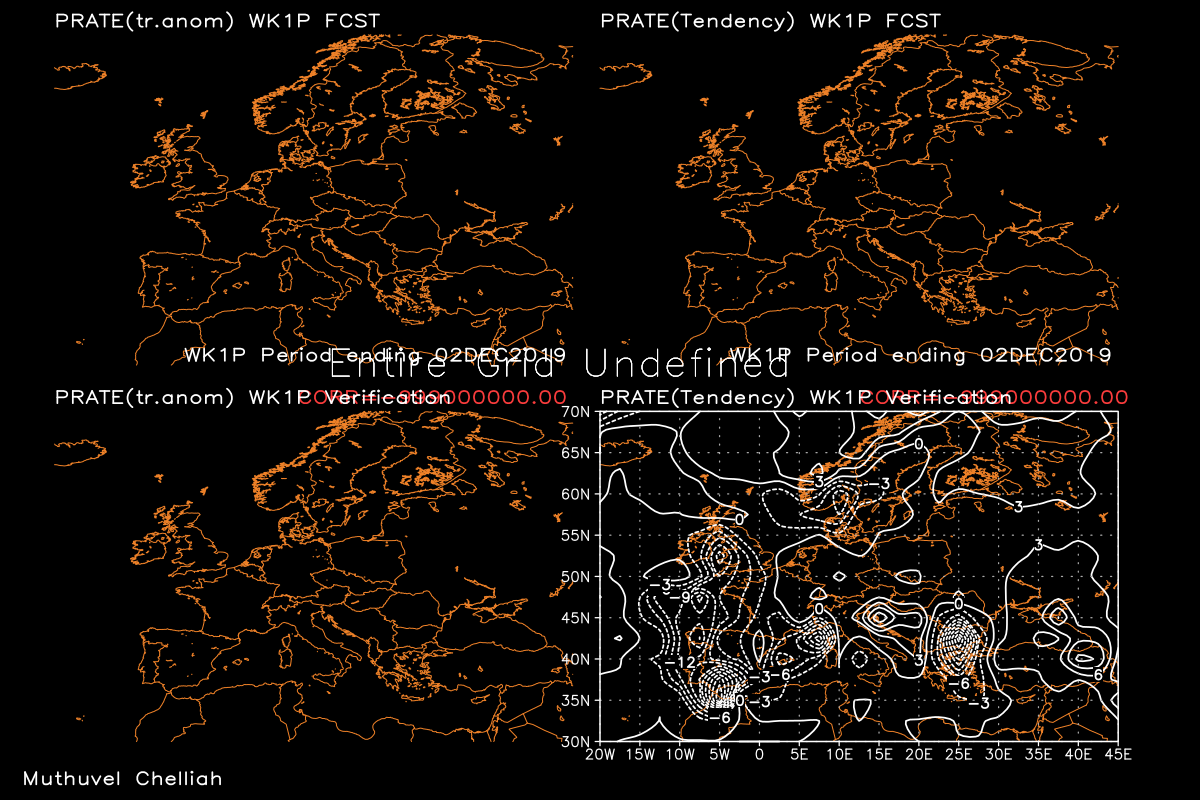
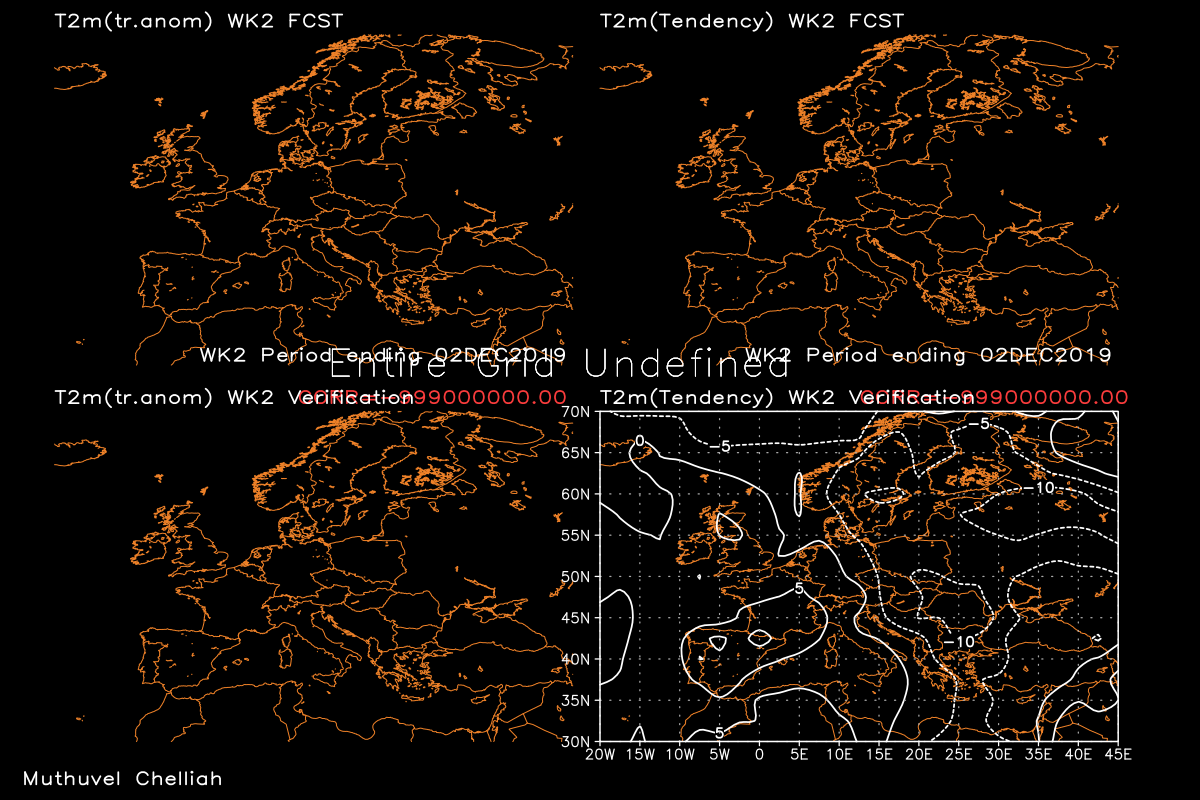
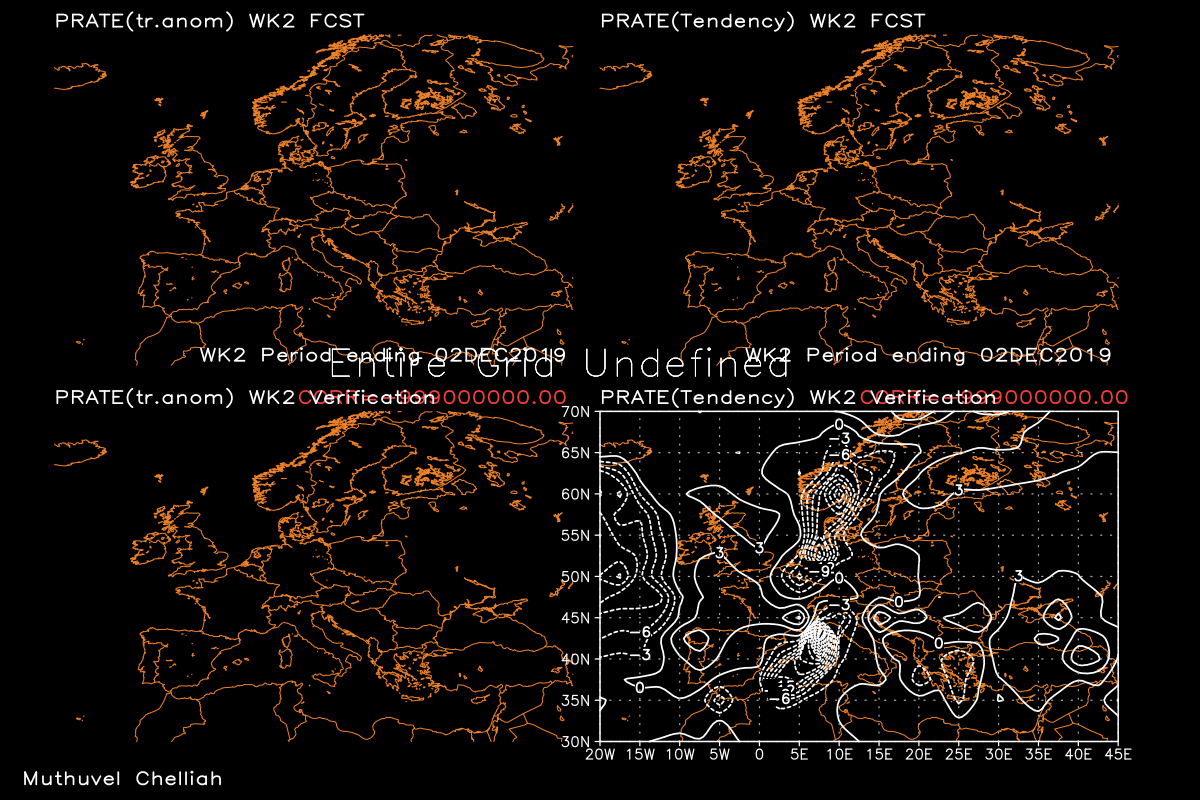
Verification: How the various Weekly TENDENCY forecasts that ENDED YESTERDAY actually verified over Europe
The following past fcsts were made as departures from these:
H500
T2m
Prate
(Also shown are Traditional Anomaly forecast and verification maps on left panels)
-------------------------------------------------------------------------------------------------------------------
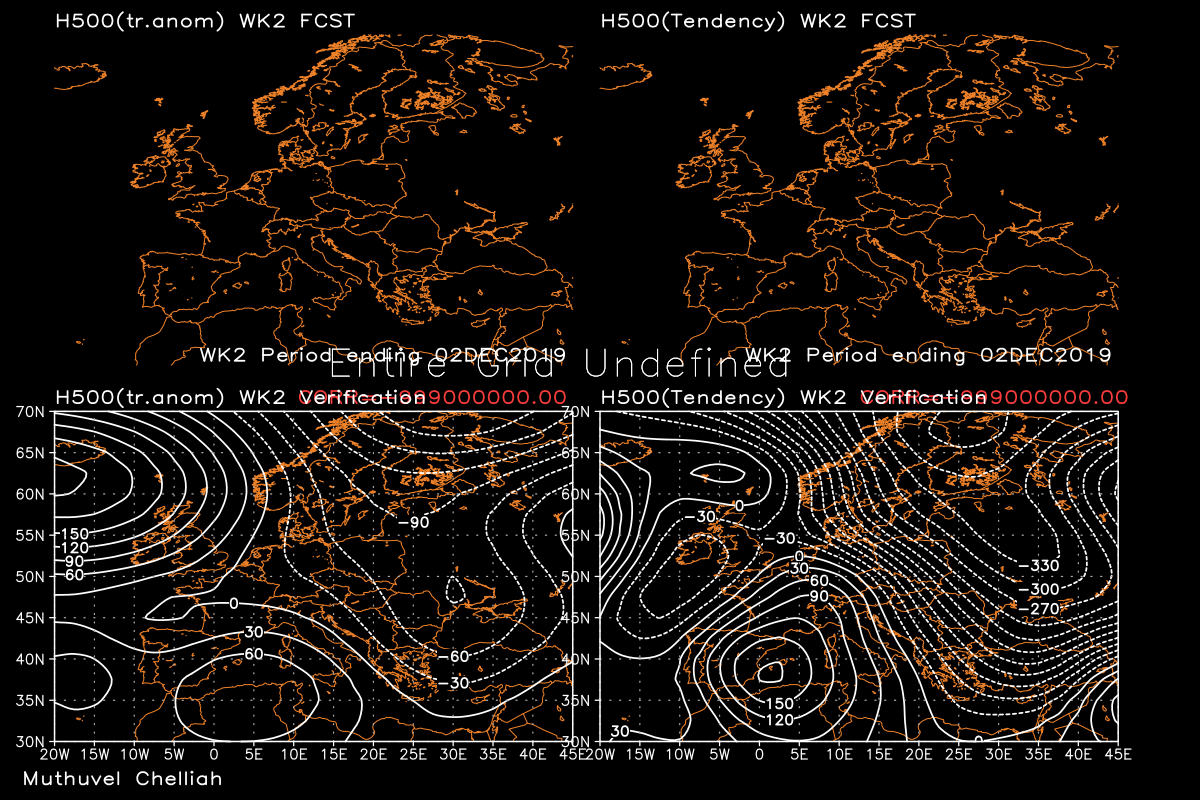
Weekly Tendency FORECASTS over EUROPE and vicinity
Future Weekly Forecasts as CHANGES/Differences from
THIS yesterday mean condition - updated daily
Verification: How the various Weekly TENDENCY forecast maps ending yesterday actually verified over Europe
The following past fcsts were made as departures from these:
H500
T2m
Prate
(Also shown are Traditional Anomaly forecast and verification maps on left panels)