[Previous Article] [Next Article]
Several empirical methods have been developed at the University of Wisconsin to forecast Dec-Jan-Feb rainfall
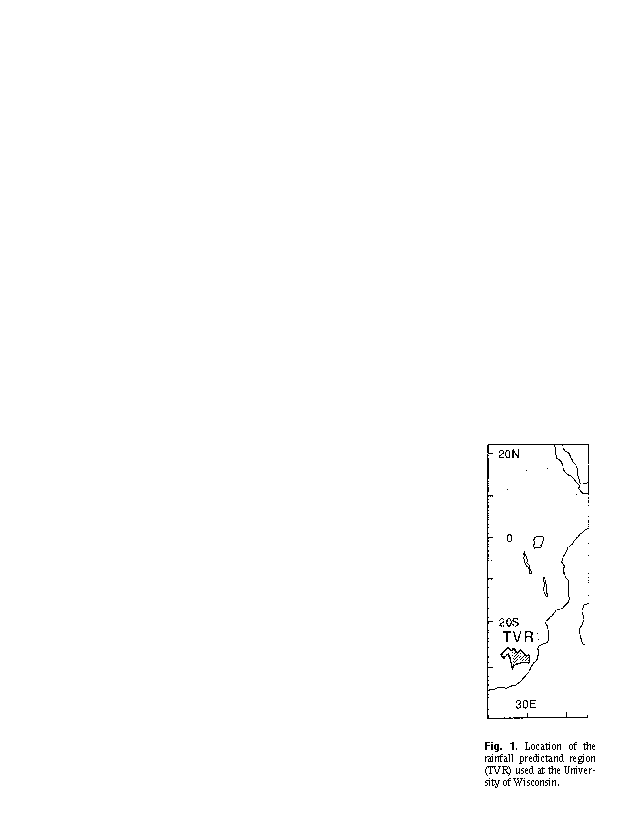
in the eastern part of South Africa (Hastenrath et al. 1995). The predicted area is an index of precipitation in the
Transvaal. The location of this Highveld region (called TVR) is shown in Fig. 1. This climatically sensitive region is
representative of a larger area. The predictors, based on empirical-diagnostic analyses, include (1) the Jul-Aug-Sep
values of Tahiti minus Darwin sea level pressure difference (a Southern Oscillation Index, or SOI), (2) the preceding
Jan-Feb-Mar 50 mb zonal wind (U50) over Singapore (an indication of the phase of the quasi-biennial oscillation
[QBO]), (3) an index of the Oct-Nov surface westerlies along the Indian Ocean Equator (called UEQ), and (4) an index
of November sea surface temperature (SST) in the Southwestern Indian Ocean (called UKT).
Forecast skill experiments using stepwise multiple regression, linear discriminant analysis, and neural networking
were carried out using the above predictors to predict TVR summer rainfall. The training period is 1954-78, and the
forecast test period 1979-90. Regression models using U50, UEQ and UKT as predictors account for more than 30
percent of the variance in the forecast test period. The linear discriminant analysis method does not perform well here.
The most skillful result was found using a neural networking model using U50 and SOI information through the end
of September, in which 62 percent of the 1979-90 TVR variance was explained. Using only the SOI and U50 as
predictors and using the slightly longer 1979-93 test period, 26% of the variance is explained for stepwise multiple
regression and 50% for neural networking. It was decided that these more economical models would be used. The
regression equation is
TVR = 19.3(SOI) -1.36(U50) + 264.
Note that TVR rainfall is positively correlated with SOI and negatively with U50. In other words, rainfall is enhanced
by cold ENSO conditions two seasons earlier and by an easterly QBO phase roughly one year earlier.
The 1996 values of the Jul-Aug-Sep SOI is 2.73 mb, compared with mean and standard deviation values of and
1.74 and 1.50 mb, respectively. This will tend to enhance rainfall. The U50 value for last Jan-Feb-Mar is 8.57 m/s,
compared with mean and standard deviation values of -1.49 and 13.01 m/s, respectively. This will suppress the rainfall
forecast. The resulting forecasts for TVR rainfall for Dec-Jan-Feb 1996-97 follow.
Predicted TVR
Forecast Method Rainfall Anomaly
Stepwise Multiple 0 mm ( .00 SD)
Regression
Neural Networking -6 mm (-.08 SD)
These forecasts for near-average TVR rainfall are expressed relative to a 1954-78 mean of 305 mm and a standard
deviation of 77 mm. The forecasts are comparable to what occurred in the summers of 1960-61, 1976-77, 1979-80, and
1987-88.
The performances of the last two previous predictions were quite good in 1994 but not in 1995: In 1994 the
forecasts were for -71 mm for regression and -.46 for neural net; the observation was -88 mm. In 1994 the forecasts were
for -4 mm for regression and -27 mm for neural net; the observation was +191 mm, the largest positive index on record
(starting in 1921).
Hastenrath, S., L. Greischar and J. van Heerden, 1995: Prediction of the summer rainfall over South Africa. J.
Climate, 8, 1511-1518.
Fig. 1. Location of the rainfall predictand region (TVR) used at the University of Wisconsin.