[Previous Article] [Next Article]
Forecasts of Tropical Pacific SST Using a Comprehensive Coupled
Ocean-Atmosphere Dynamical Model
contributed by Ming Ji1, Arun Kumar1 and Ants Leetmaa2
1Experimental Modeling Center, National Centers for Environmental Prediction, NOAA, Camp Springs, Maryland
2Climate Prediction Center, National Centers for Environmental Prediction, NOAA, Camp
Springs, Maryland
A non-simple coupled ocean-atmosphere model has been developed for use for long-lead climate
forecasts in the Coupled Model Branch of the Experimental Modeling Center (EMC) at NOAA's
National Centers for Environmental Prediction (NCEP) (Ji et al. 1994a,b). The NCEP Medium
Range Forecast (MRF) atmospheric model is used with a dynamic Pacific Basin ocean model
originated at the Geophysical Fluid Dynamics Laboratory. The MRF has a reduced spatial
resolution and is tuned for more realistic tropical circulation. The ocean thermal field, including
SST and subsurface temperature, is initialized using an ocean data assimilation system (Ji et al.
1995). It has been shown that when observed SST fields are prescribed, the coupled model's
atmospheric response is fairly reliable in the tropics but considerably less so in the extratropics, as
is the case with most AGCMs. The extratropical response is most realistic during the warm or
cold phase of ENSO as reflected in the SST. Much attention has in fact been given to the
prediction of ENSO itself--the tropical Pacific SST anomaly. Such an SST forecast is presented
here.
In the September and December 1993 issues of this Bulletin, the expected forecast skill of the
coupled model version used in 1993 (called CMP6) was shown. A horseshoe-shaped spatial
pattern of maximum model skill was noted, with highest equatorial skill near the date line and
higher skill just north or south of the equator than immediately along it to the east of 165oW. The
model generally outperformed persistence by a substantial margin in forecasting the Niño 3 and
Niño 4 regions. A seasonal dependence in skill was noted, where forecasts were affected by a
"spring barrier" as found in many other dynamical and statistical predictive models.
Starting with the forecasts presented in the September 1994 issue, the model was upgraded with a
refinement of the flux climatology and the installation of a MOS correction for the stress
anomalies produced by the atmospheric model. Skills consequently improved and the high skill
area extended farther eastward into the western part of the Niño 3 region (see Figures 2-1 and 2-2
of the September 1994 issue). The newer model version was named CMP9. In spring 1995,
another improvement was implemented, resulting in the CMP10 version (Ji et al. 1996). While
CMP9 contained a negative feedback procedure for coupling the anomalous net heat flux, CMP10
used anomaly coupling for the net heat flux forcing. While mean skill differences between CMP9
and CMP10 were not as marked as between CMP6 and CMP9, CMP10 behaved more
realistically for high amplitude SST anomalies. CMP9, with its negative feedback mechanism,
sometimes damped strong ENSO events too much and/or too soon.
The most recent improvement of the NCEP coupled model was completed during summer 1996,
and is used in the current forecasts. The resulting model version (CMP12) has the highest hindcast
skills in the model's history over the central and eastern equatorial Pacific for 1981-95, exceeding
0.8 correlation skill in much of that area for 4-6 month lead hindcasts. Upgrades in CMP12
include improvements in the data assimilation system, and model improvements such as better
mixing in the ocean model and more representative anomalous evaporation-precipitation (e-p)
flux forcing in the coupling. CMP12 forecasts out to 6 months lead are now updated on a weekly
basis and are available on Internet site http://nic.fb4.noaa.gov:8000 /research/climate.htmll.
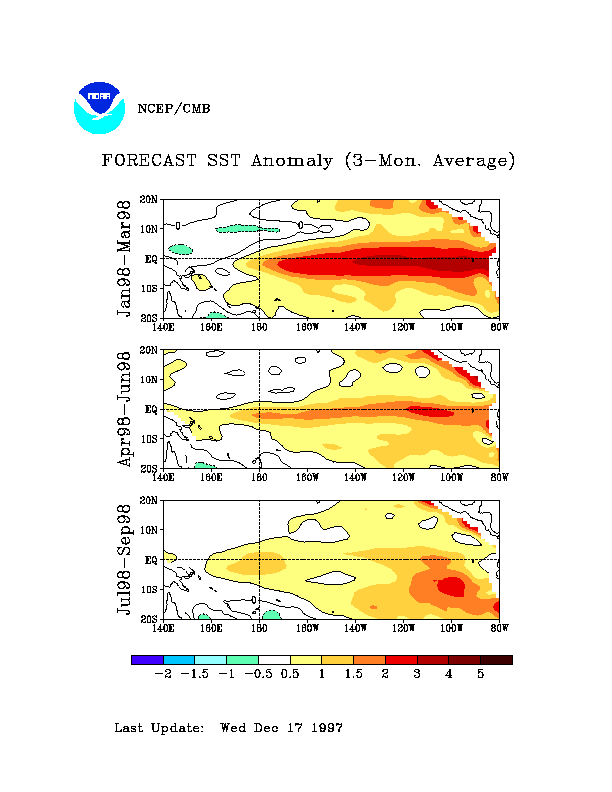
The CMP12 coupled model forecasts for the SST anomaly field averaged over Dec-Jan-Feb
1997-98, Mar-Apr-May and Jun-Jul-Aug 1998 are shown in Fig. 1, where the systematic model
bias for hindcasts over the 1981-95 period has been subtracted. This forecast is actually the mean
of an ensemble of 7 to 11 individual cases, each based on a different one- to two-week-apart
initial ocean condition ranging from early October through early December, 1997. The forecast
shows a continuation of the current extreme warmth through the boreal winter 1997-98, followed
by dissipation during 1998. Even though the dissipation is by no means slow in terms of degrees
per month, the present conditions are so warm that even by summer 1998 mild to moderate
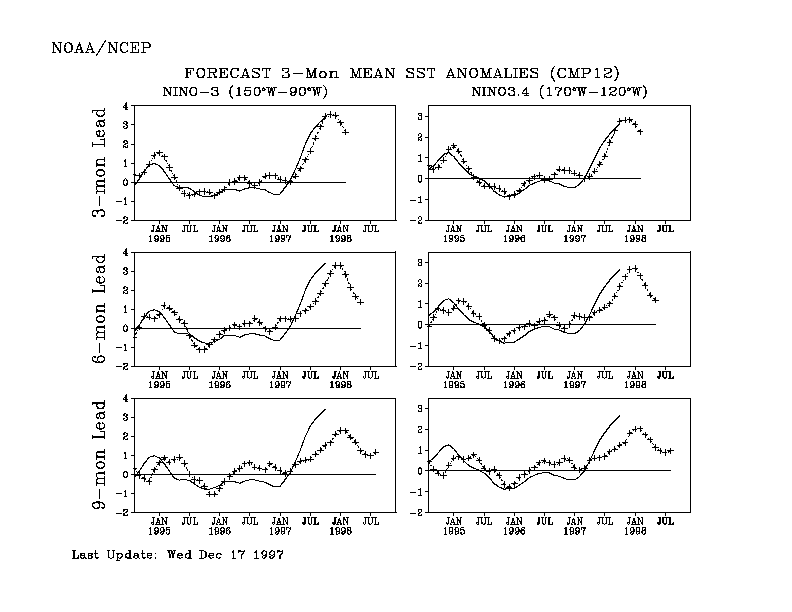
warmth is still present. Figure 2 shows the Niño 3 and Niño 3.4 forecasts in the form of time
series for the three lead times used to form the 3-month forecast averages used in Fig. 1. In this
format the same scenario is also apparent, and the month-to-month time resolution hints at a
slowing down of the dissipation by summer and thus some persistence of the residual warmth into
latter part of 1998.
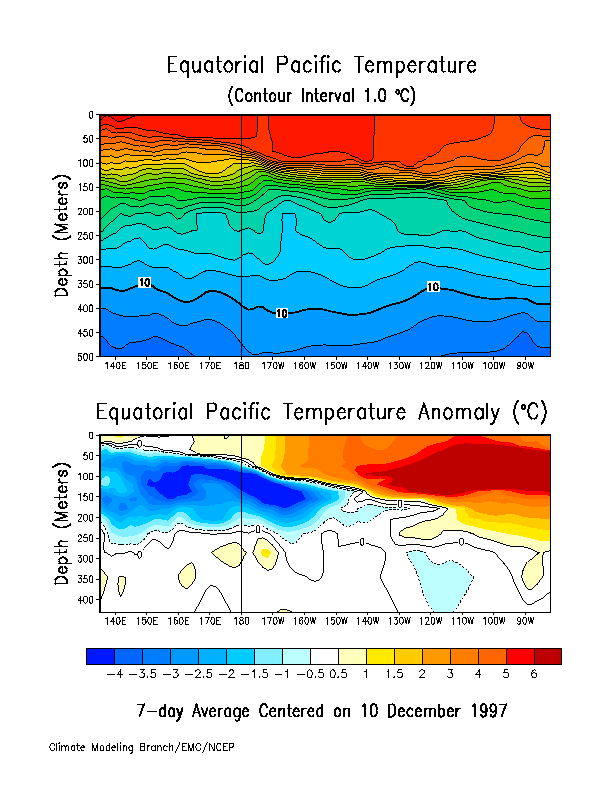
The observed anomalous SST and subsurface equatorial temperature field for the week centered
on November == (Fig. 3) is dominated by strong positive sea temperature anomalies from the
surface to about 150 m depth in the eastern tropical Pacific Basin. Positive subsurface anomalies
of up to 10C exist in the 120-130W at 125-150 m depth (not shown specifically in Fig. 3).
Negative anomalies have been nosing in from the western Pacific and now extend as far east as
140W at 150-200 m depth, underlying the positive anomalies. Compared with 3 months ago, the
positive anomalies in the eastern and central parts of the basin have strengthened, and the
negatives to the west have also strengthened and moved farther east. This cold water may presage
forthcoming conditions in the central and eastern tropical Pacific in fall 1998, based on an
empirically documented 1 to 1.5 year lag between the anomaly in the subsurface western Pacific
and the future SST farther east (Smith et al. 1995). Indeed, many (but not all) of the current
forecasts of next fall's ENSO condition are calling for below normal SST.
Ji, M., A. Kumar and A. Leetmaa, 1994a: A multi-season climate forecast system at the National
Meteorological Center. Bull. Am. Meteor. Soc., 75, 569-577.
Ji, M., A. Kumar and A. Leetmaa, 1994b: An experimental coupled forecast system at the
National Meteorological Center: Some early results. Tellus, 46A, 398-418.
Ji, M., A. Leetmaa and J. Derber, 1995: An ocean analysis system for seasonal to interannual
climate studies. Mon. Wea. Rev., 123, 460-481.
Ji, M., A. Leetmaa and V.E. Kousky, 1996: Coupled model forecasts of ENSO during the 1980s
and 1990s at the National Meteorological Center. J. Climate, 9, 3105-3120.
Smith, T.M., A. G. Barnston, M. Ji and M. Chelliah, 1995: The impact of Pacific Ocean
subsurface data on operational prediction of tropical Pacific SST at the NCEP. Wea. Forecasting,
10, 708-714.
Fig. 1. NCEP coupled model SST anomaly forecast fields for Sep-Oct-Nov 1997, Dec-Jan-Feb
1997-98, and Mar-Apr-May 1998. The CMP12 version of the model is used. Each forecast is an
average of about 13 individual ensemble members, each based on a different mean of an ensemble
of 7 to 11 individual cases, each based on a different one- to two-week-apart initial ocean
condition ranging from early July through early September 1997 (see text).
Fig. 2. NCEP coupled model SST anomaly forecast time series for Niño 3 and Niño 3.4 for Sep,
Oct, Nov 1997 (as 1-month means; top panels); Dec-Jan-Feb 1997-98 (middle panels); and
Mar-Apr-May 1998 (bottom panels). The broken line in each panel represents the SST anomaly
forecast (oC), and the solid line the observed SST anomaly. The predictions represent the mean of
three ensemble mean forecasts, each for one of the 3 most recent months, respectively, and each
produced by forecasts from two to three individual 1 to 2-week-apart initial conditions per month.
Fig. 3. Equatorial depth-longitude section of ocean temperature anomaly with respect to the
1983-92 mean for the week centered on September 3, 1997. Dashed contours denote negative
anomalies.