[Previous Article] [Next Article]
Precipitation Forecasts for the Tropical Pacific Islands
Using Canonical Correlation Analysis (CCA)
contributed by Yuxiang He and Anthony Barnston
Climate Prediction Center, NOAA, Camp Springs, Maryland
Canonical correlation analysis (CCA) identifies linear relationships between multicomponent
predictors and multicomponent predictands, e.g. pattern-to-pattern relationships in space and/or
time. Like simpler forms of linear regression, CCA minimizes squared errors in hindcasting the
predictands from the predictors. During the last decade, CCA has started being used increasingly
in the atmospheric sciences (e.g. Barnett and Preisendorfer 1987; Graham et al. 1987a, 1987b;
Barnston and Ropelewski 1992; Barnston 1994, Barnston and He 1996). Here, CCA is used to
predict 3-month precipitation anomalies in the Pacific Islands out to a year in advance, as
described in He and Barnston (1996). Because rainfall in the tropical and subtropical Pacific is
strongly related to ENSO (Ropelewski and Halpert 1987, 1996), it is reasonable to expect usable
skill in seasonal Pacific rainfall forecasts, and thus worthwhile to establish a real-time prediction
system for the benefit of commercial interests in the Pacific Islands. The experimental forecasts
shown in this quarterly Bulletin are provided a monthly basis on the Internet at address:
http://nic.fb4.noaa.gov:80 /products/predic-tions/experimental/pacific.
The predictor fields used for the forecasts include quasi-global sea surface temperature (SST),
Northern Hemisphere 700 mb geopotential height, and the predictand precipitation itself (33
island stations) at an earlier time. CCA sensitivity experiments indicate that the SST field is the
most valuable predictor field, with 700 mb heights and prior precipitation somewhat helpful.
Further details about the skills, the underlying relationships, and the predictors are provided in He
and Barnston (1996). The set of predictors is configured as four consecutive 3-month periods
prior to the time of the forecast, followed by a variable lead time, and then a single 3-month
predictand period. The predictand includes 3-month total rainfall at 33 Pacific Island stations
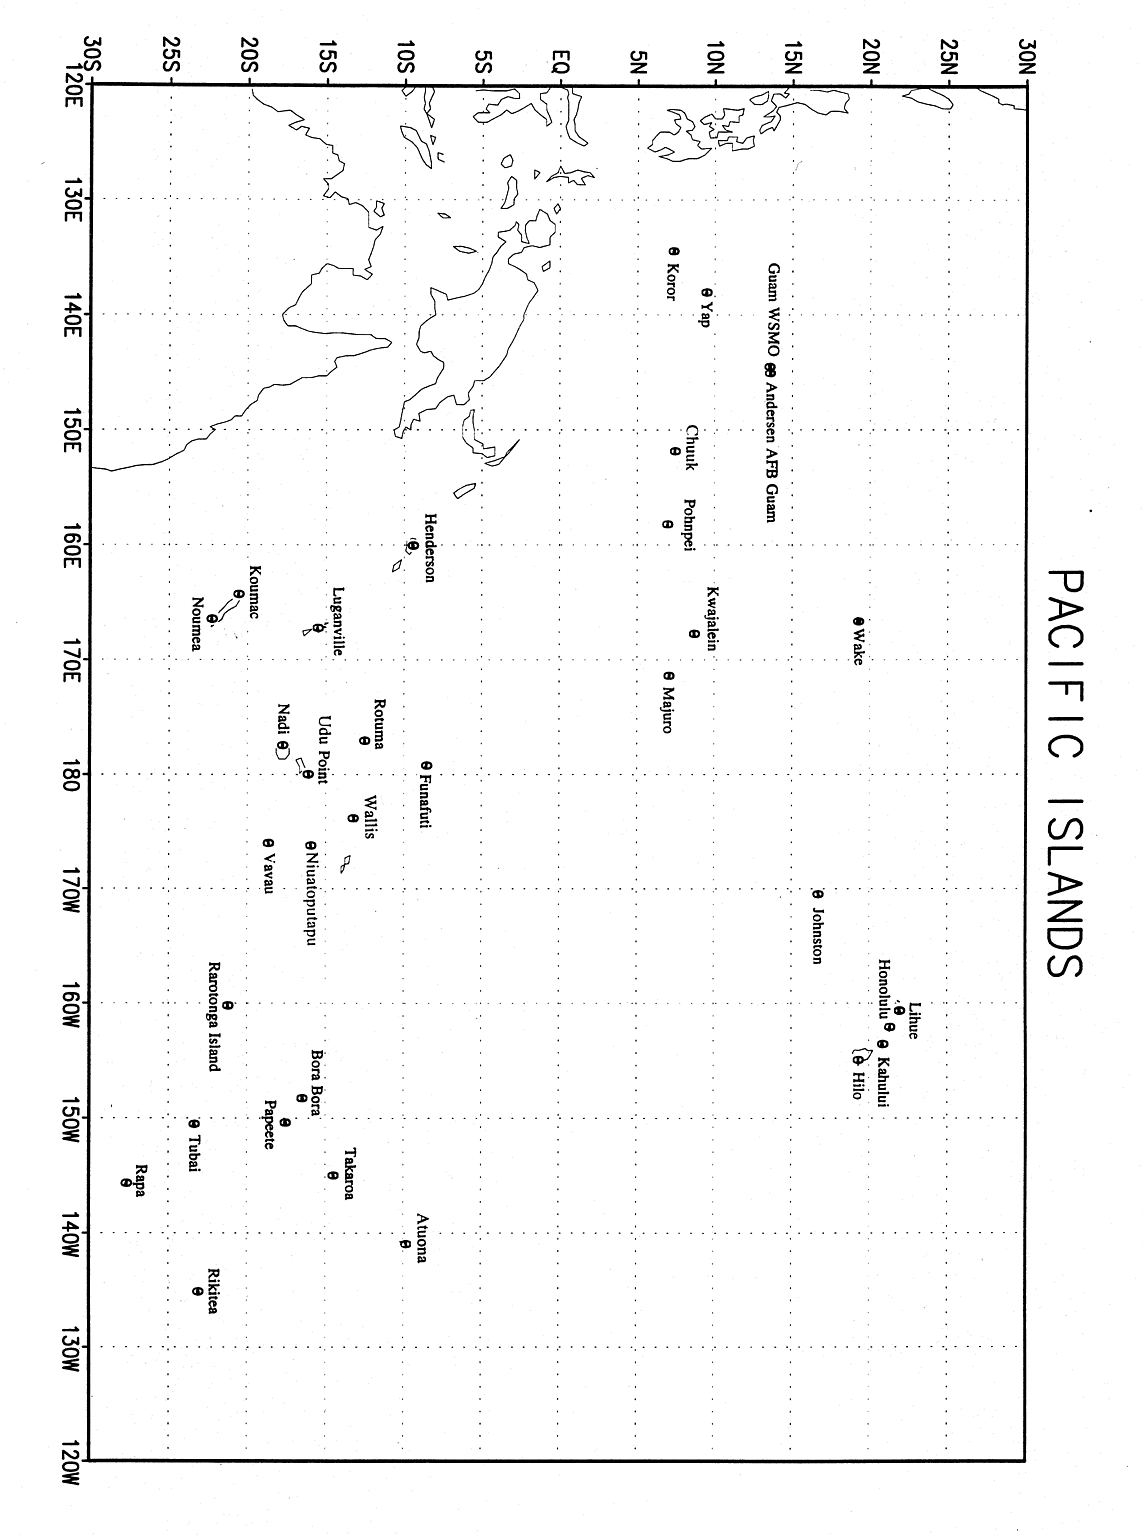
within 25oN-30oS, including 4 Hawaiian stations (Fig. 1). The lead time is defined as the time
between the end of the final (fourth) predictor period (i.e., the time of the forecast) and the
beginning of the 3-month predictand period. The set of stations predicted is expected to increase
by at least 50% sometime during 1998, and to include stations in near the equator near the date
line and eastward (i.e., in Kiribati).
The expected skill of the forecasts was estimated using a 1-year-out cross-validation (see He and
Barnston 1996). These skill estimates indicated that at 1 month lead time the highest correlation
skill across the Pacific Islands occurs in Jan-Feb-Mar at 0.44 (0.29) averaged over all stations
north (south) of the equator, and the lowest occurs from September through December at about
0.15 (0.30) for stations north (south) of the equator. At four months lead, skills are only slightly
lower except for the Jan-Feb-Mar average skill north of the equator which drops significantly to
0.26.
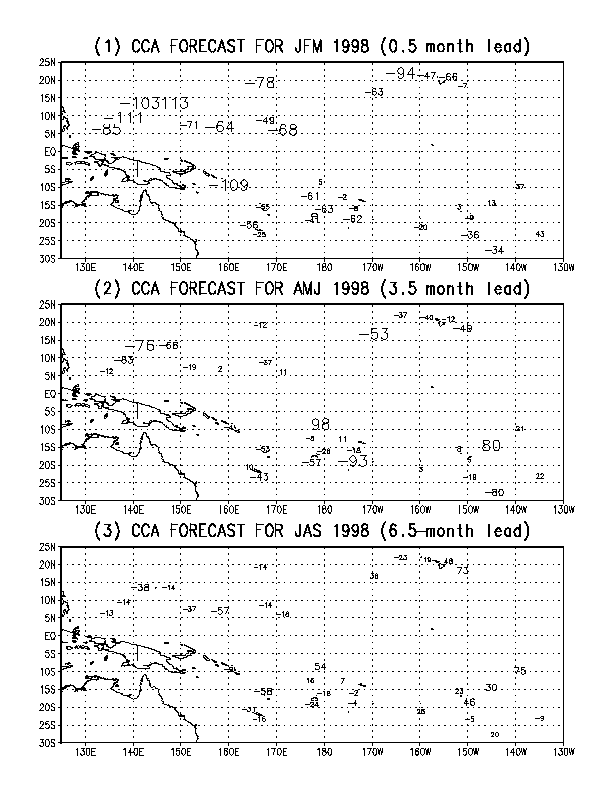
Figure 2 shows forecasts of the standardized precipitation anomaly (X100) for 33 Pacific Island
stations using data through August 1997. The top panel shows the forecast for Jan-Feb-Mar 1998
(1 month lead), the middle panel for Apr-May-Jun 1998 (4 months lead), and the bottom for
Jul-Aug-Sep (7 months lead). The expected skill for these forecasts, based on cross-validation, is
shown by the size of the numerals (as opposed to their value, which is the forecast itself): Small
numerals indicate low skill (correlation below 0.3), medium sized numerals usable but modest skill
(correlation between 0.3 and 0.45), and large numerals moderate or better skill (0.45 and higher).
Dryness at off-equator locations, and enhanced rainfall at the stations closest to the equator near
and east of the date line, is being forecast. This pattern, which is generally accompanied by higher
skill in Jan-Feb-Mar and somewhat in Apr-May-Jun, is associated with the very strong El Niño
conditions that developed during mid-1997, which the CCA implicitly expects to continue at high
strength through at least early boreal spring of 1998. Skill is mainly modest, but is moderately
high at some of the stations having strong ENSO influences. Skills would be higher if the
extremes of ENSO occurred more frequently. The presence of many neutral years enables rainfall
variations of random or unknown cause to lower the overall correlation skill. Given that much of
the existent skill comes from ENSO, our confidence in the qualitative pattern shown in Fig. 2
would be higher than that reflected in skills based on all years when we are confident that an
ENSO event will be occurring. This surely appears to be the cases for this boreal winter 1997-98.
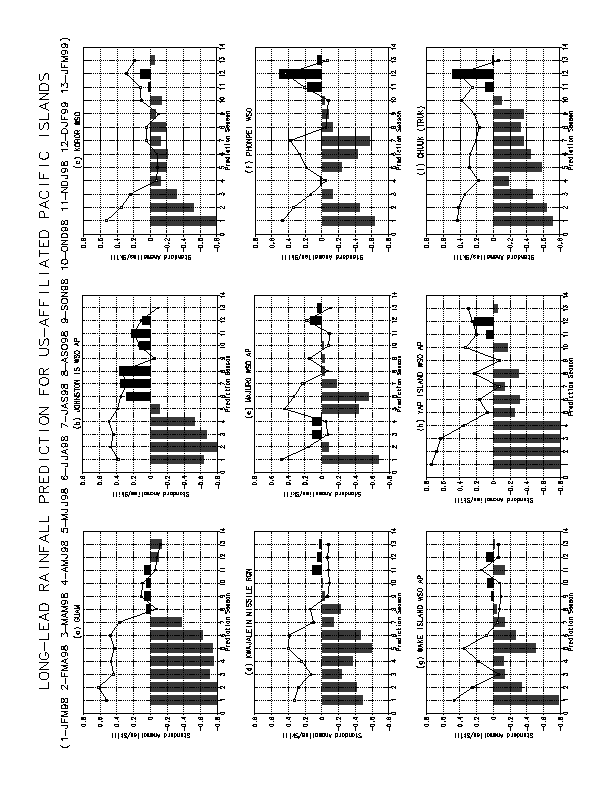
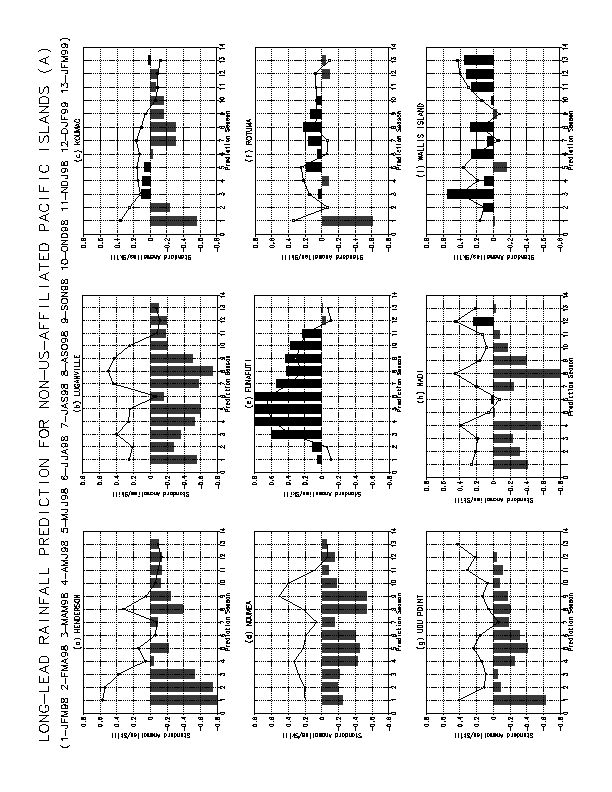
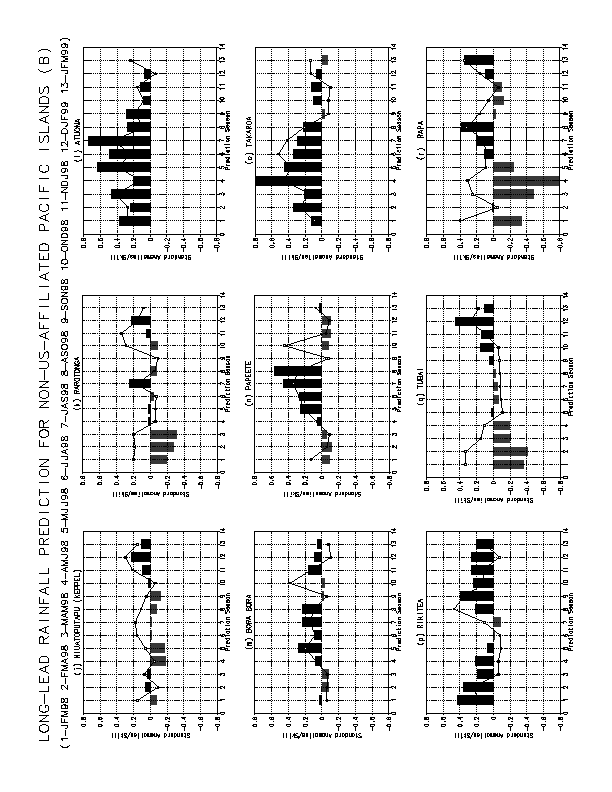
More detailed forecasts for 9 U.S.-affiliated and 18 non-U.S.-affiliated Pacific Island stations are
shown in Fig. 3, in the form of long-lead rainfall forecasts from 1 to 13 seasons lead (solid bars)
along with their expected skills (lines). The horizontal axis reflects the lead time, whose
corresponding actual target period for this forecast is indicated in the legend along the top of the
figure (e.g. 1=Jan-Feb-Mar 1998). The same ordinate scale is used for both forecasts and skills
(standardized anomaly and correlation, respectively). Sometimes skill may increase as the lead is
increased because a more forecastable target season has been reached. The forecasts and their
skills differ not only due to general location differences the Pacific basin, but also differences in
orientation with respect to the local orography (if any).
Dry conditions are forecast at many of the U.S. affiliated stations for boreal winter 1997-98
through spring 1998, due to the strong El Niño that is dominating the climate. Among the
stations shown here, dryness is especially marked at Johnston, Guam, Koror Yap, and Chuuk. At
some of these sites the forecast for dryness is "off the scale" (but is never stronger than -1.2
standard deviations). Skill tends to peak during winter or spring at these locations. South of the
equator at the non-U.S.-affiliated islands, dry conditions in early 1998 are also generally
expected for stations farthest away from the equator, except for those in the eastern Pacific.
In particular, dryness is expected in the regions of Henderson, Luganville, Udu Point, Koumac,
Noumea, Rotuma, Nadi, Tubai and Rapa. Most of these locations, and others that normally
experience drought with El Niño, have already been drier than normal for several months
and will very likely have to keep mitigation efforts in place for a few more months.
Above-normal rainfall is predicted at Funafuti, Wallis (only moderately), Atuona, Takaroa and
Rikitea (only moderately), where the rainfall excesses will be most noticeable with the onset of
their warm season from May to August. Places along the immediate equator from near the date
line eastward (e.g. Kiribati, which is not yet included in our forecasts) have already been
experiencing abnormally heavy rainfall.
The CCA modes (not shown; He and Barnston 1996) emphasize ENSO as the leading influence
on tropical Pacific climate, especially during the months of Nov-Dec-Jan-Feb-Mar-Apr-May (and
even earlier than Nov along the immediate equator near and somewhat east of the dateline). The
current rainfall forecasts strongly reflect warm ENSO rainfall impacts. The current strong ENSO
state is virtually assured of continuing at least until early March 1998, as it is physically impossible
for the SST anomalies to dissipate faster than a moderate rate. The forecasts produced by nearly
all of the dynamical and statistical models shown in this issue of the Bulletin indicate a very warm
condition for the first two to three months of 1998.
Barnett, T.P. and R. Preisendorfer, 1987: Origins and levels of monthly and seasonal forecast
skill for United States surface air temperatures determined by canonical correlation analysis. Mon.
Wea. Rev., 115, 1825-1850.
Barnston, A.G., 1994: Linear statistical short-term climate predictive skill in the Northern
Hemisphere. J. Climate, 7, 1513-1564.
Barnston, A.G. and C.F. Ropelewski, 1992: Prediction of ENSO episodes using canonical
correlation analysis. J. Climate, 5, 1316-1345.
Barnston, A.G. and Y. He, 1996: Skill of CCA forecasts of 3-month mean surface climate in
Hawaii and Alaska. J. Climate, 9, 2579-2605.
Graham, N.E., J. Michaelsen and T. Barnett, 1987a: An investigation of the El Niño-Southern
Oscil-lation cycle with statistical models. 1. Predictor field characteristics. J. Geophys. Res., 92,
14251- 14270.
Graham, N.E., J. Machaelsen and T. Barnett, 1987b: An investigation of the El Niño-Southern
Oscillation cycle with statistical models. 2. Model results. J. Geophys. Res., 92, 14271-14289.
He, Y. and A.G. Barnston, 1996: Long-lead forecasts of seasonal precipitation in the tropical
Pacific islands Using CCA. J. Climate, 9, 2020-2035.
Ropelewski, C.F. and M.S. Halpert, 1987: Global and regional scale precipitation patterns
associated with the El Niño/Southern Oscillation. Mon. Wea. Rev., 115, 1606-1626.
Ropelewski, C.F., and M.S. Halpert, 1996: Quantifying Southern Oscillation-precipitation
relationships. J. Climate, 9, 1043-1059.
Fig. 1. Locations of 14 U.S.-affiliated Pacific Island stations (including 4 in Hawaii) and 19
non-U.S.-affiliated stations (south of the equator), whose long-lead rainfall anomaly forecasts are
shown in Fig. 3, and most (27) of whose forecasts are shown in greater detail in Fig. 3.
Fig. 2. CCA-derived precipitation standardized anomaly forecast (X100) for 33 Pacific Islands
stations for (1) Jan-Feb-Mar, (2) Apr-May-Jun and (3) Jul-Aug-Sep, 1998. Latest data for these
forecasts is November 1997. The cross-validated skill expected for the forecasts is indicated by
the size of the numerals (not their value, which shows the forecast itself). Small numeral size
indicates correlation skill of less than 0.30, considered unusable; medium size is used for
0.30<skill<0.45 which is modest but usable; large size indicates skill>0.45, considered a relatively
more reliable forecast.
Fig. 3a, b, c. Time series of CCA-based long-lead precipitation anomaly forecasts, and their
expected skills, out to one year into the future for 9 U.S.-affiliated Pacific Island stations (this
page) and 18 non-U.S.-affiliated stations (next two pages). The bars indicate the forecast values
(as standardized anomalies) and the lines indicate the associated skills (as correlation coefficients).
Both forecasts and skills use the same ordinate scale. The target season is indicated on the
abscissa, ranging from 1 (Jan-Feb-Mar 1998) through 13 (Jan-Feb-Mar 1999); see the legend at
top.