[Previous Article]
[Next Article]
Linear Regression Forecast of
Central England Temperature for July-August
1996
contributed by Andrew Colman and Michael Davey
Hadley Centre for Climate Prediction and Research
UK Meteorological Office, Bracknell, United
Kingdom
The UK has had some notable exceptionally warm summers
in recent years prompting the question: Are seasonal summer temperatures
in this region predictable? At UKMO empirical techniques using global scale
patterns of historical sea surface temperature anomalies (SSTA) have been
used successfully to make experimental predictions of seasonal rainfall
in NE Brazil, tropical NW Africa and E Africa (Ward et al. 1993; see also
recent March and June issues of this LongŁLead Bulletin). The problem of
predicting UK climate is more difficult than that of predicting rainfall
in these tropical regions: however there is some evidence that UK climate
may be predictable from SST (e.g. Ratcliffe and Murray 1970, Palmer and
Sun 1985).
This year an experimental prediction of JulyŁAugust average
Central England Temperature (CET) has been made at UKMO using SSTA data.
CET is an homogenized temperature series from 1659 to now, first put together
by Manley (1974) and updated by Parker et al. (1992). From 1877 on, CET
is based on daily maximum and minimum temperatures at selected stations
in the region. July and August are usually the warmest months in the UK,
and persistence in CET between these months is high. Correlating July and
August monthly average CET for the period 1896Ł1995 gives a temporal anomaly
correlation r=0.53, whereas June and July give r=0.17, and August and September
give r=0.35 for the same period.
THE SST PREDICTOR
By correlating JulyŁAugust CET with monthly and biŁmonthly
10x10E latitudeŁlongitude area averages of SST, significant correlations
were found between JanuaryŁFebruary SST anomalies in the extratropical
north Atlantic and JulyŁAugust CET. An eigenvector analysis of North Atlantic
winter (JanuaryŁFebruary) SSTA was also carried out. The pattern (Fig.
1) which explained the most variability in the SSTA data over the period
1901Ł1990 is similar to the correlation pattern between SST and CET. The
time series of this eigenvector which indicates the strength and sign of
the eigenvector pattern was calculated for each winter (JanuaryŁFebruary
average SSTA), and used to develop a simple linear regression prediction
scheme for CET.
PREDICTION SKILL ESTIMATE
The temporal anomaly correlation between the predictor
time series and JulyŁAugust CET over the period 1871Ł1995 is 0.40, which
is significant (different from zero) at the 99.9% level. Over the shorter
period 1971Ł1995 the correlation is 0.51 (99% significant).
Fig. 2 shows the inflated regression predictions for 1971Ł1996,
made using independent data for 1871Ł1970 to train the prediction model.
(In inflated regression, a scaling factor is obtained in the training period
from the variance of the predictions and of the observed predictand. This
rescaling does not affect the correlation.)
This inflated regression prediction scheme was also assessed
over a longer period (1946Ł95) using a jackŁknife technique. The jackŁknife
technique involves forecasts being made for each year using a regression
equation obtained from a dataset that excludes the year being forecast.
The subsequent two years are also excluded, as these may be related to
the forecast year through persistence. Fig. 3 shows the jackŁknife forecasts
plotted against observed CET. The correlation of 0.47 is less than for
the 25Łyear period but is still significant at the 99.9% level. This level
of skill is promising, considering the 6Łmonth lead time, and compares
well with other long lead extratropical statistical prediction skills (e.g.
Barnston 1994).
FORECAST FOR 1996
The regression scheme gives a forecast for JulyŁAugust
1996 CET of 15.4EC (Fig. 2). The root mean square error (RMSE) for the
1971Ł1995 forecasts shown in Fig. 2 is 1.3EC, which provides an indication
of the reliability of the current forecast. The vertical bars attached
to the 1996 forecast in Fig. 2 show this RMSE range. The 1996 forecast
value is 0.6EC cooler than the 1951Ł80 average, and 3.5EC cooler than
the 1995 value.
Note: this forecast for 1996 is experimental, with
substantial uncertainty. The method should be regarded as developmental,
and the results should be used with caution.
References
Barnston, A.G., 1994: Linear statistical shortŁterm climate
predictive skill in the northern hemisphere. J. Climate, 7,
1513Ł1564.
Manley, G., 1974: Central England temperatures, monthly
means 1659 to 1973. Q. J. Roy. Met. Soc., 79, 242Ł261.
Palmer, T. and Z. Sun, 1985: A modeling and observational
study of the relationship between sea surface temperature in the north
west Atlantic and atmospheric general circulation. Q. J. Roy. Met. Soc.,
111, 947Ł975.
Parker, D.E., T.P. Legg and C.K. Folland, 1992: A new
daily Central England Temperature series, 1772Ł1991. Int. J. Climatol.,
12, 317Ł342.
Ratcliffe, R.A.S. and R. Murray, 1970: New lag associations
between north Atlantic sea temperatures and European pressure, applied
to longŁrange weather forecasting. Q. J .Roy. Met. Soc., 96,
226Ł246.
Ward, M.N., C.K. Folland, K. Maskell, A.W. Colman, D.P.
Rowell and K.P. Lane, 1993: Experimental seasonal forecasting of tropical
rainfall at the UK Meteorological Office. In: Prediction of interannual
climate variations, NATO ASI vol. 16, pp 197Ł216.
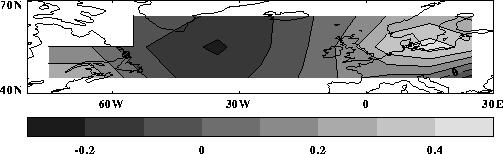
Fig. 1: The predictor SST leading eigenvector
pattern, based on 1901Ł1990 JanuaryŁFebruary sea surface temperature anomalies
in the North Atlantic. Positive values of this pattern are associated with
warmer Central England temperature (CET).
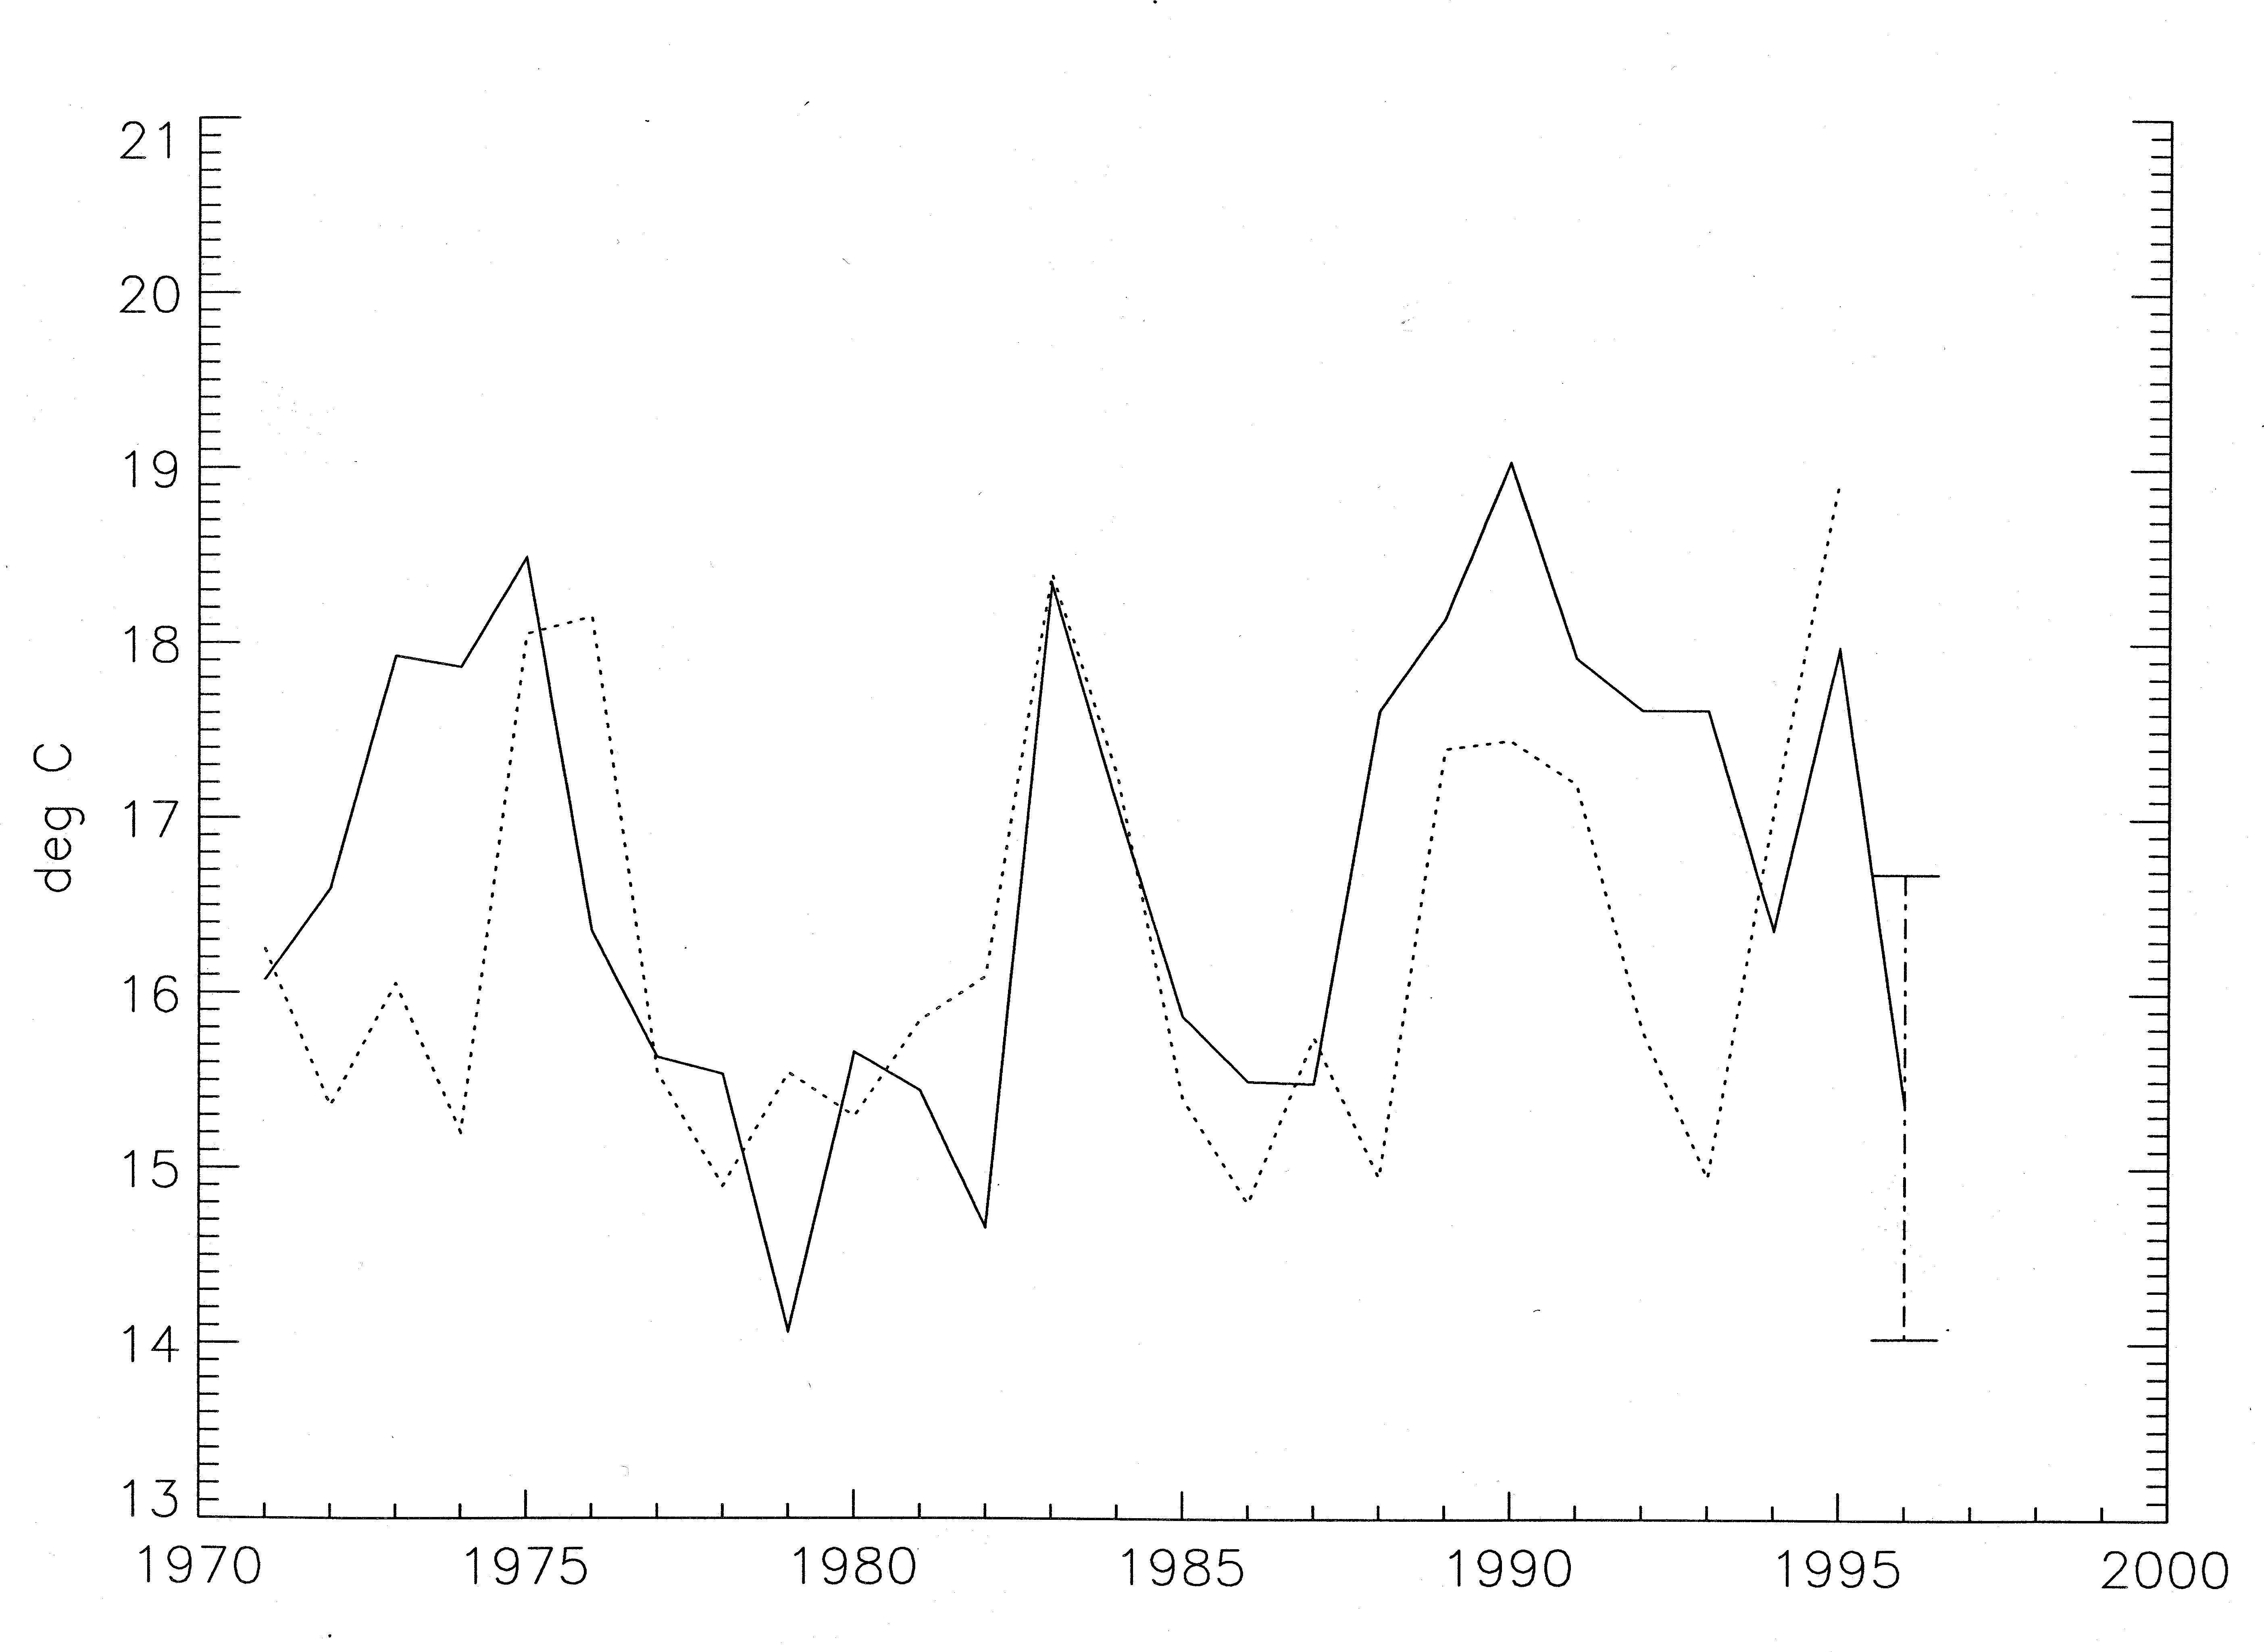
Fig. 2: JulyŁAugust Central England Temperature,
as observed (dashed) and as forecast (solid) using linear regression and
JanuaryŁFebruary North Atlantic sea surface temperature anomalies. The
temporal anomaly correlation (1971Ł95) is 0.51, rms error is 1.3EC. The
value shown for 1996 is this summer=s forecast; the vertical bars on the
1996 forecast indicate the RMSE range.
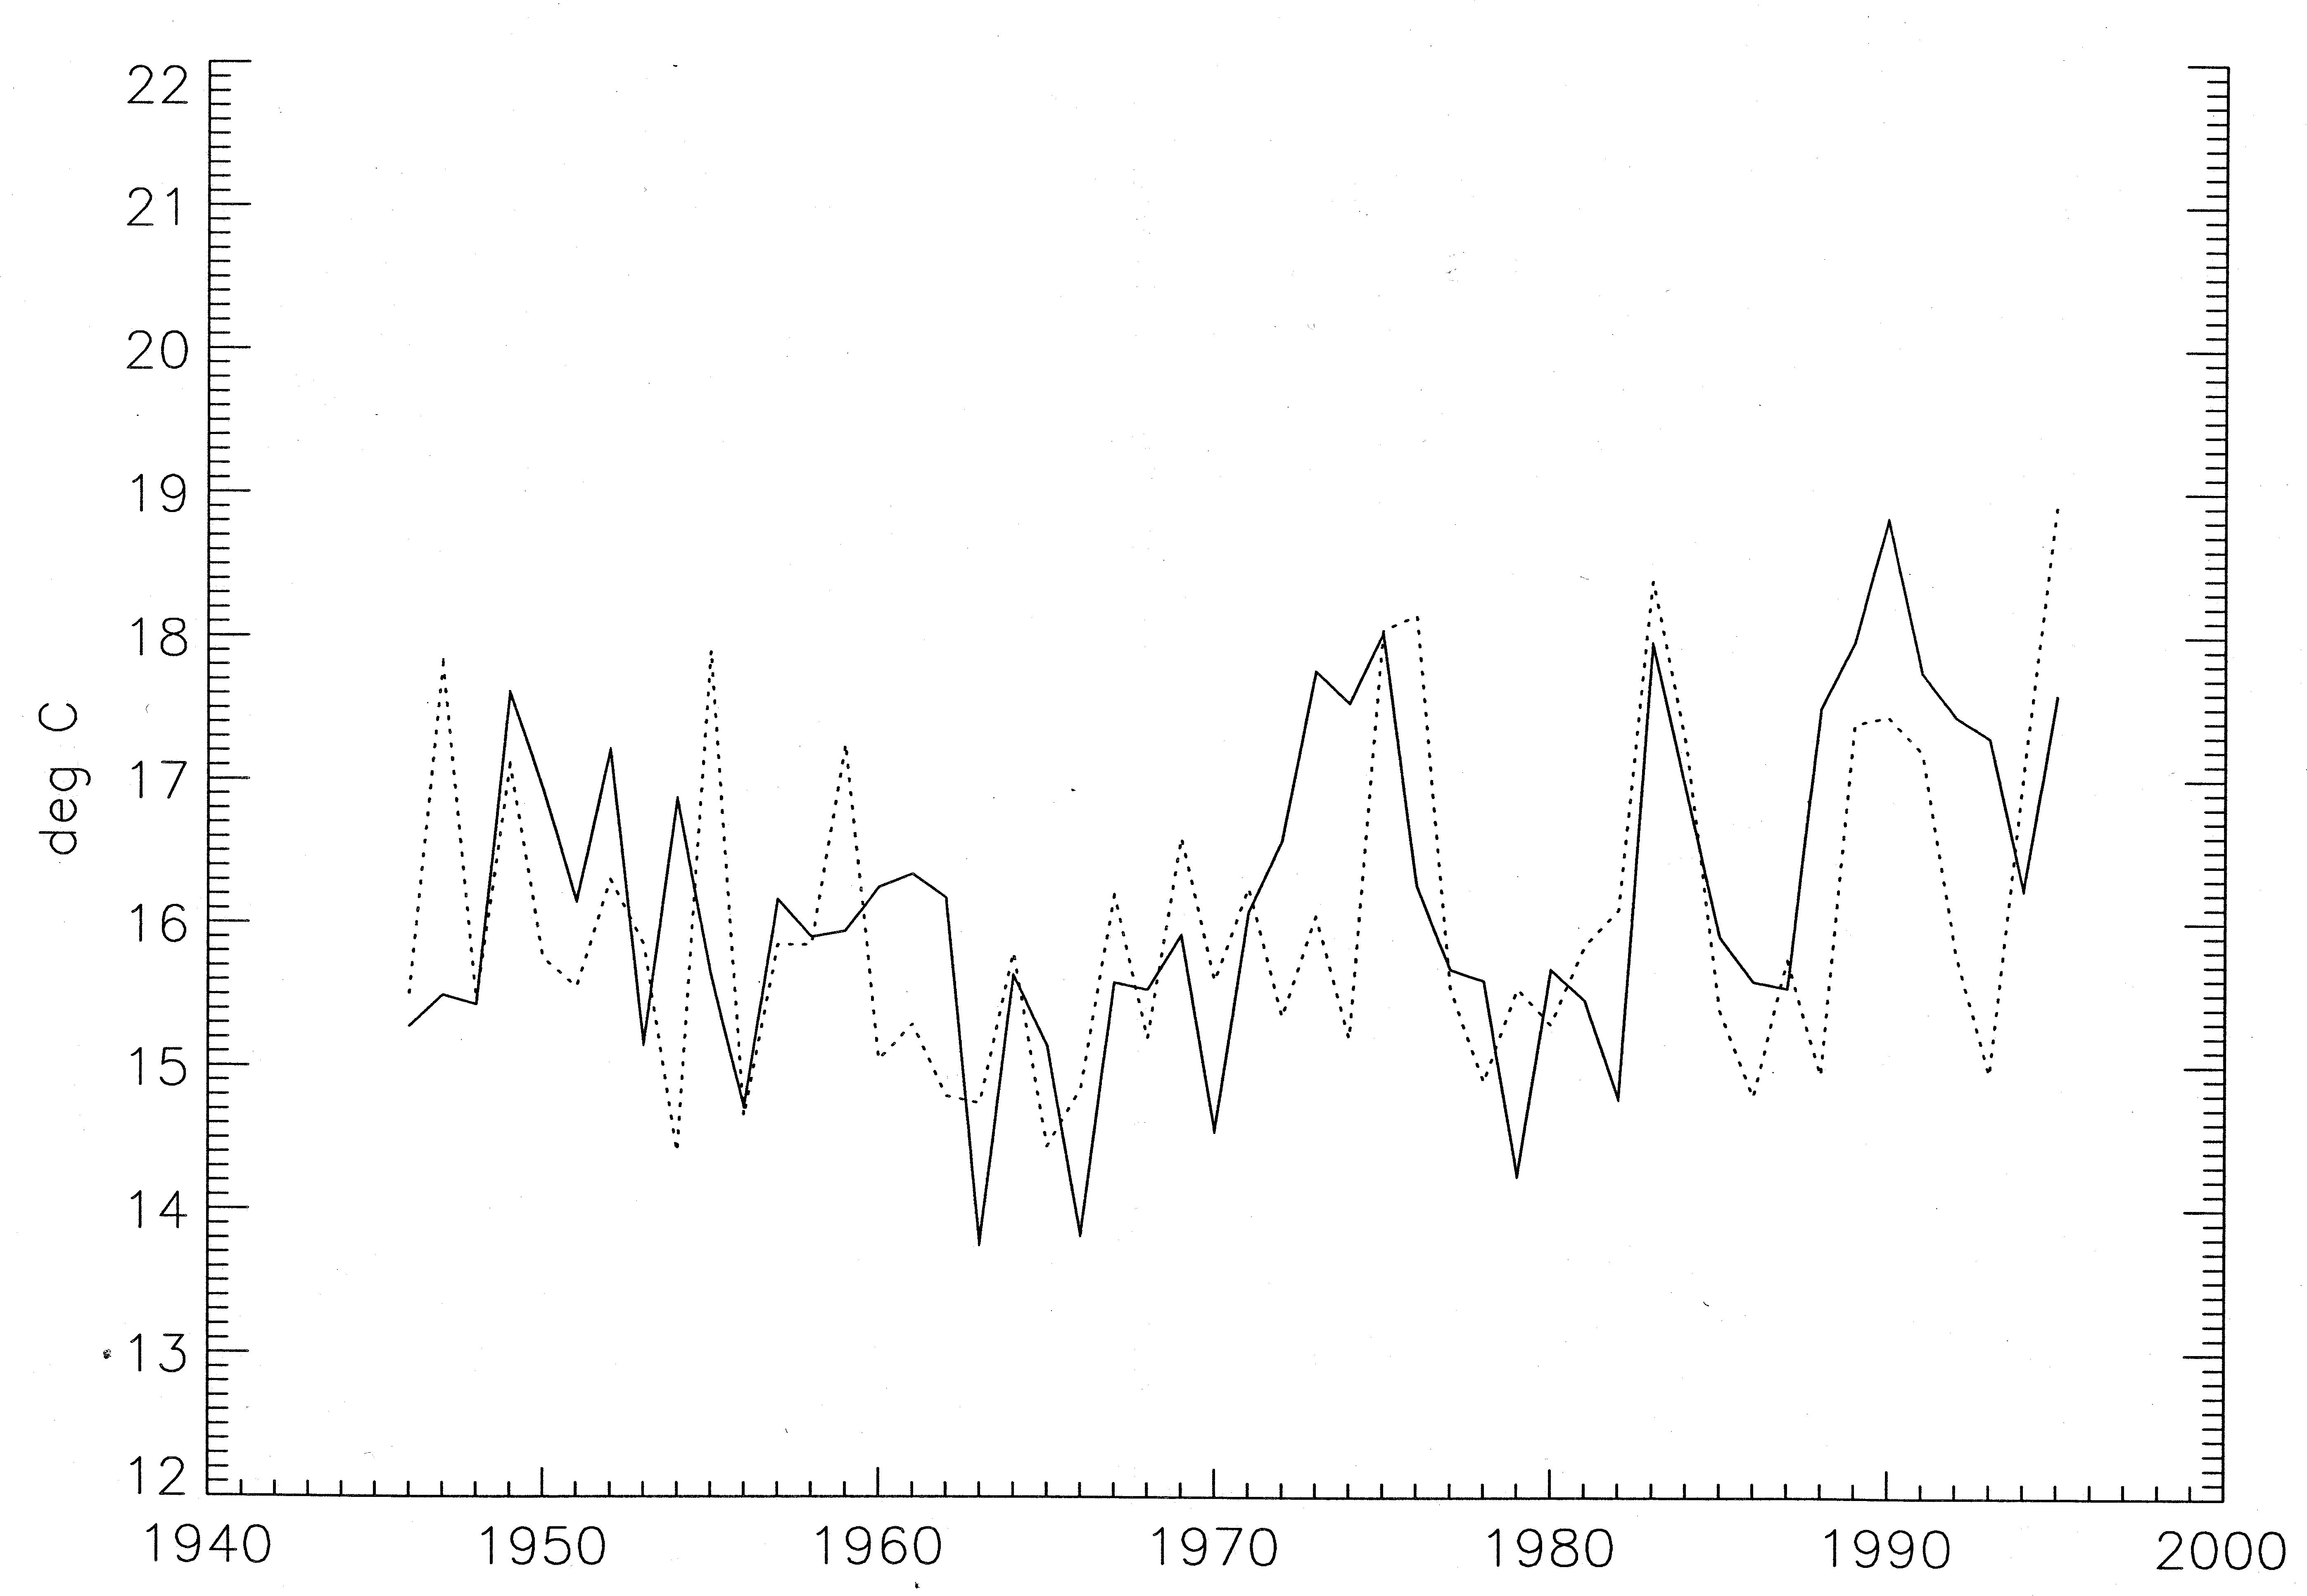
Fig. 3: JulyŁAugust Central England Temperature,
as observed (dashed) and as forecast (solid) using a jackknife method for
1946Ł95. The temporal anomaly correlation is 0.47 .