[Previous Article] [Next Article]
Forecast of Northern Tropical Atlantic SST Using
Linear Inverse Modeling
contributed by Cecile Penland and Ludmila Matrosova
Climate Diagnostics Center, NOAA-CIRES, University of Colorado, Boulder, Colorado
Using the methods described in Penland and Matrosova (1997a,b), sea-surface temperature
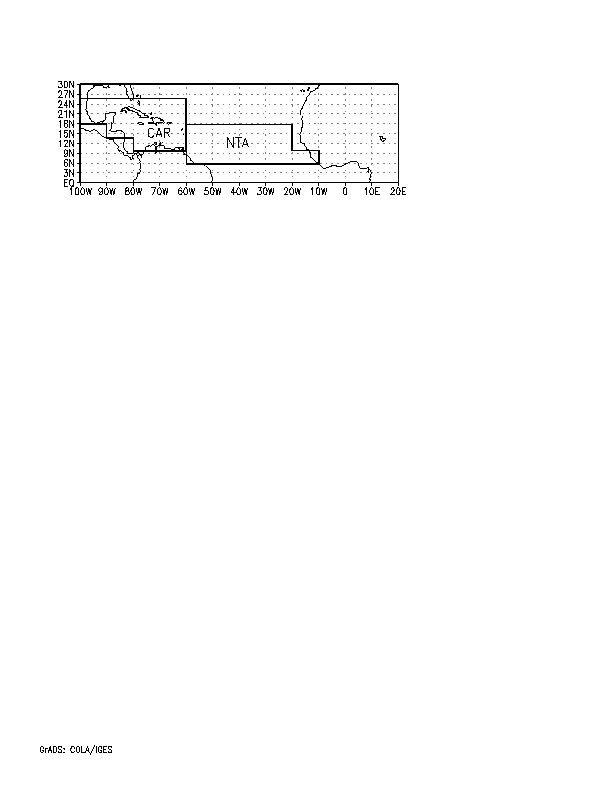
anomalies (SSTAs) in the north tropical Atlantic Ocean (NTA: Fig. 1) and the Caribbean (CAR:
Fig. 1) are predicted. Global tropical SSTAs are used as predictors; that is, a prediction at lead
time is made by applying a statistically-obtained Green function G() to an observed initial
condition consisting of global tropical SSTAs. Three-month running means of the temperature
anomalies are used, the COADS 1950-79 annual cycle has been removed, and the data have been
projected onto the 20 leading empirical orthogonal functions (EOFs) explaining about 67% of the
variance. The NTA region has an RMS temperature anomaly of about 0.3 oC; the CAR region has
an RMS temperature anomaly of about 0.2 oC. Data have been provided by NCEP, courtesy of
R.W. Reynolds.
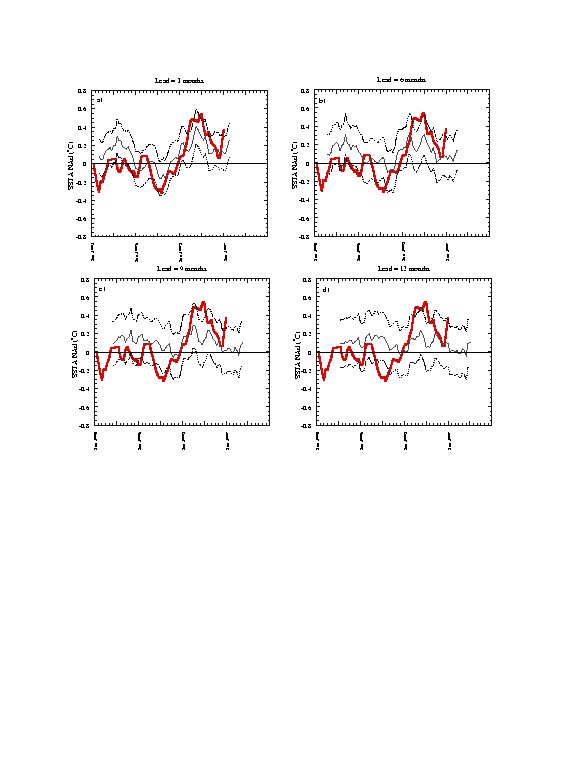
The inverse modeling prediction for the NTA SSTA is given in Fig. 2 for lead times of 3, 6, 9 and
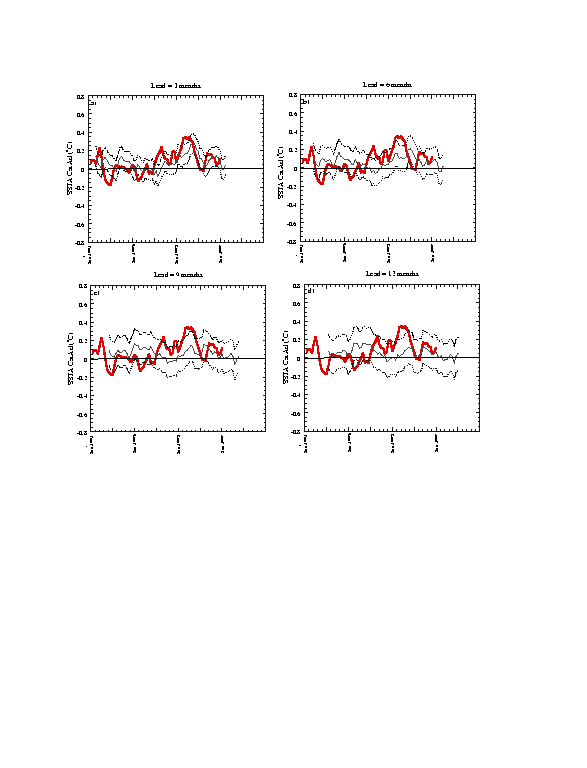
12 months. Figure 3, similarly, shows the prediction for CAR SSTA. A jackknifing procedure,
using five sets of training and independent verification periods (the latter containing 5 withheld
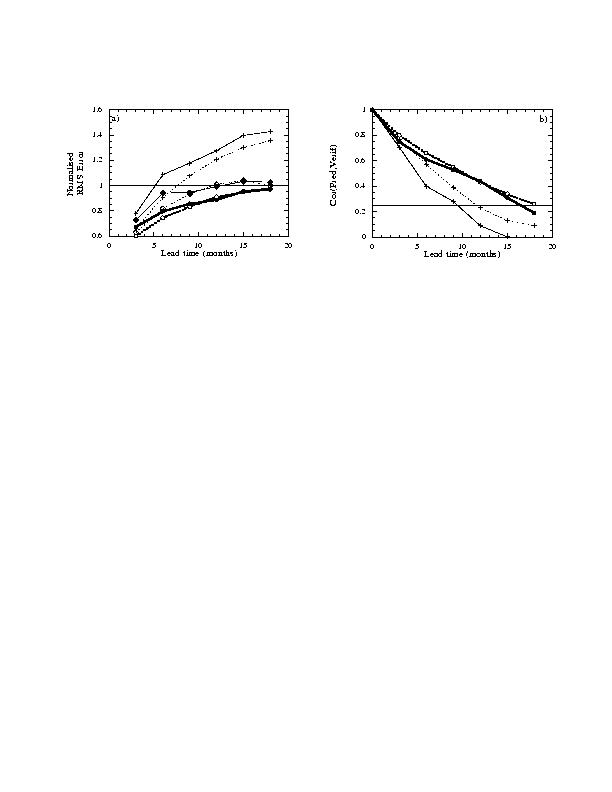
years at a time), was employed to evaluate the skill of the forecasts. The prediction methods have
a root mean square (RMS) error which approaches the RMS value at lead times of about 15
months (Fig. 4a). The lead time up to which correlations between time series of predictions and
observations are significantly positive is also about 15 months (Fig. 4b). Still, the reader should be
aware that these predictions are experimental and that only modest skill can be expected.
Penland, C. and L. Matrosova, 1997a: On the prediction of tropical Atlantic sea surface
temperatures. Proceedings, 21st Climate Diagnostics and Prediction Workshop, October
28-November 1, 1996, Huntsville, Alabama, in press.
Penland, C. and L. Matrosova, 1997b: Prediction of tropical Atlantic sea surface temperatures
using linear inverse modeling. J. Climate, 10, submitted.
Fig. 1. Map showing the North Tropical Atlantic (NTA) and Caribbean (CAR) regions within
which the average SSTA is predicted.
Fig. 2. Time series of linear inverse modeling (LIM) predictions (light solid line) of NTA SSTA
for lead times of 3, 6, 9 and 12 months. Also shown are the verification series (heavy solid line)
and the one standard deviation confidence interval appropriate to the LIM forecast (dotted lines).
Fig. 3. As in Fig. 2, but for CAR SSTA.
Fig. 4. (a): Root mean square (RMS) prediction error normalized to variance of verification field.
Solid lines and filled symbols: NTA SSTA. Dotted lines and open symbols: CAR SSTA. Circles:
LIM forecast. Diamonds: First order autoregressive process (AR1) forecast. Plus signs:
Persistence forecast. (b): Correlation as a function of lead time between prediction and
verification forecast. Symbols as in (a). A jackknifing procedure, using five sets of training and
independent verification periods, was employed to evaluate the forecasts. Details may be found in
Penland and Matrosova (1997b).