[Previous Article] [Next Article]
Forecasts of Surface Temperature and Precipitation Anomalies over
the U.S. Using Screening Multiple Linear Regression
contributed by D. Unger
Climate Prediction Center, NOAA, Camp Springs, Maryland
Screening multiple linear regression (SMLR) is used to predict seasonal temperature and
precipitation amounts for locations over the mainland United States. Predictor data consist of
northern hemisphere 700-mb heights, near global SSTs and station values of mean temperature
and total precipitation amount from the 3-mo period prior to the forecast initial time of March 1,
1997. Forecasts for the mean temperature and total precipitation are made for a series of 13
overlapping 3-mo periods, at one month intervals, beginning with Apr-May-Jun 1997 and
extending through Apr-May-Jun 1998. Regression relationships were derived from data for the
1956-96 period. Forecasts were produced from single station equations for 59 stations
approximately evenly distributed throughout the U.S.
All predictors and predictands were expressed as standardized anomalies relative to the
developmental data. Precipitation amounts were transformed by taking their square roots prior to
standardization in order to help normalize their distribution. Twenty-five candidate predictors,
selected from gridpoint values in regions of known importance for climate prediction, were
offered for screening in the regression development. A few predictor locations were chosen on
the basis of data examination of the first 20 years of the sample, referred to here as the base
period. Information from the most recent 20 years was never used for selection of candidate
predictors (Unger, 1996a). One additional predictor, carbon-dioxide concentration from Mauna
Loa Observatory, was offered in order to capture long-term trends in the data. This crude trend
variable provides the screening procedure with a convenient predictor with which to identify
stations that have simple trends in their predictand values.
A variation of a retroactive real time (RRT) validation technique was used to estimate forecast
skill (Unger 1996b). To estimate skill by RRT, a forecast equation was derived from the base
period and applied to the next year's data to obtain independent data results. The case was then
added to the developmental sample, a new relationship was derived and applied to the following
year's data. Independent data statistics accumulate on a year by year basis in exactly the same
way as an operational forecast procedure, except retroactively. Forecasts were obtained for the
base period years by application of RRT in reverse. Bi-directional RRT (BRRT) validation
technique provides that each available case contribute to a skill estimate as independent data in a
way similar to cross-validation except with a great reduction in the distortion of results, due to
redundant sampling in cross-validation (Unger, 1996b).
A forward selection screening procedure was used for equation development. The top 5 terms
were selected for each equation. Separate statistics were accumulated for each equation length,
so that results for all the one, two, three, four and five term equations were calculated. The
optimum equation length was then estimated by an objective learning procedure that used the past
performance at each RRT trial to "predict" which equation would perform the best on the next.
Verification statistics from this "best guess" forecast were also kept separately and were used to
obtain the final skill estimate of the forecasts.
The verification is based on the temporal corr-elation coefficient between forecast and observation
on the 40 independent cases at each of the 59 stations. Field significance was measured by
comparison of spatially averaged correlation coefficients from forecasts applied to actual target
years against those applied to 500 randomly shuffled target periods. Field significance expresses
the percentage of cases in which the random forecast series outperformed the actual forecasts.
The final forecasts are post-processed to obtain an estimate of the likelihood of the above, normal,
or below class being observed, as defined by the terciles of the distribution for each forecast
element and location. A forecast is assigned a class on the basis of the forecast distribution and
skill. An estimate of the increased likelihood of a given class is made to place the forecast in a
format similar to the operational long lead forecasts issued by the CPC (O'Lenic, 1994).
The probability assignments for temperature forecasts are made by integration of the estimated
forecast error distribution against the 1961-90 temperature class limits. An estimate of the skill
for low and high temporal frequencies (obtained from the 10-yr moving average of the forecasts
and the residual of this value from the raw forecast, respectively) is used to estimate the forecast
error distribution (Unger, 1997). The class limit with the highest departure from climatology is
displayed with its anomaly contoured. Because precipitation trends are less pronounced,
precipitation probabilities are estimated on the basis of the empirical probabilities associated with
skill and forecast magnitude as determined from historical forecasts.
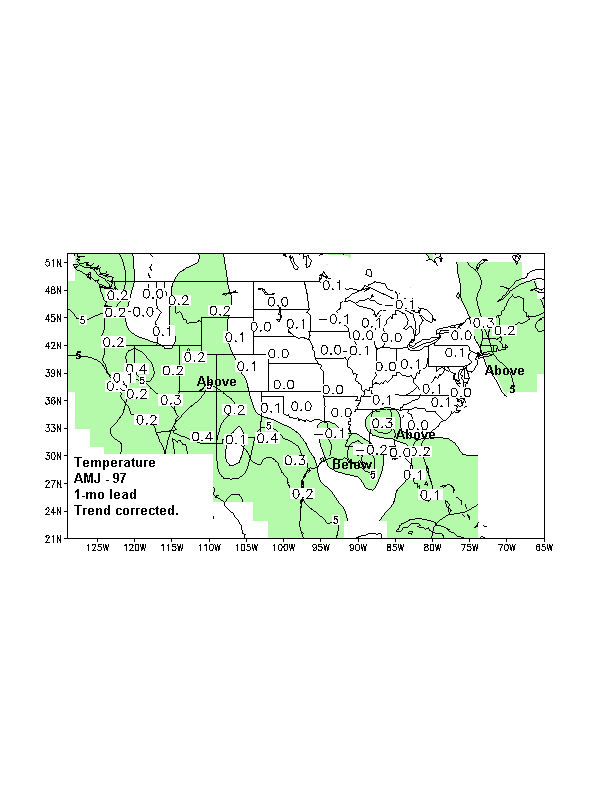
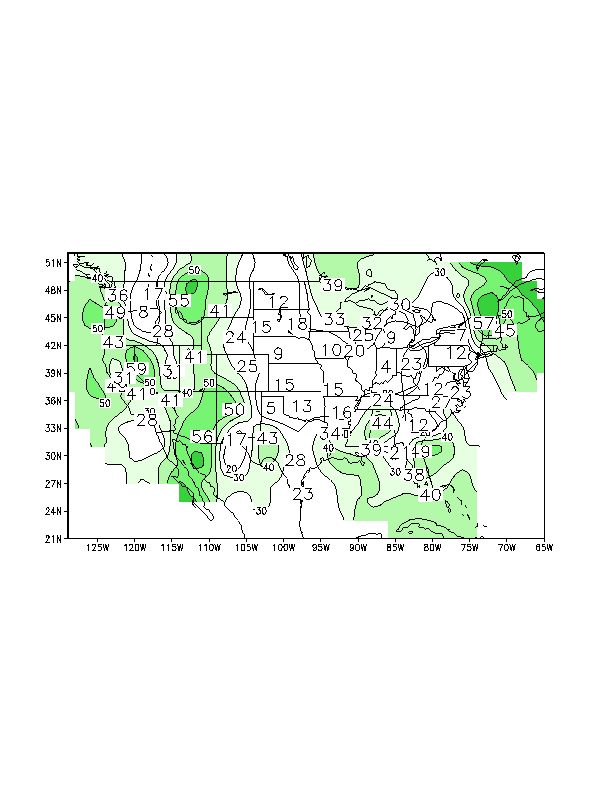
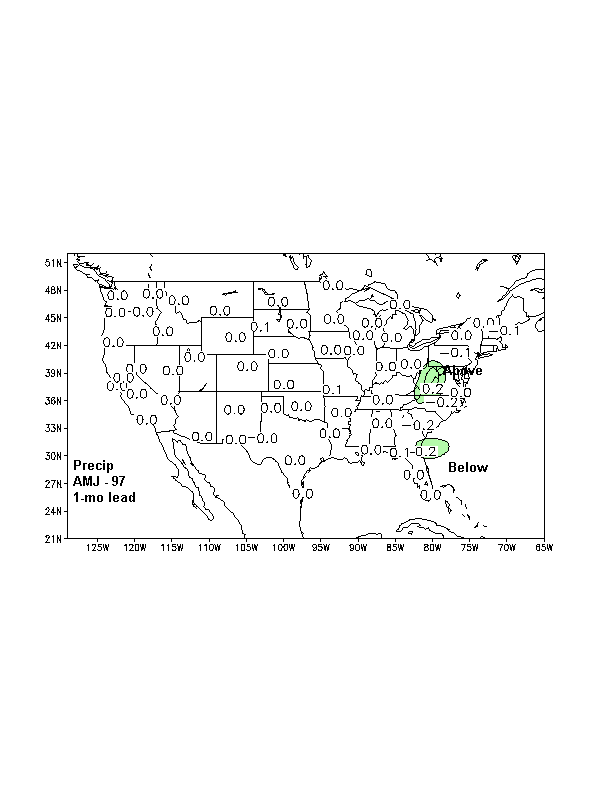
The forecasts for AMJ 1997 are shown in Figs. 1 and 3 with the corresponding skill estimates for
each station shown in Figs. 2 and 4. Shading indicates areas of sufficient skill to assign a tercile
category to the forecast. Contours within the shaded areas on the forecast maps indicate 5 and 10
percent probability anomaly estimates for the category.
The numbers plotted in Figs. 1 and 3 indicate station values of the original regression forecasts,
damped according to the forecast-observation correlation on independent data to minimize the
squared error. Non-zero numbers plotted outside of shaded regions indicate forecast anomalies of
substantial magnitude at stations with some skill, but lower than the skill threshold to choose a
forecast category with confidence.
Regression forecasts for AMJ (Fig. 1) show above normal temperatures over much of the western
U.S., extending into central Texas. Warmer than normal temperatures are also indicated for
Florida, interior Alabama and New England. Below normal temperatures are indicated over
Louisiana. Of these areas, only the stations in west and central Texas show any high frequency
skill. The skill of the forecasts for the remainder of the country reflects low frequency signals
successfully predicted by the historical BRRT forecasts.
Precipitation forecasts for AMJ 1997 (Fig. 3) show very little skill, with a small area of below
median precipitation forecast for northeast Florida and an above median precipitation area
forecast for interior Virginia and West Virginia. This result is not field significant (.628),
indicating that these scores are not distinguishable from those which might be expected from
chance correlations.
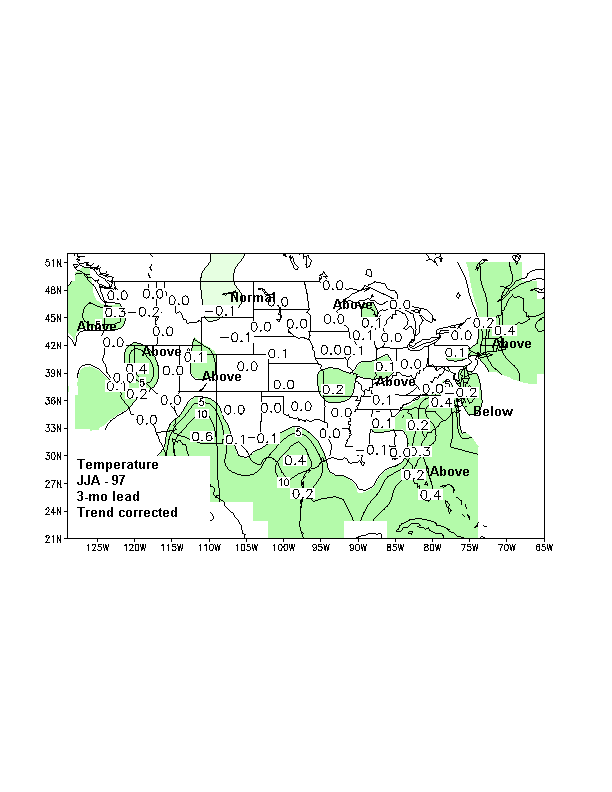
Figure 5 shows the temperature forecast for JJA 1997. Above normal temperatures are forecast
for New England, along the southern Atlantic coast, Texas, Arizona, western Nevada, central
California, and northwestern Oregon. An area of near normal temperatures is forecast for eastern
Montana and there are some hints of above in the north central U.S. An isolated pocket of below
normal temperatures appears over a single station in coastal Virginia.
REFERENCES
O'Lenic, E., 1994: A new paradigm for production and dissemination of the NWS's long lead-time
seasonal climate outlooks. Proceedings of the Nineteenth Annual Climate Diagnostics Workshop.
College Park, Maryland, November 14-18, 1994, 408-411.
Unger, D. A., 1996a: Long lead climate prediction using screening multiple linear regression.
Proceedings of the Twentieth Annual Climate Diagnostics Workshop. Seattle, Washington,
October 23-27, 1995, 425-428.
Unger, D. A., 1996b: Skill assessment strategies for screening regression predictions based on a
small sample size. Preprints, Thirteenth Conference on Probability and Statistics in the
Atmospheric Sciences. San Francisco, CA., February 21-23, 1996, 260-267.
Unger, D. A., 1997: Conversion of Long Lead Climate Predictions from Continuous to
Probabilistic Form. Proceedings of the Twenty-first Annual Climate Diagnostics and Prediction
Workshop. Huntsville, Alabama October 28-November 1, 1996. (in press).
Figure 1. A 1-mo lead screening regression-based temperature forecast for AMJ 1997.
Contours are estimated probability anomalies of the specified tercile. Shaded areas delineate
the area of sufficient skill to depart from climatology by at least 3 percent. Plotted numbers are
station values of the standardized anomaly.
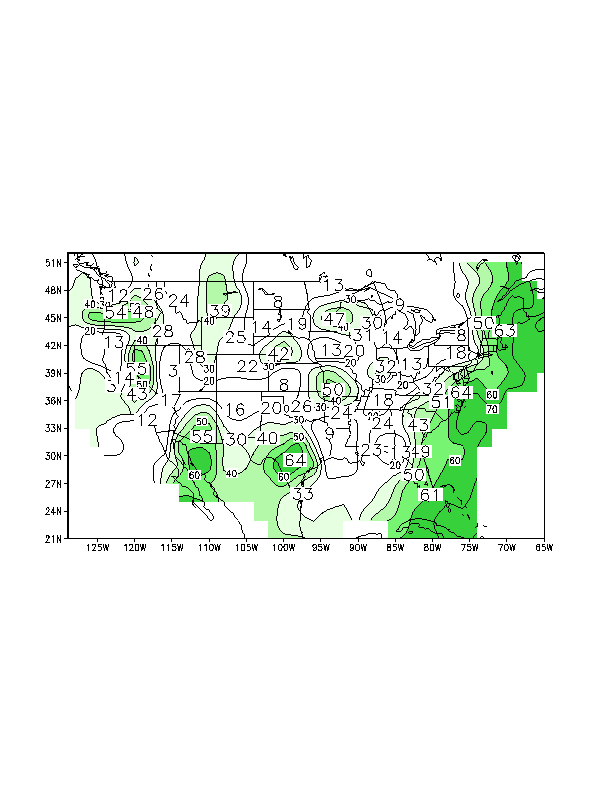
Figure 2. Distribution of skill for the 1-mo lead regression forecast for AMJ 1997 temperatures.
Both the plotted values and the contours are the correlation (x100) between forecast and
observation for the 1956-1996 period.
Figure 3. Same as Fig. 1 except for precipitation forecasts.
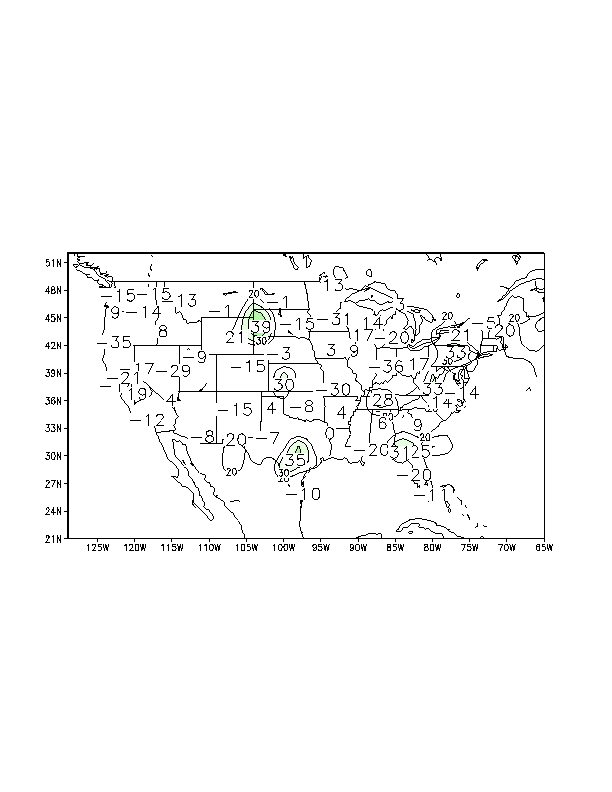
Figure 4. Same as Fig. 2 except for precipitation skill.
Figure 5. Same as Fig. 1 except for a 3-mo lead valid for JJA 1997.
Figure 6. Same as Fig. 2 except for a 3-mo lead valid for JJA 1997.