Singular spectrum analysis (SSA: Vautard and Ghil 1989) and the maximum entropy method (MEM: Penland et al. 1991) are used here for long-lead forecasts of the sea-surface temperature (SST) anomalies averaged over the Niño 3 area and the Southern Oscillation Index (SOI). The forecast is for up to one year ahead, based on the last 47 years of observed data. This forecast follows up on earlier forecasts using combined SSA-MEM methodology by C. Keppenne and M. Ghil for the SOI index, starting in the March 1992 issue of this Bulletin, and on those of N. Jiang, M. Ghil and J.D. Neelin for Niño-3 SST anomalies, starting with the March 1995 issue. More detailed information on the forecast method based on single-channel SSA combined with MEM is given by Keppenne and Ghil (1992), while multi-channel SSA (M-SSA: Keppenne and Ghil 1993) combined with MEM is documented in the March 1995 issue of this Bulletin (see also Jiang et al. 1995). Briefly, the time series is filtered first by SSA (if univariate) or M-SSA (if multivariate), so that the statistically significant components are retained, specifically the quasi-quadrennial (QQ) and the quasi-biennial (QB) com-ponents of ENSO variability (Rasmusson et al. 1990; Keppenne and Ghil 1992; Jiang et al. 1995). Then MEM is applied to advance these components in time.
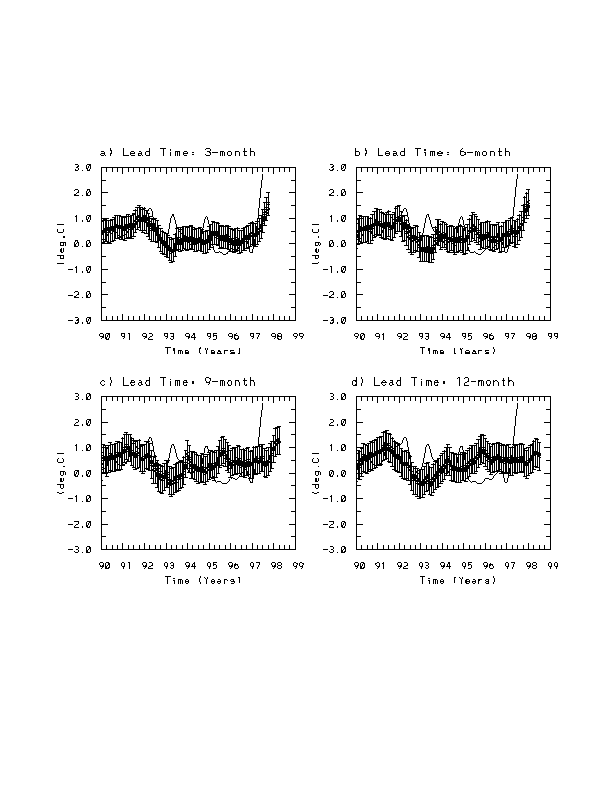
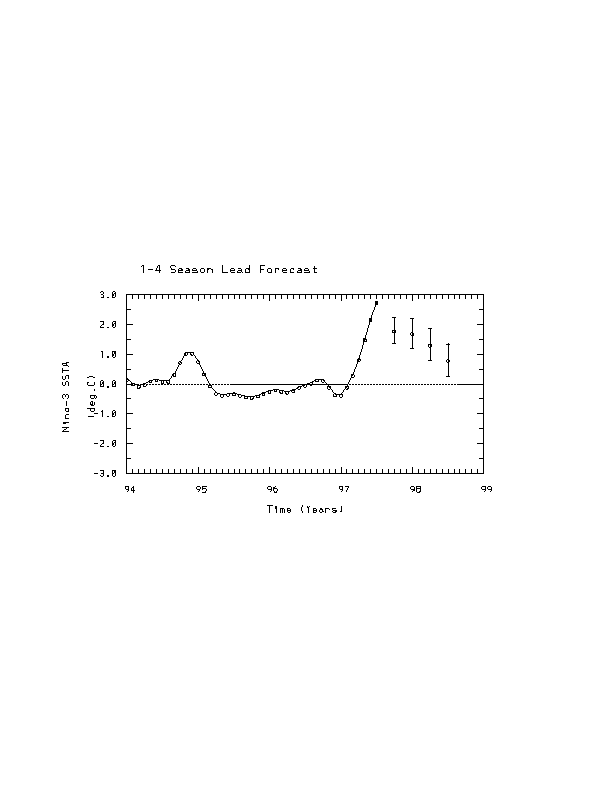
Figure 1 shows area-averaged Niño 3 SSTAs, forecast and observed, since 1990, using the SSA- and MSSA-MEM schemes for 6- and 12-month lead. The last forecast, for the next 1-4 seasons, using data through July 1997, is shown in Fig. 2. The vertical bars are one standard deviation in length, based on forecast verification over the 1984-93 time span. In accordance with our former predictions, as early as December 1996 in this Bulletin, the forecast indicates a continuous warm anomaly during the next few seasons. The current warm event is expected to peak in late 1997, and begin to decay in spring 1998. We base this overall assessment on the quarter-to-quarter tendency of our forecasts, since December 1996, rather than on the latest forecast alone.
The skill in our method is based on the low- frequency, oscillatory components of the system, and so forecasts tend to filter out short-lived from longer-term anomalies. According to the current and immediate- past predictions, the observed sharp rise of SST anomalies over the last few months does not foretell an El Niño of unprecedented magnitude; it is associated, in all likelihood, with a short-lived spike added to an ENSO event of typical magnitude.
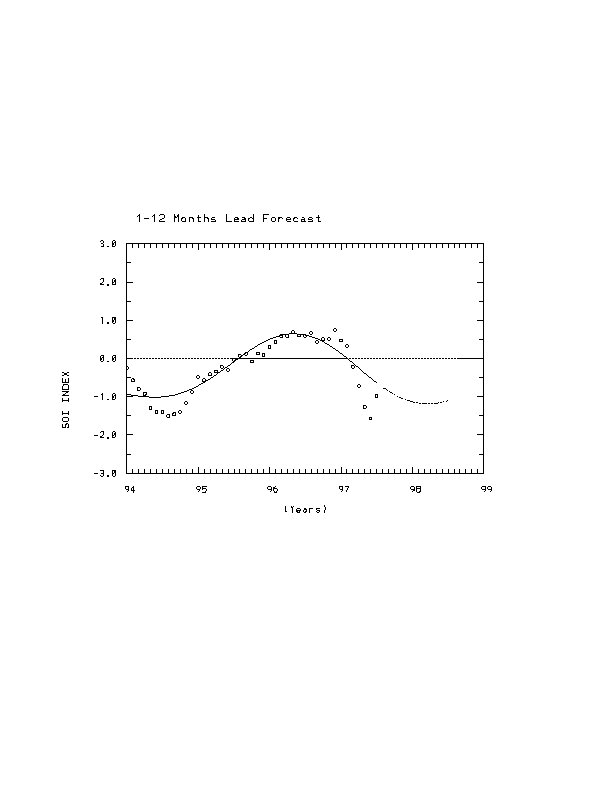
Figure 3 shows the SSA-MEM forecast for the SOI from August 1997 through July 1998. The SOI is expected to stay well below its mean through the middle of 1998. The anticorrelation between the present SOI and Niño-3 SSTA indicates higher predictability (Ghil and Jiang 1997), thus enhancing our confidence in the forecast.
It is a great pleasure to thank Ning Jiang for her contributions
to these forecasts in the past and wish her well in her new endeavors to
forecast the even less predictable financial indicators.
Ghil, M. And N. Jiang, 1997: Recent forecast skill for the El Niño/Southern Oscillation. Geophys. Res. Lett., 102, submitted.
Jiang, N., D. Neelin and M. Ghil, 1995: Quasi-quadrennial and quasi-biennial variability in the equatorial Pacific. Clim. Dyn., 12, 101-112.
Keppenne, C.L. and M. Ghil, 1992: Adaptive filtering and prediction of the Southern Oscillation Index. J. Geophys. Res., 97: 20449-20454.
Keppenne, C.L. and M. Ghil, 1993: Adaptive filtering and prediction of noisy multivariate signals: An application to subannual variability in atmospheric angular momentum. Intl. J. Bif. & Chaos, 3, 625-634.
Penland, C., M. Ghil and K.M. Weickmann, 1991: Adaptive filtering and maximum entropy spectra, with application to changes in atmospheric angular momentum. J. Geophys. Res., 96, 22,659-22,671.
Rasmusson E.M., X. Wang and C. F. Ropelewski, 1990: The biennial component of ENSO variability. J. Mar. Sys., 1, 71-96.
Vautard, R., and M. Ghil, 1989: Singular spectrum analysis in nonlinear dynamics with applications to paleoclimatic time series. Physica D, 35, 395-424.
Fig. 1. Forecasts of the area-averaged Niño-3 SST anomalies (SSTA) using the SSA-MEM (star) and MSSA-MEM (open circle) schemes. The solid line indicates the observed Niño-3 SSTA. The latest forecast starts from July 1997. Shown for (a) 6-month lead and (b) 12-month lead.
Fig. 2. The forecasts of the Niño-3 SSTA for the upcoming 4 seasons using the SSA-MEM scheme. The solid line indicates the observed Niño-3 SSTA through July 1997.
Fig. 3. SSA-MEM forecast of the SOI for August
1997 through July 1998. The circles are the monthly SOI values based on
a 5-month running mean without the seasonal cycle and the solid line is
the SSA-filtered SOI. The dashed line indicates the forecast for the next
12 months.