|
Contributors:
- Angell, J.K. OAR/Air Resources Laboratory
- Flynn, L.E. NESDIS/Office of Research and Applications
- Gelman, M.E. NWS/Climate Prediction Center
- Hofmann, D. OAR/Climate Monitoring and Diagnostic Lab.
- Long, C.S. NWS/Climate Prediction Center
- Miller, A.J. NWS/Climate Prediction Center
- Nagatani, R.M. NWS/Climate Prediction Center
- Oltmans, S. OAR/Climate Monitoring and Diagnostic Lab.
- Zhou, S. RS Information Systems, Inc.
Concerns of global ozone depletion (e.g. WMO, 1999) have led to major international
programs to monitor and explain the observed ozone variations in the stratosphere. In
response to these, as well as other long-term climate concerns, NOAA has established
routine monitoring programs utilizing both ground-based and satellite measurement
techniques (OFCM, 1988).
Selected indicators of stratospheric climate are presented in each Summary from
information contributed by NOAA personnel. A Summary for the Northern Hemisphere is issued
each April, and for the Southern Hemisphere, each December. These Summaries are available
on the World- Wide-Web, at the site
http://www.cpc.ncep.noaa.gov
with location: products/stratosphere/winter_bulletins.
Further information may be obtained from Melvyn E. Gelman
W/NP52, RM 806, WWB
NOAA Climate Prediction Center
5200 Auth Road
Camp Springs, MD 20746-4304
Telephone: (301) 763-8071, ext. 7558
Fax: (301) 763-8125
E-mail: melvyn.gelman@noaa.gov
ABSTRACT
Extensive ozone depletion was again observed over Antarctica during the Southern
Hemisphere winter/spring of 2004, with widespread total ozone anomalies of 45 percent or more below the
1979-1986 base period. The area covered by extremely low total ozone values of less than 220 Dobson Units,
defined as the Antarctic “ozone hole” area, in September reached maximum size of greater than 19 million square kilometers,
with an average size in September of 17.4 million square km, smaller than most recent years. Vertical profiles of ozone
amounts, measured by balloons over the South Pole, showed strongest destruction of ozone in the 15-20 km region, but minimum
values were not as low as seen during other recent years.
At the South Pole, the minimum total ozone value of 138 Dobson Units was observed
on 4 October 2004, when the center of the ozone hole was nearby. Lower stratosphere temperatures over the Antarctic region
in the winter of 2004 were again below -78 C, and were sufficiently low for polar stratospheric cloud formation, promoting
chemical ozone loss. However, the size of the area of very low temperatures was smaller in 2004 than most others in
the last 10 years. In the middle of September 2004, Antarctic lower stratospheric temperatures warmed above -78 C, limiting further severe
ozone destruction and also limiting the extent and duration of the ozone hole in 2004.
I. DATA RESOURCES
The data used for this report are listed below. This combination of complementary data,
from different platforms and sensors, provides a strong capability to monitor global ozone
and temperature.
Method of Observation
| Parameter |
Ground-Based |
Satellite/Instrument |
| Total Ozone |
Dobson |
NOAA/SBUV/2 |
|
|
Nimbus-7/SBUV |
| Ozone Profiles |
Balloon-Ozonesonde |
NOAA/ SBUV/2 |
|
|
Nimbus-7/SBUV |
| Temperature Profiles |
Balloon - Radiosonde |
NOAA/TOVS |
We have used total column ozone data from the NASA Nimbus-7 SBUV instrument from 1979
through February 1985; NOAA-9 SBUV/2 from March 1985 to December 1988; NOAA-11 SBUV/2
from January 1989 to December 1993; NOAA-9 SBUV/2 from January 1994 to December 1995;
NOAA-14 SBUV/2 from January 1996 to June 1998; NOAA-11 SBUV/2 from July 1998 to
September 2000; and NOAA-16 SBUV/2 from October 2000 to November 2004. Solar Backscatter Ultra-Violet
(SBUV) instruments can produce data only for daylight-viewing conditions, so SBUV/2 data are not
available at polar latitudes during winter darkness. Precession of the NOAA-11 satellite caused
SBUV/2 viewing high latitudes only in darkness and increasing data loss at sub-polar latitudes,
especially in 1992 and 1993.
II. DISCUSSION
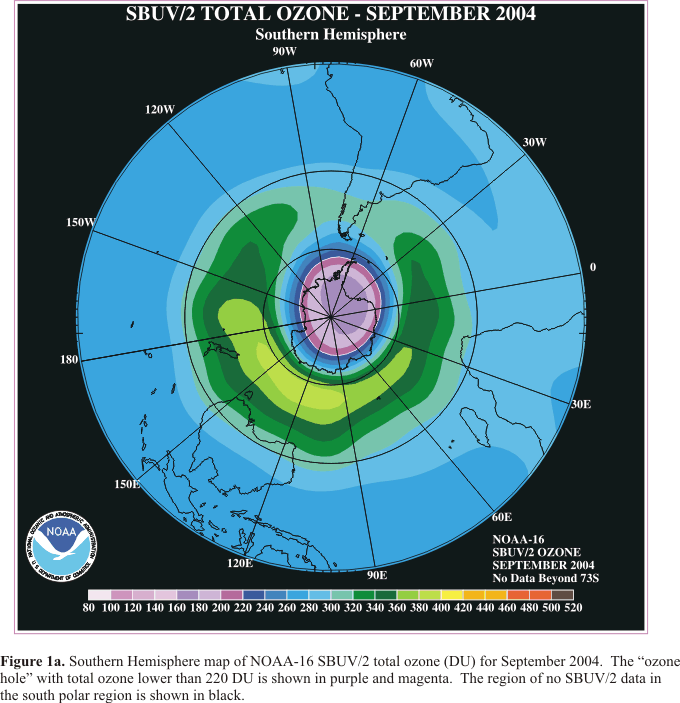
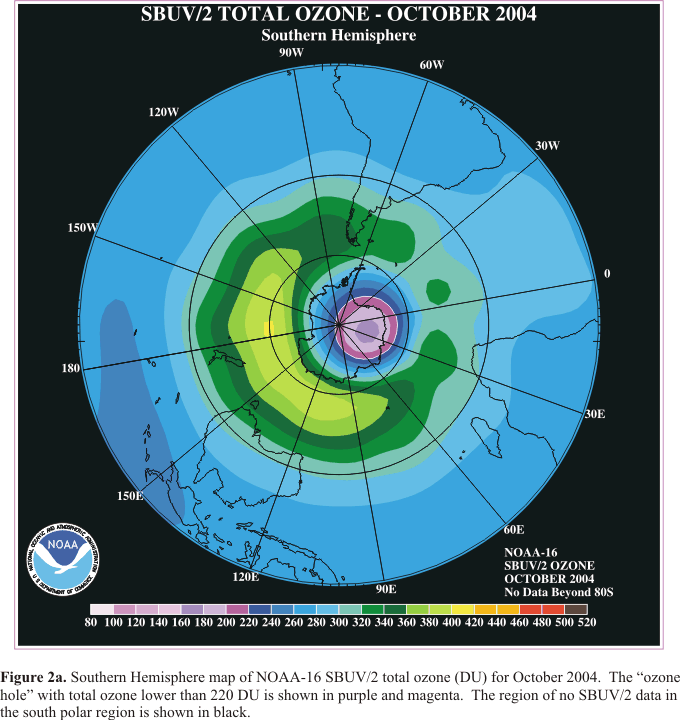
Maps of monthly average Southern Hemisphere SBUV/2 total ozone for September and October 2004 are
shown in Figure 1a and Figure 2a.
Lowest “ozone hole” values (defined as total ozone values less than 220 DU) appear over Antarctica
slightly displaced from the South Pole, and highest total ozone is shown in the Pacific Ocean between
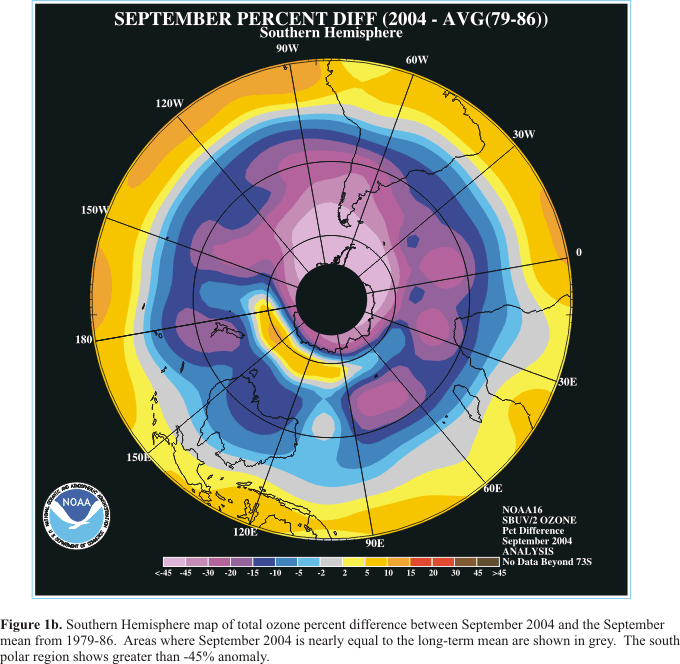
Antarctica and Australia. Figure 1b shows the difference in percent between the monthly
mean total ozone for September and eight (1979-86) monthly September means (Nagatani et al., 1988).
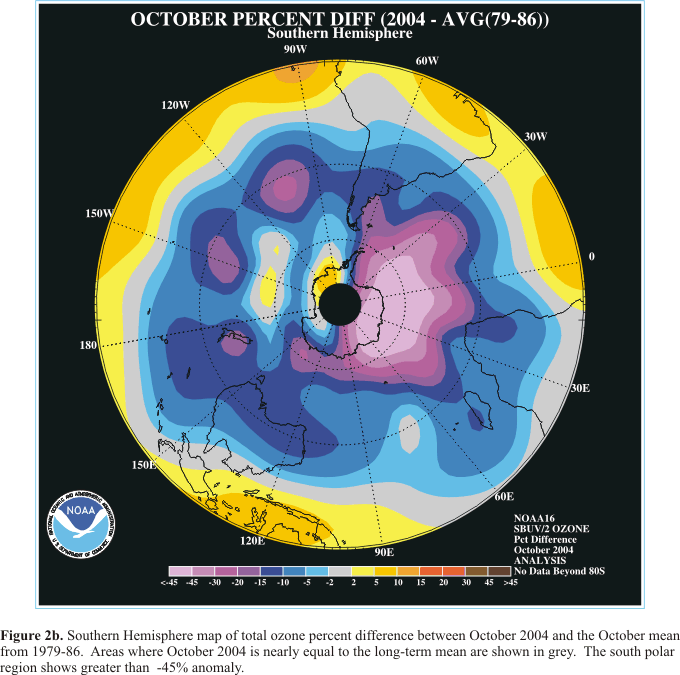
Extreme negative anomalies in total ozone of greater than 45 percent are shown
in September and October over most of Antarctica and adjacent ocean areas, reaching to southern Argentina.
Figure 2b shows that in October the large ozone anomaly was located over
Antarctica and adjacent oceans areas south of Africa.
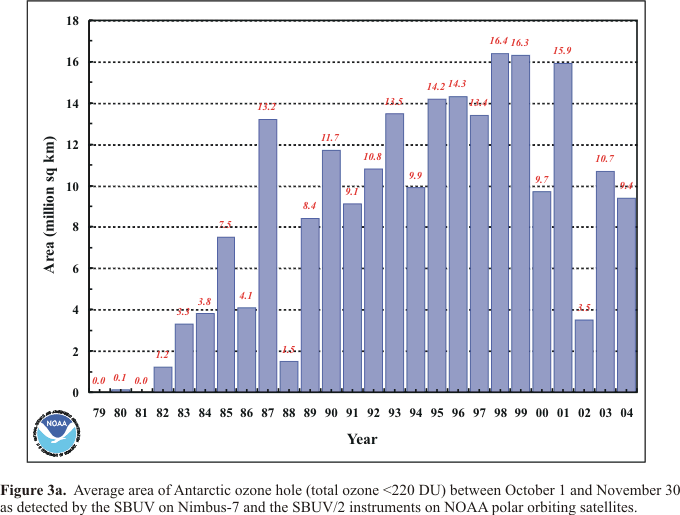
Figure 3a compares, for each year since 1979, the ozone hole area
average for all days in October through November 2004. The growth in the ozone hole area from the 1980s through
the 1990s is quite apparent. From a very small area in 1982, October/November average values increased
dramatically to a maximum in 1998 of 16.4 million square kilometers. The October/November 2004 average
ozone hole area was 9.4 million square kilometers, smaller than all but three years since 1990.
Figure 3b, c, and d
show the individual monthly average ozone hole size for, respectively, September, October, and November,
for years since 1980. The size decreased in October, and in November it was substantially diminished.
The ozone hole size during these months for 2004 was generally smaller than for most
recent years since 1990.
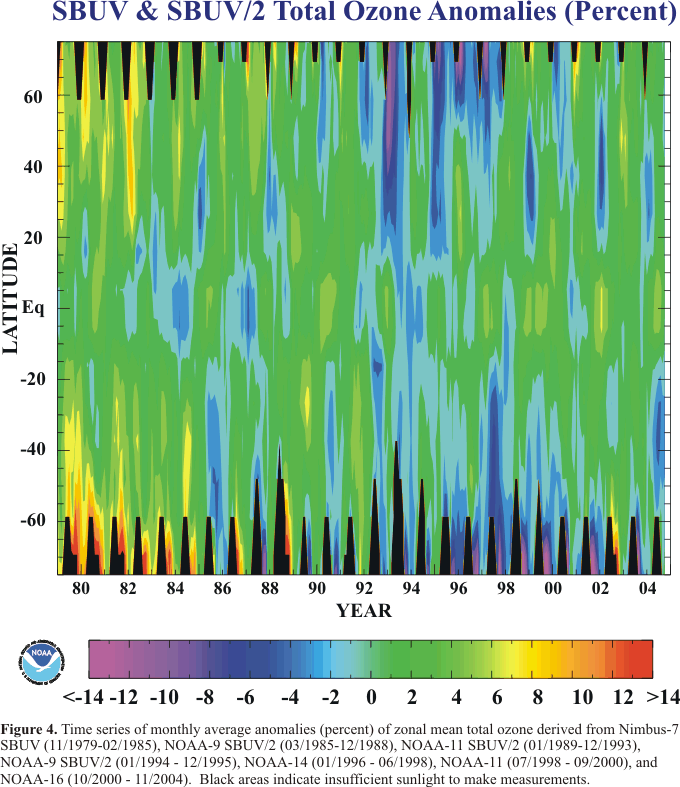
Figure 4 displays monthly average anomaly values (percent) of zonal
mean total ozone, as a function of latitude (80N to 80 S) and time (January 1979 to November 2004). The
anomalies are derived relative to each month's 1979-2004 average. Long-term ozone changes may be readily
seen in the polar regions, where ozone values were substantially lower in the 1990s than in the 1980s.
Largest anomalies are shown for the polar regions in each hemisphere in winter-spring months, with positive
anomalies of more than 10 percent in the earlier years changing to negative anomalies of greater than 10
percent for most recent years. For 2004 the lowest ozone anomailes were not as great over
the south polar latitudes as for most other years.
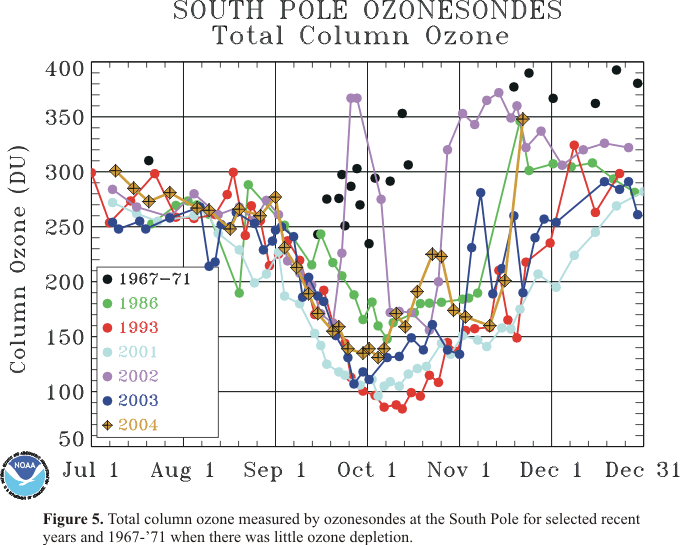
The center of the ozone hole and associated lowest ozone, and polar vortex are often located close to the
South Pole. Figure 5 shows a time series during 2004 of total ozone, measured over the South Pole using
balloon-borne ozone instruments, compared with other selected years. Low ozone hole values appeared in
September 2004, with lowest values evident at the end of September and early October , when the center of
the ozone hole was closest to the South Pole. Total ozone values rose in October, when the ozone hole
diminished and was displaced from the South Pole.
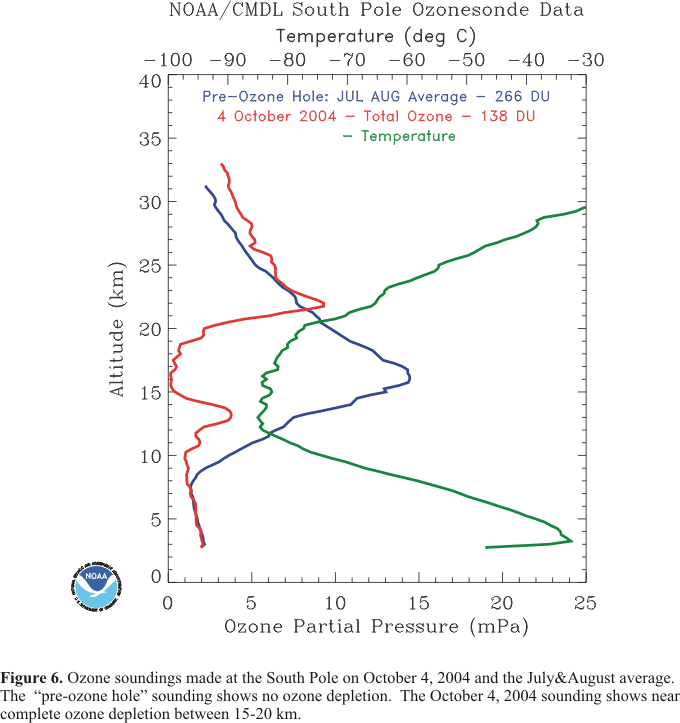
On 4 October (Figure 6) the total column ozone amount of 138 DU
was observed at the South Pole, the minimum value for the year 2004. This profile shows strong destruction of
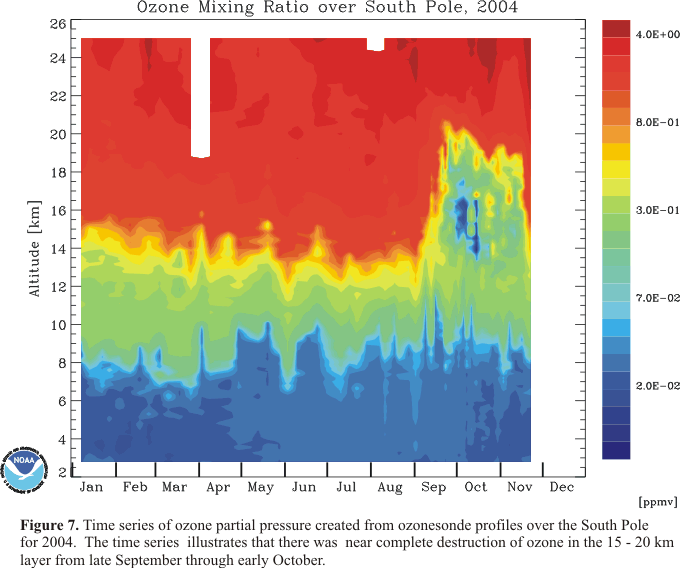
ozone between 15 and 19 km associated with classic ozone hole conditions. The time series in
Figure 7 of ozone profiles at the South Pole during 2004 shows the
time sequence of dramatic decreases in ozone between 15 and 20 km especially evident in September and October.
Extremely low values of ozone associated with ozone hole conditions continued in early October, but moderated
thereafter.
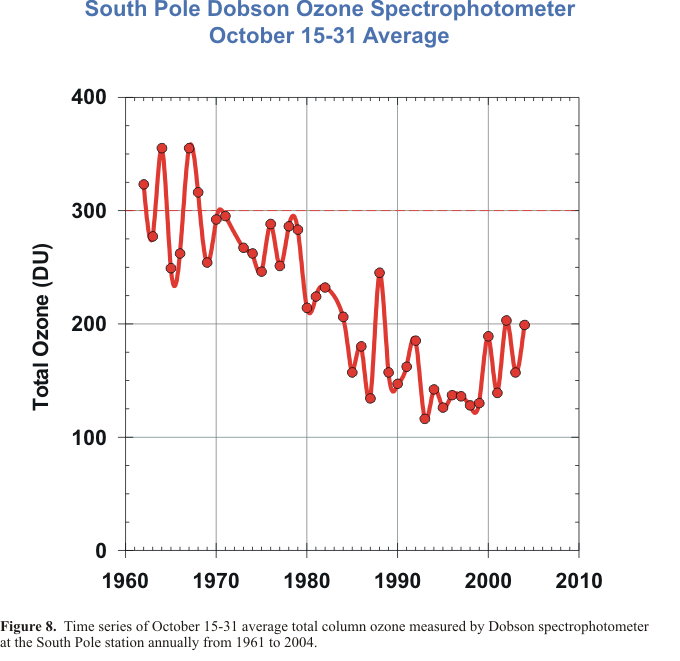
One of the longest records of ozone measurements in Antarctica is the total column ozone amount obtained with
the Dobson spectrophotometer at South Pole Station. Consistent observations can be obtained beginning on
October 15 of each year when sufficient sunlight is available for these optical measurements that use the
sun as a light source. This record of average October 15-31 column amounts shown in
Figure 8 indicates declines that accelerated in the 1980s and
reached consistently low values from 1993-1999. Since 2000 there has been greater variability in this average
with the suggestion of a tendency toward larger column amounts than observed during the 7-year minimum period.
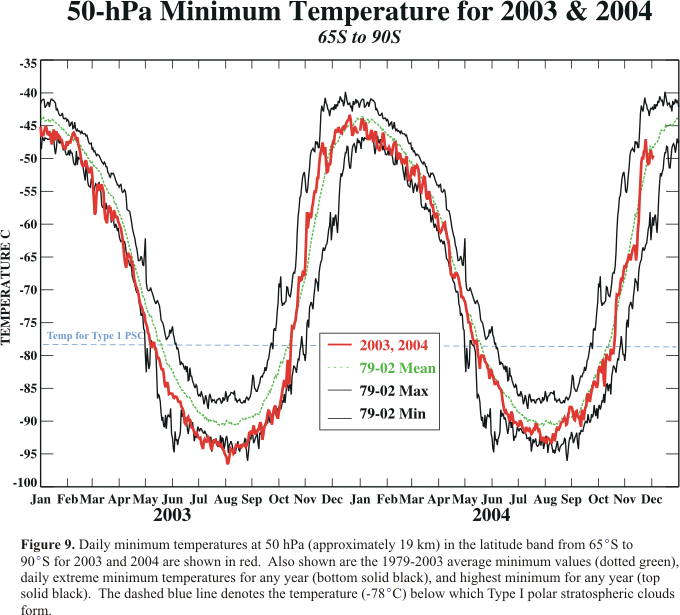
Ozone amounts in the lower stratosphere are closely coupled to temperatures through dynamics and photochemistry.
Extremely low stratospheric temperatures (lower than -78 C) over the Antarctic region contribute to depletion of
ozone, in that low temperatures lead to the presence of polar stratospheric clouds (PSCs). PSCs enhance the
production and lifetime of reactive chlorine, leading to ozone depletion (WMO, 1999). Daily minimum
temperatures at 50 hPa (approximately 19 km) over the polar region, averaged from 65S to 90S are shown in
Figure 9. For most of the Southern Hemisphere winter of 2004,
minimum temperatures in the south polar region were below -78 C. These minimum temperatures were below long-term
average minimum values but not
near record low temperatures. The rise in temperatures above -78 C in mid-October 2004 limited
the further formation of polar stratospheric clouds and thus also limited further extreme ozone destruction.
Temperatures in the winter and spring of 2004 were higher than in 2003, and coincided with a smaller ozone hole
than in 2003.
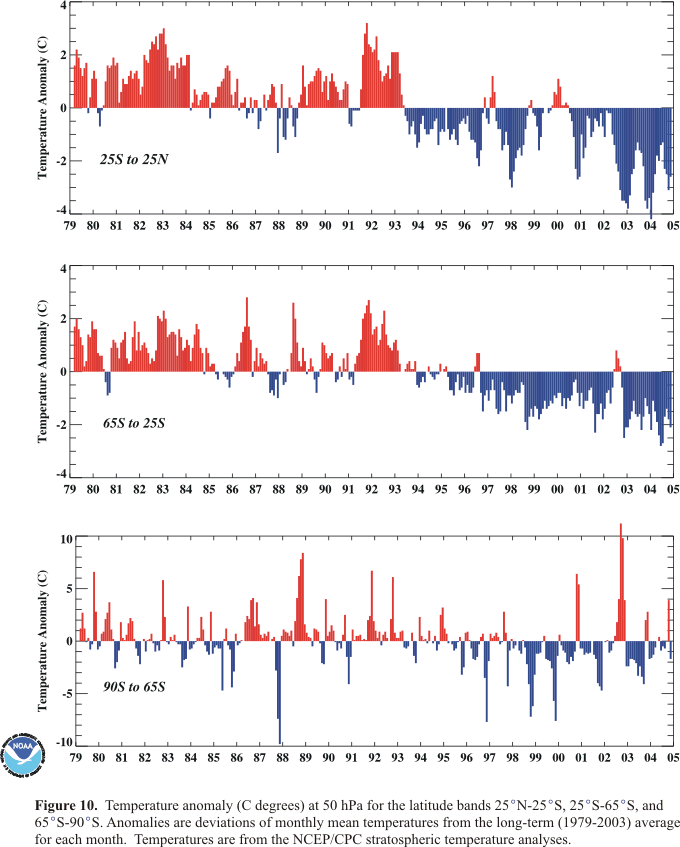
Figure 10 shows monthly average temperature anomalies at 50 hPa for
three latitude regions, 25S-25N, 65S-25S, and 90S-65S. For the south polar region, October 2004 temperatures were
higher than the long-term average, and November average temperatures were a little lower. Negative temperature anomalies
predominated over the middle latitudes of the Southern Hemisphere, with very large negative anomalies over
tropical latitudes. Both the tropical and middle latitudes of the Southern Hemisphere continue the tendency
toward lower temperatures after 1993 relative to higher temperatures in earlier years.
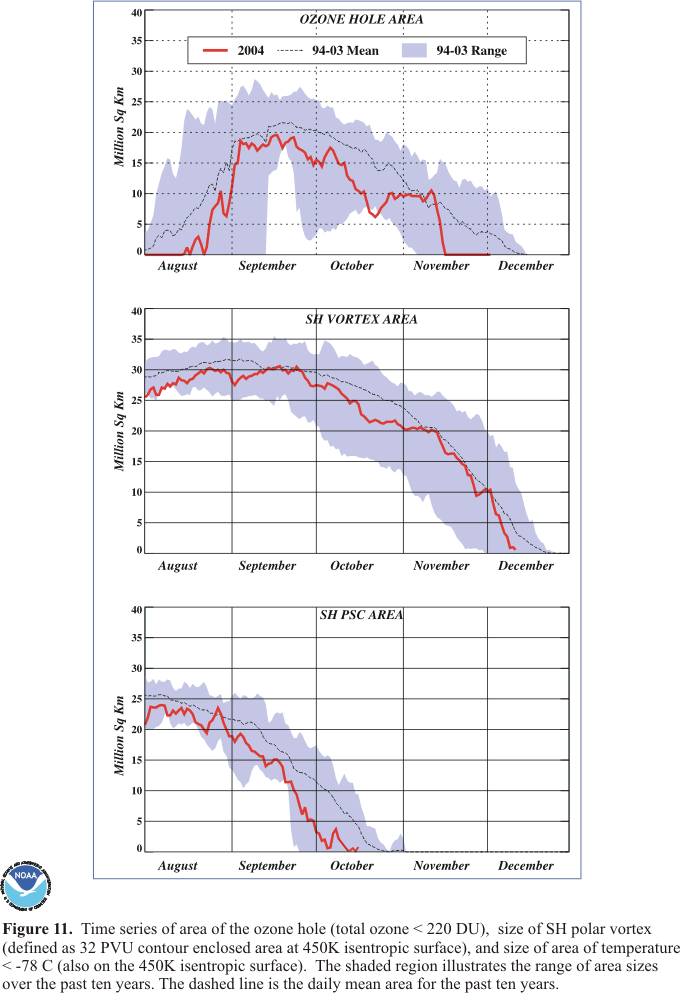
Figure 11 presents time series of the area of the ozone hole, the
size of the polar vortex, and the size of the polar area where lower stratosphere temperatures were below -78 C
(polar stratospheric cloud, PSC area). The daily 2004 values are shown, along with the extreme and average
daily values for the most recent 10 years. During 2004, the area for all three indicators was smaller than
average. The decrease in October coincided with the decrease in size of the area of very low
temperatures. The size of the ozone hole correlates well with the size of the PSC area during the formation
stages of the ozone hole in August and the first part of September.
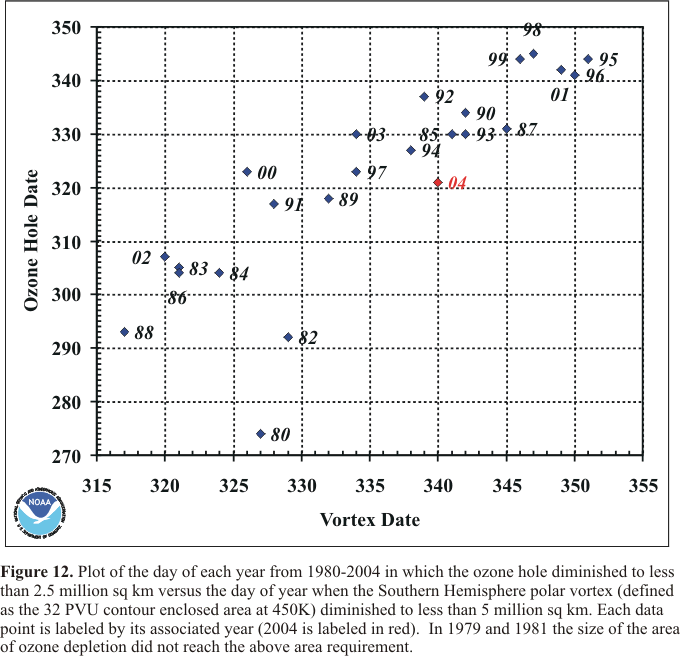
Figure 12 illustrates the direct relationship between the persistence
of the ozone hole and the persistence of the Antarctic polar vortex. In years when the winter polar vortex
persisted later in the season, the duration into the spring season of the ozone hole also tended to be extended.
For the year 2004, the persistence of the ozone hole and the persistence of the Southern Hemisphere polar
vortex extended longer than most years since 1980, but shorter than most years since 1990.
III. CONCLUDING REMARKS
Very low ozone values were again observed over Antarctica in the
winter/spring of 2004. Ozone depletion of more than 45 percent was observed over Antarctica, compared to total
ozone amounts observed in the early 1980's. Vertical soundings over the South Pole during August, September and
October 2004 again showed strongest destruction of ozone at altitudes between 15 and 20 km. Lower stratosphere
temperatures in the winter of 2004 over the Antarctic region were higher than in 2003. Associated with
this, the ozone hole area was smaller than in 2003. The ozone hole in 2004 diminished in size and depth along with warming stratospheric
conditions in September and October, and, by mid-November, total ozone over Antarctica had increased to levels above ozone
hole values.
Observations of chloroflourocarbons and of stratospheric hydrogen chloride support the view that international
actions are reducing the use and release of ozone depleting substances (WMO, 1999; Anderson et al., 2000).
However, chemicals already in the atmosphere are expected to continue to impact the ozone amount for many decades to come.
Further, changing atmospheric conditions that modulate ozone can complicate the task of detecting the start of
ozone layer recovery. The eruption of the Pinatubo volcano provided an example of such a complication in the
1990s. Based on an analysis of 10 years of South Pole ozone vertical profile measurements, Hofmann et al., (1997)
estimated that recovery in the Antarctic ozone hole may be detected as early as the coming decade. Indicators
include: 1) an end to springtime ozone depletion at 22-24 km, 2) 12-20 km mid-September column ozone loss rate
of less than 3 DU per day, and 3) a 12-20 km ozone column of more than 70 DU on September 15. An intriguing
aspect of recent observations of the Antarctic stratosphere had been the apparent trend towards a later breakup
of the vortex in years since 1990, relative to the 1980s. The limited duration and size of the 2004 ozone hole is attributed in
part to meteorological conditions. A full explanation of such meteorological anomalies is not yet available.
Continued monitoring and measurements, including total ozone and its vertical profile, are essential to achieving
the understanding needed to identify ozone recovery.
IV. REFERENCES
Anderson, J., J. M. Russel III, S. Solomon, and L. E. Deaver, 2000: Halogen Occultation Experiment
confirmation of stratospheric chlorine decreases in accordance with the Montreal Protocol,
J. Geophys. Res., 105, 4483-4490.
Hofmann, D.J., S.J. Oltmans, J.M. Harris, B.J. Johnson, and J.A. Lathrop, 1997: Ten
years of ozonesonde measurements at the south pole: implications for recovery of
springtime Antarctic ozone. J. Geophys. Res., 102, 8931-8943.
Miller, A.J., R.M. Nagatani, L.E. Flynn, S. Kondragunta, E. Beach, R. Stolarsky,
R. McPeters, P.K. Bhartia, M. Deland, C.H. Jackman, D.J. Wuebbles, K.O. Putten, and R.P. Cebula, 2002,
A cohesive total ozone data set from SBUV/(2) satellite system, J.Geophys. Res., 107(0),doi:10.1029/200,D000853.
Nagatani, R.N., A.J. Miller, K.W. Johnson, and M.E. Gelman, 1988: An eight year
climatology of meteorological and SBUV ozone data, NOAA Technical Report NWS 40, 125 pp.
OFCM, 1988: National Plan for Stratospheric Monitoring 1988-1997. FCM-P17-1988. Federal
Coordinator for Meteorological Services and Supporting Research, U.S. Dept. Commerce,
124pp.
Planet, W. G., J. H. Lienesch, A. J. Miller, R. Nagatani, R, D. McPeters, E.
Hilsenrath, R. P. Cebula, M. T. DeLand, C. G. Wellemeyer, and K. M. Horvath, 1994:
Northern hemisphere total ozone values from 1989-1993 determined with the NOAA-11 Solar
Backscatter Ultraviolet (SBUV/2) instrument. Geophys. Res. Lett., 21,
205-208.
WMO, 1999: Scientific assessment of ozone depletion: 1998. World Meteorological
Organization Global Ozone Research and Monitoring Project - Report No. 44.
VI. Web Pages of Interest
|


