Problem with 8/2004+ Ice Analyses
In August 2004, the old sea-ice analysis programs were upgraded.
The new analyses
had a different land-sea mask and more importantly changed the land values
from 0 to 1.5. The sea-ice concentration over water remained in the range of
0 to 1. Examination of the code for CDAS, Reanalysis-2 and the operational
GFS indicated that all these codes would limit the read-in values to lie
between 0 and 1. Consequently one might expect that interpolating the
sea ice from a land point (value=1) would produce coastal
sea ice which would be obvious in August.
At least that was the assumption of two people
who examined the potential effects of the new sea ice analyses.
(Yes, I was one of them.) No unusual sea ice was noticed in the various
analyses during August 2004
and people thought there was no problem in using the new sea ice analyses.
In Februrary 2005, an email from Europe asked when the 20C surface
temperatures off Denmark was going to be fixed in the operational
forecasts. Looking at a global map one easily miss the problem but
if you zoomed in, one could see a few of grid point with obviously
warm temperatures. The problem was traced back to the new sea-ice analyses.
The 3 assimilation systems thought certain coastal grid points
had sea ice. However, the code then thought the sea ice was
inconsistent with the current SST (so true) and promptly rejected
both the SST and sea-ice analyses. (At one time, both analyses were
produced by the same system.) When you reject both analyses, the SST
remains constant in time. You wouldn't notice it after a few weeks but
in 6 months, it can become pretty obvious.
The Fix
The idea behind reanalysis is to keep a fixed assimilation system; however,
one needs to change the code to keep up with the changing data sources.
20C water in coastal Denmark during February is not an observation but
an incompatibility between the ice analyses and the software. The
software (cycle/sfc) was changed to (1) interpolate sea-ice from the
the nearest water point rather than the nearest point and to (2) believe
the SST analyses even when the sea-ice analyses is inconsistent
with the SST analyses. Consequently
the changes will make the surface conditions better reflect the
input sst/sea-ice analyses.
Implications
These changes give the assimilation systems the correct sea ice.
However, we are under no illusions that the sea-ice climatology
will remain the same after 8/2004. First, there will be some
changes caused by the differing sea-ice analyses schemes. We've
already seen changes in the snow climatology caused by upgrades in
the snow analyses. I wouldn't be surprised by changes in the SST
caused by improvements in the observations. Second, the old scheme's
interpolation could have produced a ice-free coastal water point if
the nearest point were land. The new scheme will put in sea ice if
appropriate. Duplicating this error would have been difficult given
that the land-sea mask and resolution (not sure) have and are expected
to change in the future.
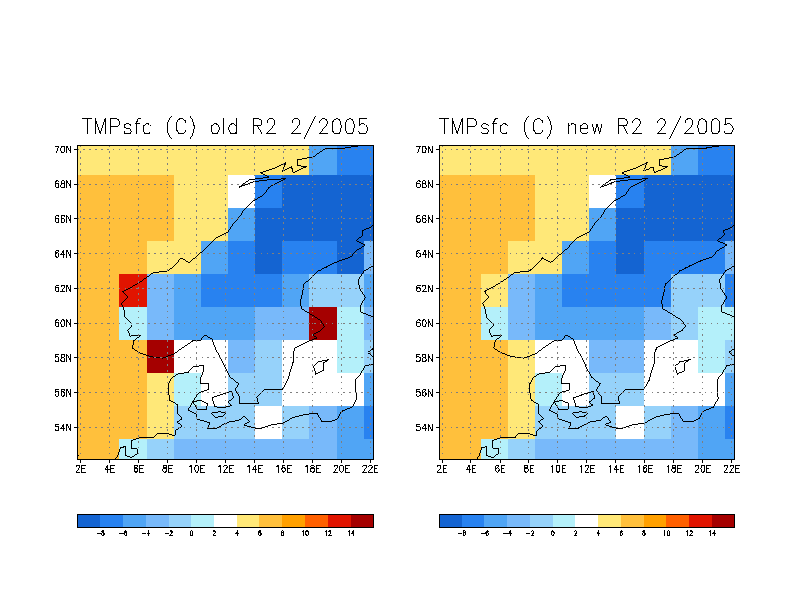
Results
The problem caused certain grid points to ignore the new SST analyses.
Consequently at these points, the SST remains constant in time
and the problem become very noticable when the SSTs are a minimum (late
winter). In this plot, three coastal points had the incorrect surface
temperature.
 The following is a global plot of the difference between the surface
temperatures in the original and fixed analyses. You can see that
August SSTs were used in a number of coastal grid points. You will
also notice a 1-2 C warming in the Artic relative to the new analyses.
The following is a global plot of the difference between the surface
temperatures in the original and fixed analyses. You can see that
August SSTs were used in a number of coastal grid points. You will
also notice a 1-2 C warming in the Artic relative to the new analyses.
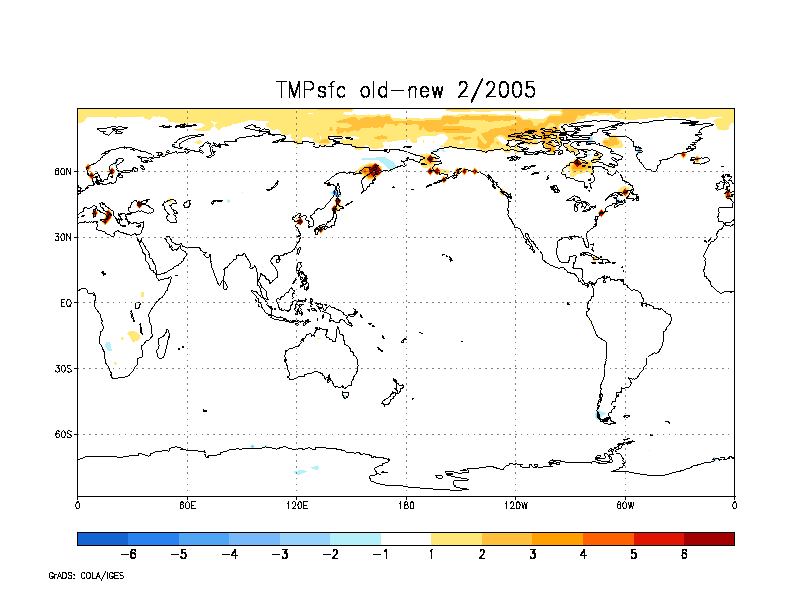 The Arctic warming in the old analyses was unexpected and not
present in the January and
December mean temperatures. Detailed examination indicated that
the snow depth was less over the Arctic sea ice which caused a greater
heat flux through the sea ice.
The Arctic warming in the old analyses was unexpected and not
present in the January and
December mean temperatures. Detailed examination indicated that
the snow depth was less over the Arctic sea ice which caused a greater
heat flux through the sea ice.
Differences in tabular format
R2 flx files monthly average 200501
R2 flx files monthly average 200502
R1 pgb files monthly average 200408
R1 pgb files monthly average 200409
R1 pgb files monthly average 200410
R1 pgb files monthly average 200411
R1 pgb files monthly average 200412
R1 flux files monthly average 200408
R1 flux files monthly average 200409
R1 flux files monthly average 200410
R1 flux files monthly average 200411
R1 flux files monthly average 200412
Affected Files
The files from 00Z August 1, 2004 to March, 2005 were affected.
The new (v1.1) files have the following codes:
- NCEP/NCAR Reanalysis (CDAS): subcenter=1, process=181
00Z August 1, 2004 to 12Z March 22, 2005.
- NCEP/DOE Reanalysis (R2):subcenter=1, process=196
00Z August 1, 2004 to 12Z March 28, 2005.
|


