Wesley Ebisuzaki, CPC/NCEP
April 26, 1997
Since the preliminary examination was written, it was determined that both assumptions were not true. Last week, Bert Katz and Jack Woollen found an error in the "Complex Quality Control" (CQC) module written for the TOGA-COARE period. Apparently the temperature to virtual temperature conversion was never done. The extent of the error is being investigated and a revised TOGA-COARE period reanalysis is anticipated.
This page will be updated when more information is available.
The following text is out of date. The figures, however, show the extent of the problems during the TOGA-COARE period.
April 26, 1997.
NCEP/NCAR Reanalysis uses input data which is inhomogeneous in
both space and time. The inhomogeneities in time can create
spurious trends as the analyses tend toward the model's
climatology whenever there is not enough data.
While most of the major temporal inhomogeneities have time scales of
years to decades, field experiments can collect large amounts of
data over a very short period of time and produce inhomogeneities
in the final analysis.
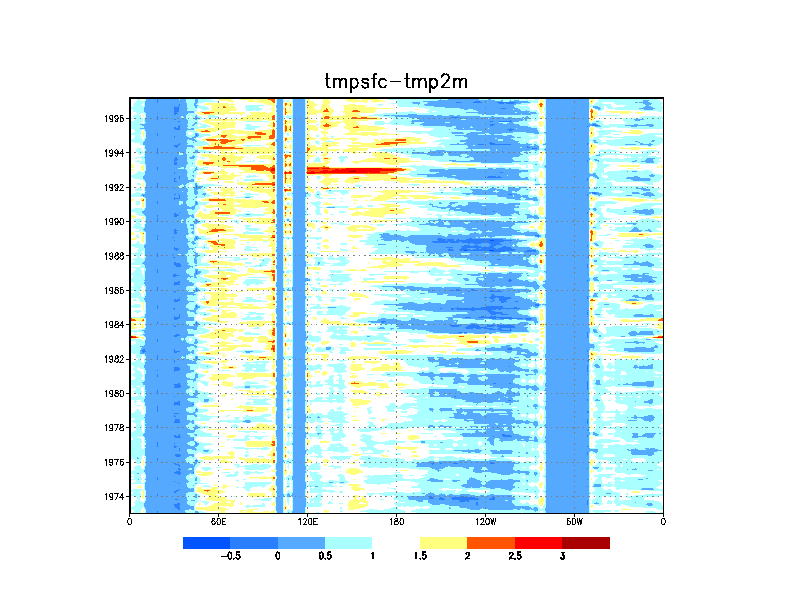
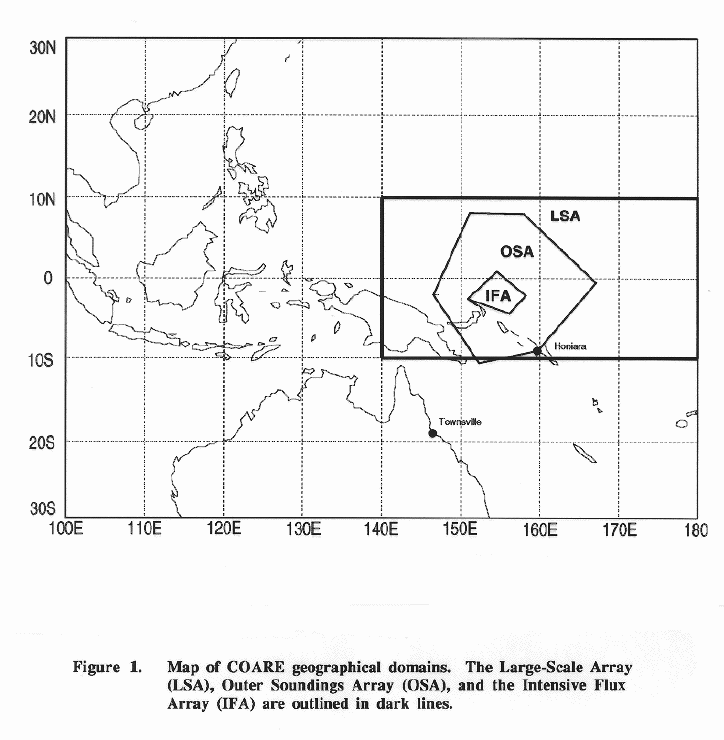
The difference between the SST and 2 meter temperature is a quantity that one expects to be relatively constant on monthly time scales as the 2 m temperature is strongly influenced by the SST. Fig. 1 shows the difference between the skin temperature and the 2 m temperature on the equator. This figure shows an unusual behavior centered around the start of 1993 and 160E. This anomalous difference coincides with TOGA COARE, a tropical-ocean field experiment, which occurred from Nov '92 to Feb '93 centered around 155E and the equator (Fig. 2).
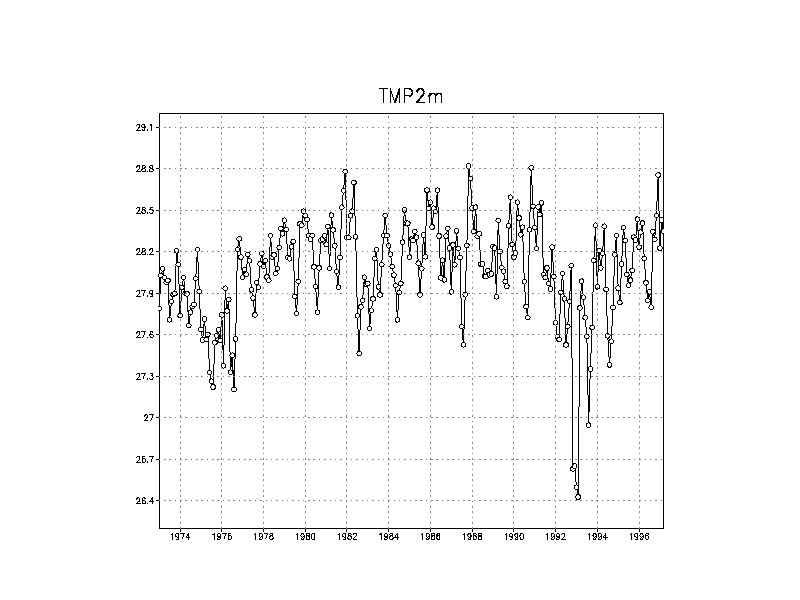
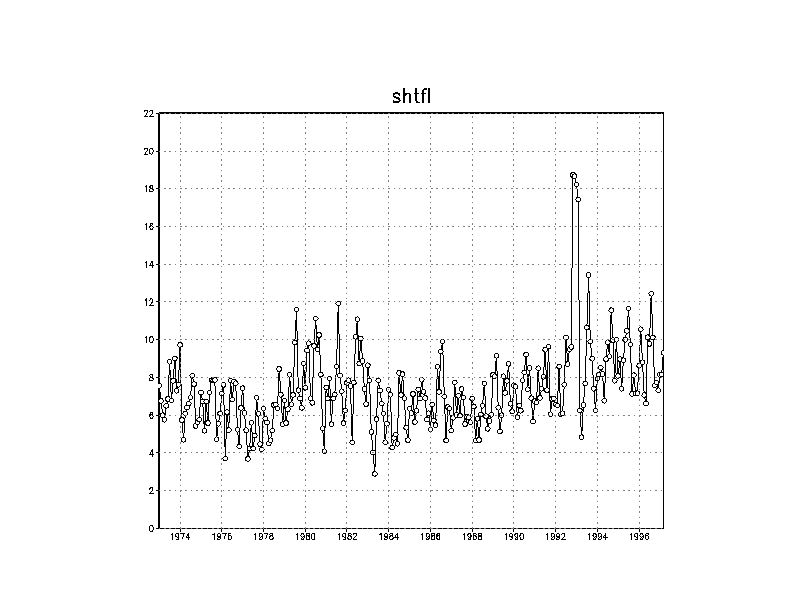
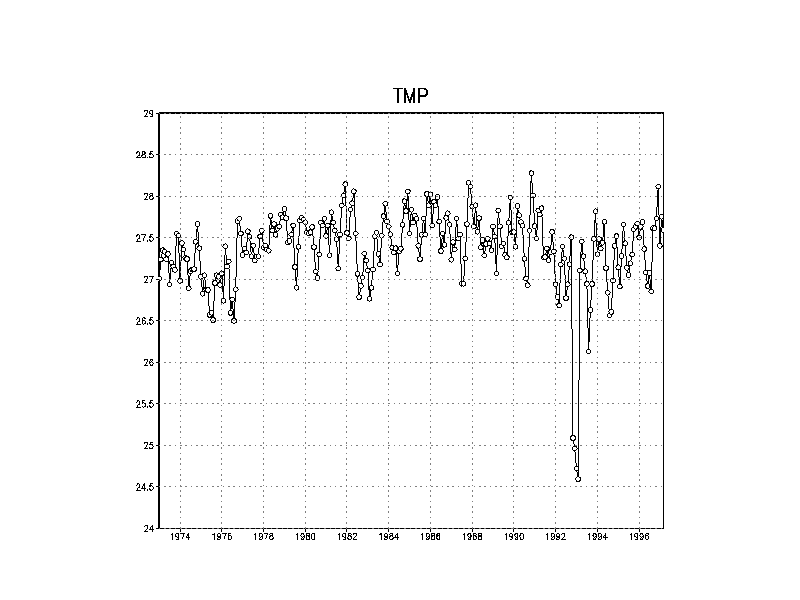
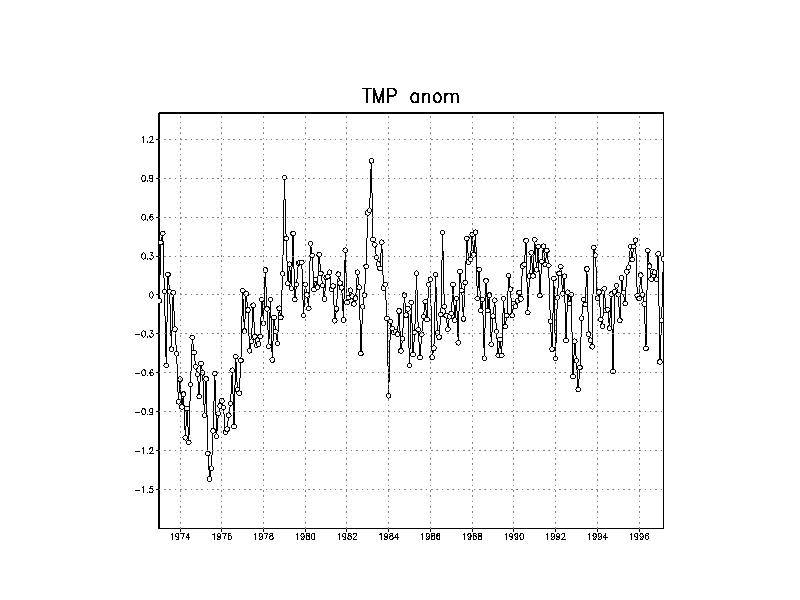
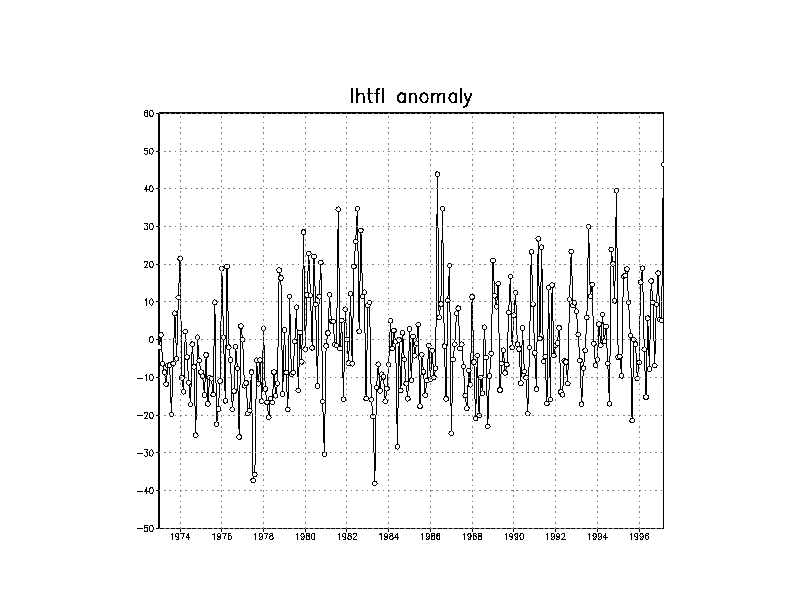
Some analyzed quantities which are affected during TOGA COARE include the 2 m temperature, 925 mb relative humidity, and sensible heat flux. The large deviations during TOGA COARE do not indicate that the reanalyses were bad during TOGA COARE but rather the assimilation system drew to the data during TOGA COARE and drew to the first-guess during the data-poor, non-TOGA COARE months.
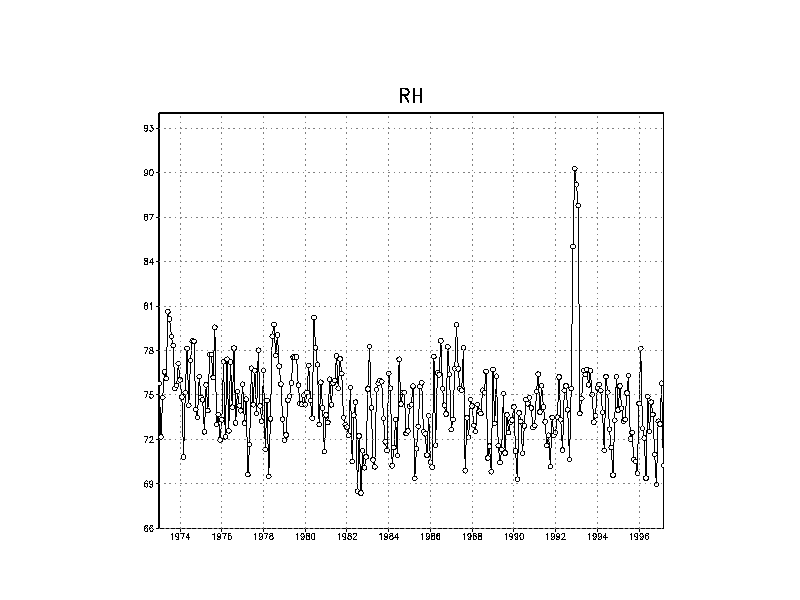
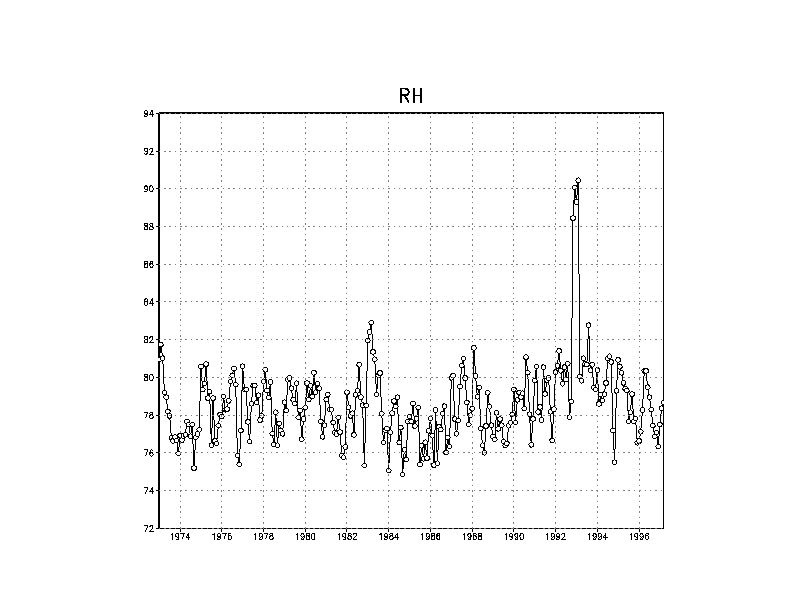
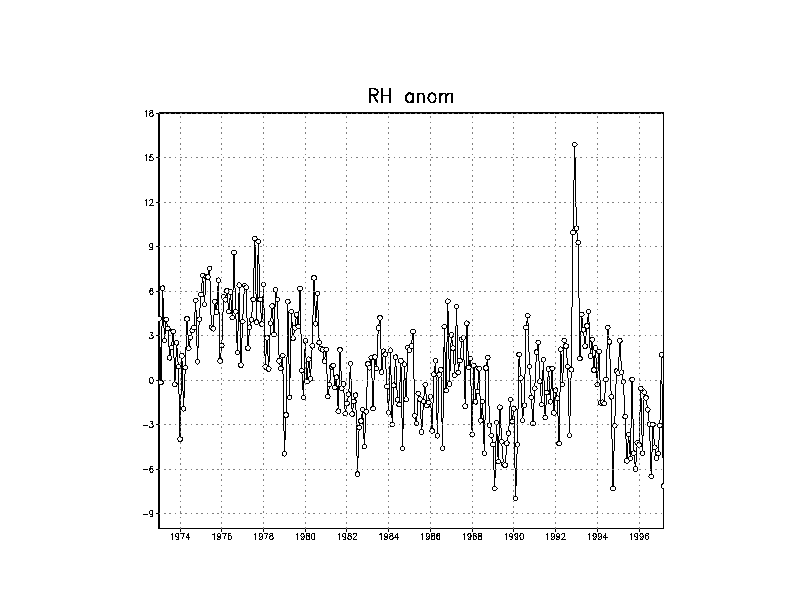
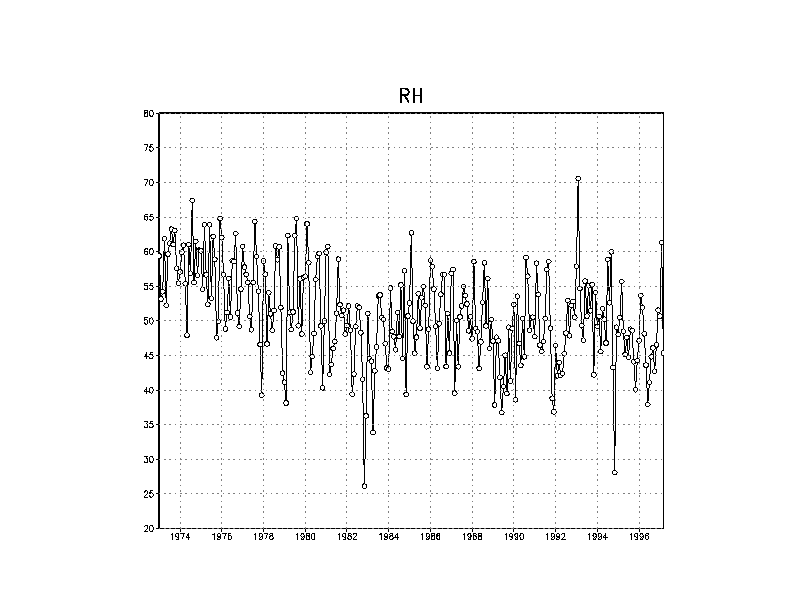
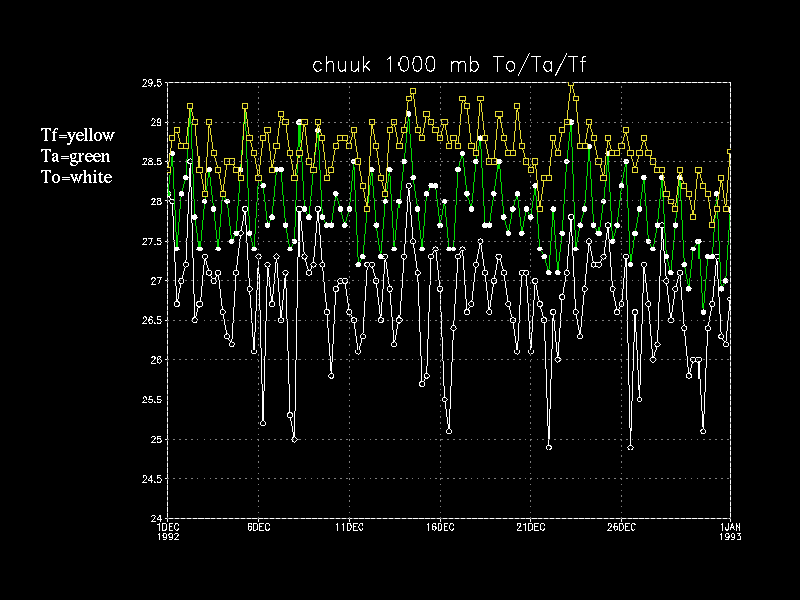
The bias in the relative humidity ("Time Series") appears to be the result of the lower analyzed air temperatures during TOGA COARE. (The GrADS files used to create the following table were produced by Suranjana Saha.)
      Average from 00Z 1 December 1992 to 00Z 1 January 1993

Station		Prs	To	Ta	Tf	qo	qa	qf

Chuuk		1000	26.77	27.89	28.63	18.27	18.45	18.41
Honiar		1000	26.97	27.87	28.72	16.78	16.93	17.00
Kaping		1000	27.63	28.16	28.92	15.20	17.56	17.65
Kavien		1000	27.34	28.26	29.14	18.18	17.80	17.78
Madang		1000	26.61	28.04	29.06	17.20	17.06	17.17
Majuro		1000	27.15	28.34	29.26	18.26	18.39	18.25
Misima		1000	27.28	27.83	28.58	15.83	17.18	17.26
Pohnpe		1000	26.87	27.94	28.73	18.01	18.45	18.44
------		----	-----	-----	-----	-----	-----	-----
mean		1000	27.08	28.04	28.87	17.22	17.73	17.74

Chuuk		925	21.28	21.84	22.29	15.71	15.23	15.23
Honiar		925	22.81	22.52	22.78	12.85	12.95	12.97
Kaping		925	22.23	22.42	22.79	14.04	14.13	14.20
Kavien		925	22.59	22.60	22.96	14.89	14.43	14.33
Madang		925	22.60	23.39	24.30	15.26	16.25	16.34
Majuro		925	21.54	22.35	22.94	15.56	14.73	14.56
Misima		925	21.91	22.31	22.74	13.29	13.03	13.05
Pohnpe		925	21.30	21.93	22.42	15.92	15.31	15.30
------		----	-----	-----	-----	-----	-----	-----
mean		925	22.03	22.42	22.90	14.67	14.51	14.50

To: observed rawindsonde virtual temperature (C)
Ta: Reanalysis virtual temperature
Tf: 6-hour virtual temperature forecast

qo: observed rawindsonde specific humidity (gm/Kg)
qa: Reanalysis specific humidity
qf: 6-hour specific humidity forecast
The TOGA COARE data suggests that the Reanalysis model's boundary layer parameterization needs improvement. Users of Reanalysis must be careful in using quantities that are sensitive to the boundary-layer parameterization. People trying to analyze TOGA COARE using Reanalysis should be careful about computing anomalies or comparisons with non-TOGA COARE months within the planetary boundary layer. In addition, the analyzed temperatures for TOGA COARE appear to 1C (0.4C) too warm compared with observations at 1000 (925) mb. This temperature bias should also bias the relative humidity (not computed) as the specific humidity had no apparent bias.
Fig. 2 Map of TOGA COARE region of interest. From https://www.coare.ucar.edu/news/meetings/wkshp_rpt/report.html.
Fig. 3 The 2 meter temperature (6 hour forecast) from Reanalysis averaged over a 5x5 degree box centered at 155E and the Equator.
Fig. 4 The 925 mb relative humidity from Reanalysis averaged over a 5x5 degree box centered at 155E and the Equator.
Fig. 5 The sensible heat flux from Reanalysis averaged over a 5x5 degree box centered at 155E and the Equator.
Fig. 6 The 1000 mb temperature from Reanalysis averaged over a 5x5 degree box centered at 155E and the Equator.
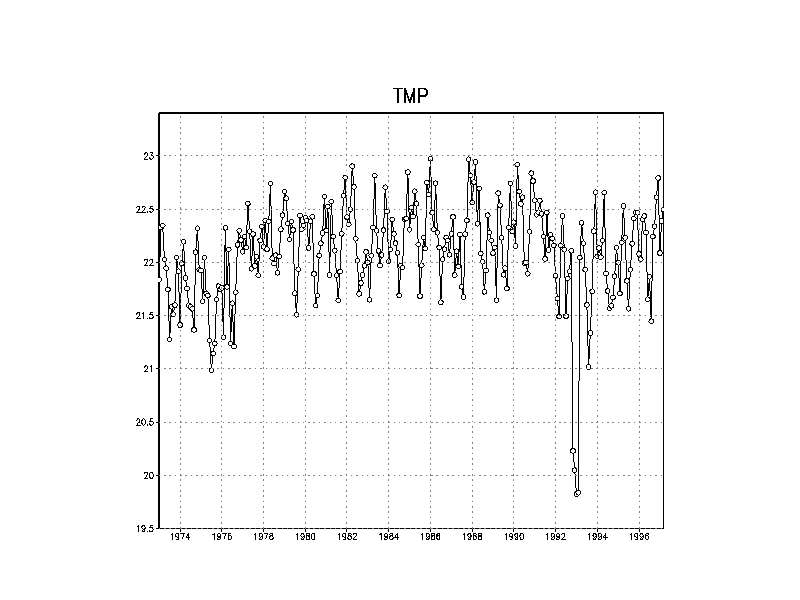
Fig. 7 The 925 mb temperature from Reanalysis averaged over a 5x5 degree box centered at 155E and the Equator.
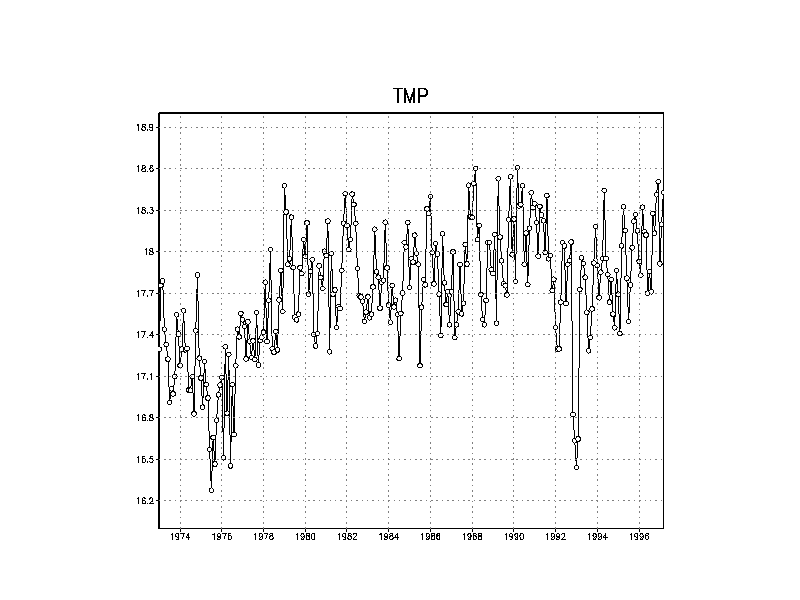
Fig. 8 The 850 mb temperature from Reanalysis averaged over a 5x5 degree box centered at 155E and the Equator.
Fig. 9 The 700 mb temperature anomaly from Reanalysis averaged over a 5x5 degree box centered at 155E and the Equator using a 1979-1995 climatology.
Fig. 10 The 1000 mb relative humidity from Reanalysis averaged over a 5x5 degree box centered at 155E.
Fig. 11 The 925 mb relative humidity from Reanalysis averaged over a 5x5 degree box centered at 155E.
Fig. 12 The 850 mb relative humidity anomaly from Reanalysis averaged over a 5x5 degree box centered at 155E and the Equator using a 1979-1995 climatology.
Fig. 13 The 500 mb relative humidity from Reanalysis averaged over a 5x5 degree box centered at 155E.
Fig. 14 The latent heat flux anomaly from Reanalysis averaged over a 5x5 degree box centered at 155E using a 1979-1995 climatology.
Fig. 15 To (white), Ta (green), Tf (yellow) at 1000 mb for Chuuk.
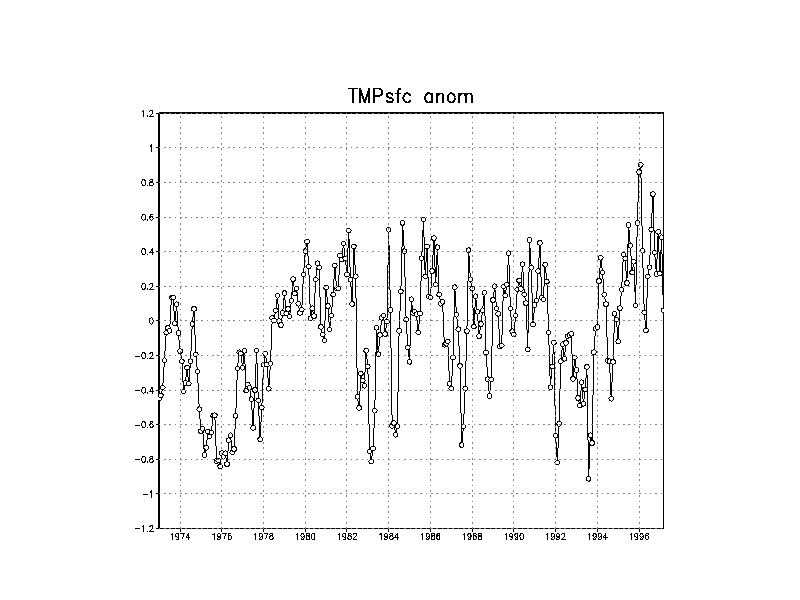
Fig. 16 Skin temperature anomaly from Reanalysis averaged over a 5x5 degree box centered at 155E using a 1979-1995 climatology. The skin temp is the observed SST with a correction for the elevation of the model's surface elevation (not at sea level because of Gibbs-ing.)
comments: wesley.ebisuzaki@noaa.gov