CDAS/Reanalysis uses satellite temperature retrievals (VTPR, TOVS, RTOVS) to help determine the tropospheric and stratospheric temperatures. This is an important source of temperature data over the oceans and in the stratosphere. However, this data is of low accuracy and the forecasts/analyses would be degraded if this data were used everywhere. Consequently a few rules were used to limit the use of the retrieval to where it would be helpful. (This is a tiny part of the QC process.)
- cloud-free and cloudy retrievals were ignored if over land and prs .ge. 100 mb and lat .ge. -60 (ie north of 60S)
- cloudy retrievals were ignored if over land and prs .gt. 100 mb and lat .lt. -60 (ie south of 60S)
- retrieval was ignored if subsurface (caught by other tests?)
The consequences will be illustrated by comparing the
CDAS/Reanalysis (R1) with NCEP/DOE Reanalysis (R2).
R2, like R1, had to run the HDS QC codes on a cray computer.
The R1 project used the operational codes with CDAS options
because the NCEP infrastructure could then be used to
maintain the codes. R2, on the other hand, was designed
to be portable so they ported the HDS QC codes.
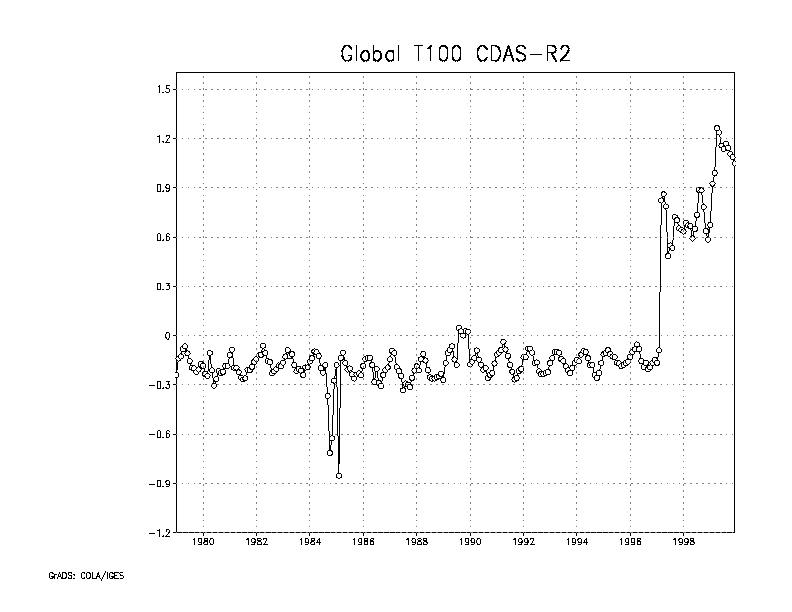
A problem with R1 was discovered by looking at the differences in
monthly temperatures. A particularly problematical level is at 100 mb.
The following plot shows
the difference in the global 100 mb temperature between R1 and R2.
As seen in the plot, R1 shows a sudden relative warming in March 1997 which
corresponds to the start of processing the BUFR data on the Cray.
By the way, the blips in 1985 and 1989 may be caused by R2 having
more input data than R1.
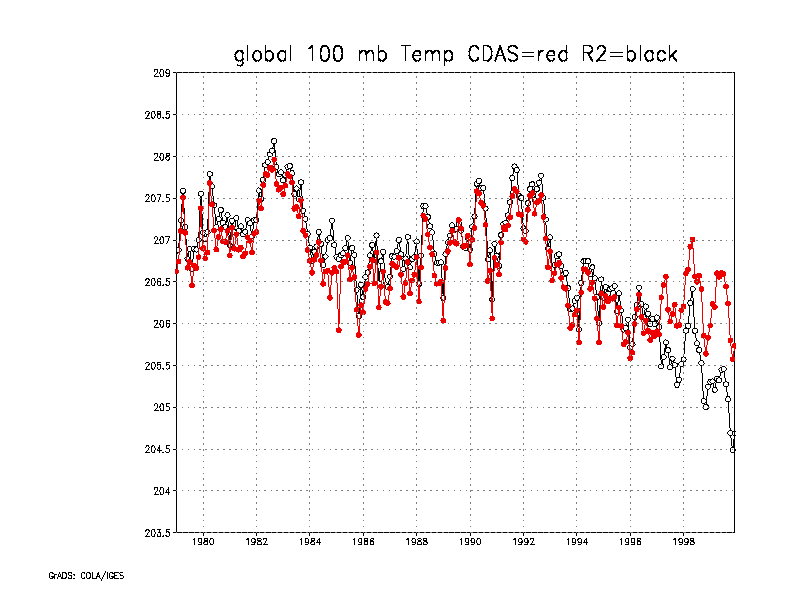
The following plot shows that since March 1997, R2 continued
the cooling trend started in 1992 whereas the cooling trend
levels off in R1.
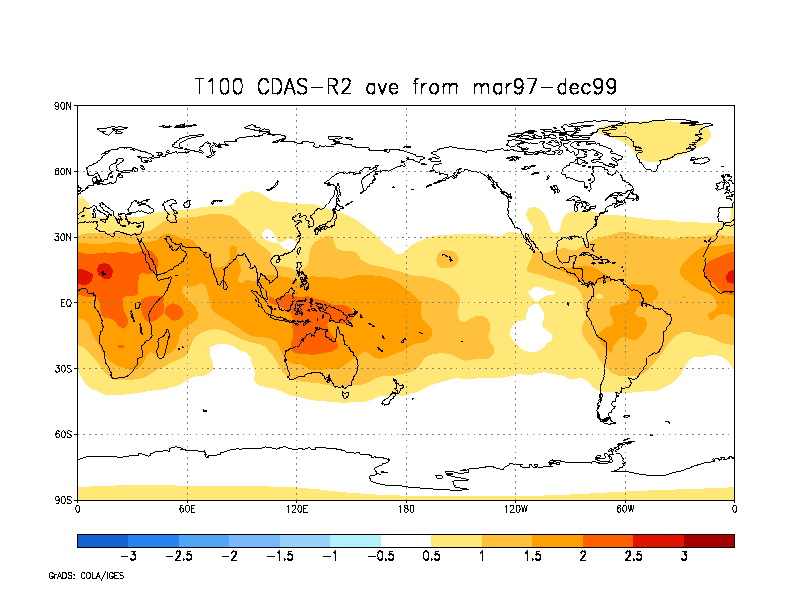
In the following plot, one sees the effect of the on
the T100 is concentrated over the 30S-30N land
masses and to a lessor extent over the 30S-30N oceans.
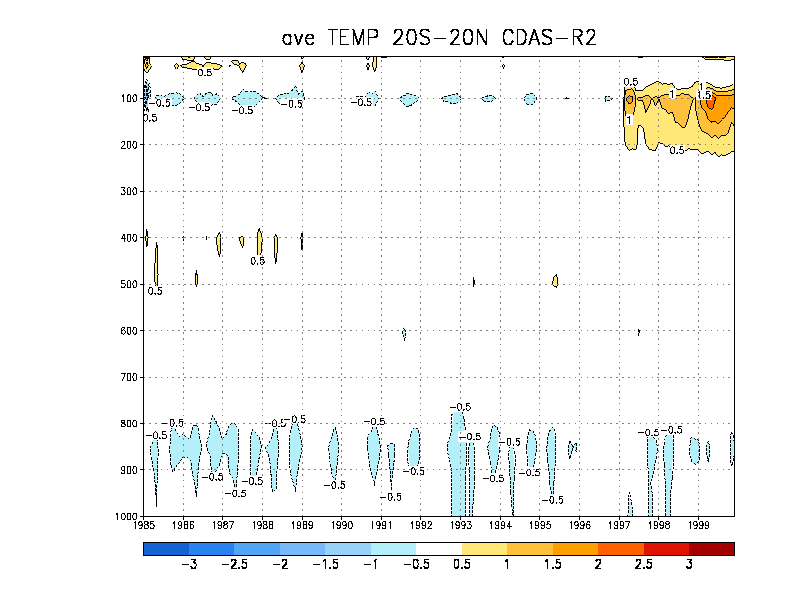
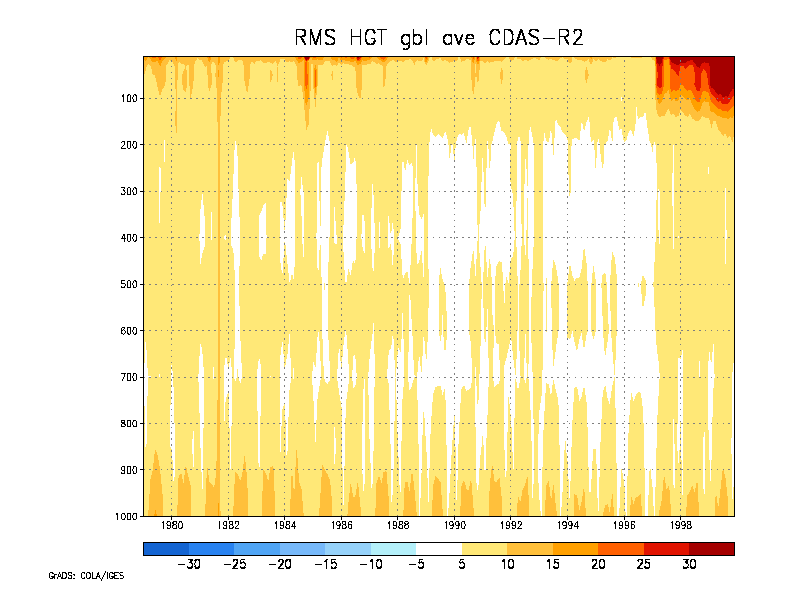
In the following plot, the CDAS-R2 tropical (20S-20N) temperature is
plotted as a function of time and pressure. As seen, the problem
is most severe between 100 and 150 mb. Above 100 mb, the problem
doesn't appear (the filter did not affect temperature retrievals
above 100 mb).
This problem apparently affected the global RMS difference of the
CDAS and R2 monthly mean heights.
There are large deviations between CDAS and R2 above 150 mb as one
would expect. However, even in the troposphere, the variance appears
to increase after March 1997.
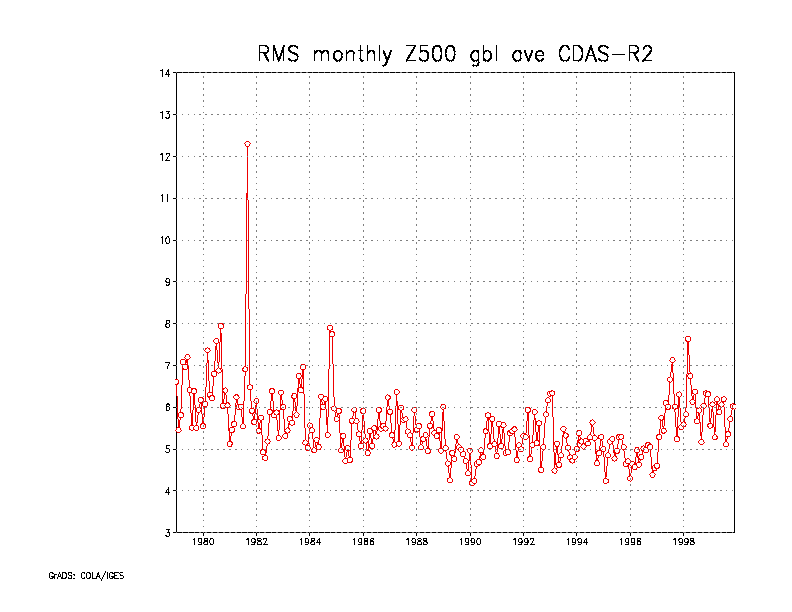
The effect on globally averaged monthly Z500 RMS difference was
approximately 1 m
which is noticeable but not huge (RMS about climatology is on the
order of 30 m). BTW the huge spike on September 1981 corresponds
to a huge anomaly over the poorly observed Southern ocean.
However, a global average can hide many sins; the tropics normally has
a low Z500 variance and the missing filter would not directly
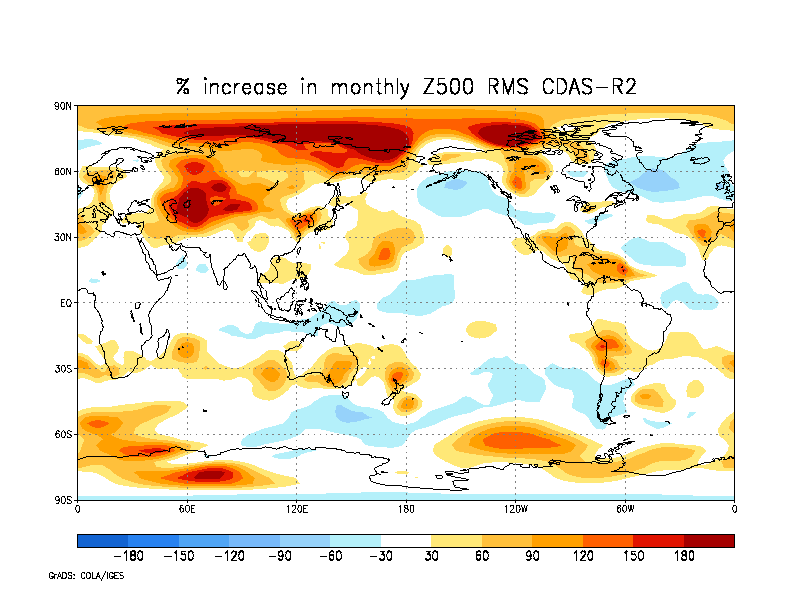
affect the oceanic regions. Below is a plot of the percentage
increase in the Z500 monthly RMS. (Details: used the 1/98-12/99 period
to be representative of the post-mistake RMS and the 1/87-12/96 period to
be representative of the pre-mistake RMS.) As can be seen,
central Asia, the Arctic and parts of Antarctica showed doubling
of the RMS (peak value=497%). Much of the mid-latitude continental regions
showed greater than 30% increase in the monthly RMS.
The affected period is from March 1997 to February 2001. We expect the
rerun to take from four to six months. During this period, we will
continue to run the real-time CDAS. The rerun will eventually get to
real-time and then the rerun system will take over. This means
that the March 1997 - June 2001 (?) will replaced by the rerun
at the appropriate time.
The rerun will have a process ID of 181 in the GRIB header
(vs 180 of the current version) so that one can easily determine
the CDAS "version".
Details on the distribution of the revised CD-ROMs have not been
finalized. Of course, the 2000 CD-ROM will be delayed until
the 2000 has been rerun.
We regret the inconvenience that our mistake will cause the
Reanalysis users. Mistakes will occur in large software projects
and unfortunately our monitoring tool (global/regional data rejection
rates) didn't indicate any problems. The problem could only be
diagnosed by plotting the BUFR data, and unfortunately our
tools were, at that time, not as well developed.
Development of The CDAS/Reanalysis was started in 1991. As one would
expect, CDAS/Reanalysis has been forced to port the code as old
computers have been retired. Here is a brief table of the
major system changes:
comments: wesley.ebisuzaki@noaa.gov
Consequences of Accepting Retrievals over Land
Rerun
The consequences of accepting the TOVS data over land has some
significant impacts. The 500 mb height is
one of the better analyzed fields. Even the monthly Z500 was
affected. (We very strongly suspect the impact was adverse
because of earlier satellite impact tests. It is also
suspicious the Reanalysis forecast skill went down while the
operational skill went
up.) In addition, the effects of no TOVS-Land filter is
very significant in the lower stratosphere temperatures and
the stratospheric heights. Considering that climate monitoring is
an important duty for CDAS;
we need to rerun the affected period.
History
Date Model (MRF), Assimilation (SSI)
BUFR production, quality control
comments
5/1994 CRAY YMP/8 (UNIX)
HDS (s370 clone, MVS)
original configuration, BUFR and QC codes based on operational and modified
for older data types
?/1995 CRAY J/16 (UNIX)
HDS (s370 clone, MVS)
changes for performance
3/1997 CRAY J/16 (UNIX) CRAY C90 and J/16 (UNIX)
moved to operational BUFR and QC codes with CDAS options
5/2000 IBM SP/2 (UNIX)
IBM SP/2 (UNIX)
major port, used operational BUFR and QC codes with CDAS options
Acknowledgements
Dennis Keyser, Bob Kistler and Jack Woollen were key players
in solving this problem.
Suru Saha wrote for us the code used to convert the BUFR TOVS files
to GrADS format.