|
West Region
|
East Region
|
|
|
Latest Text Summary
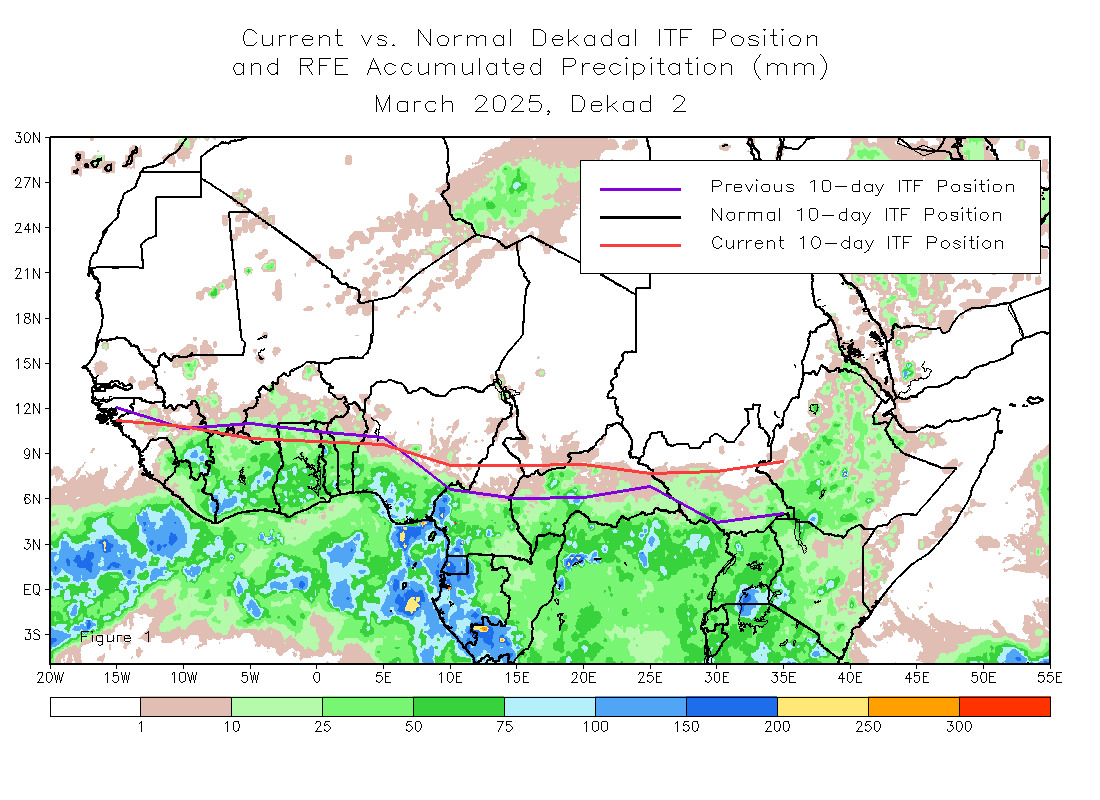
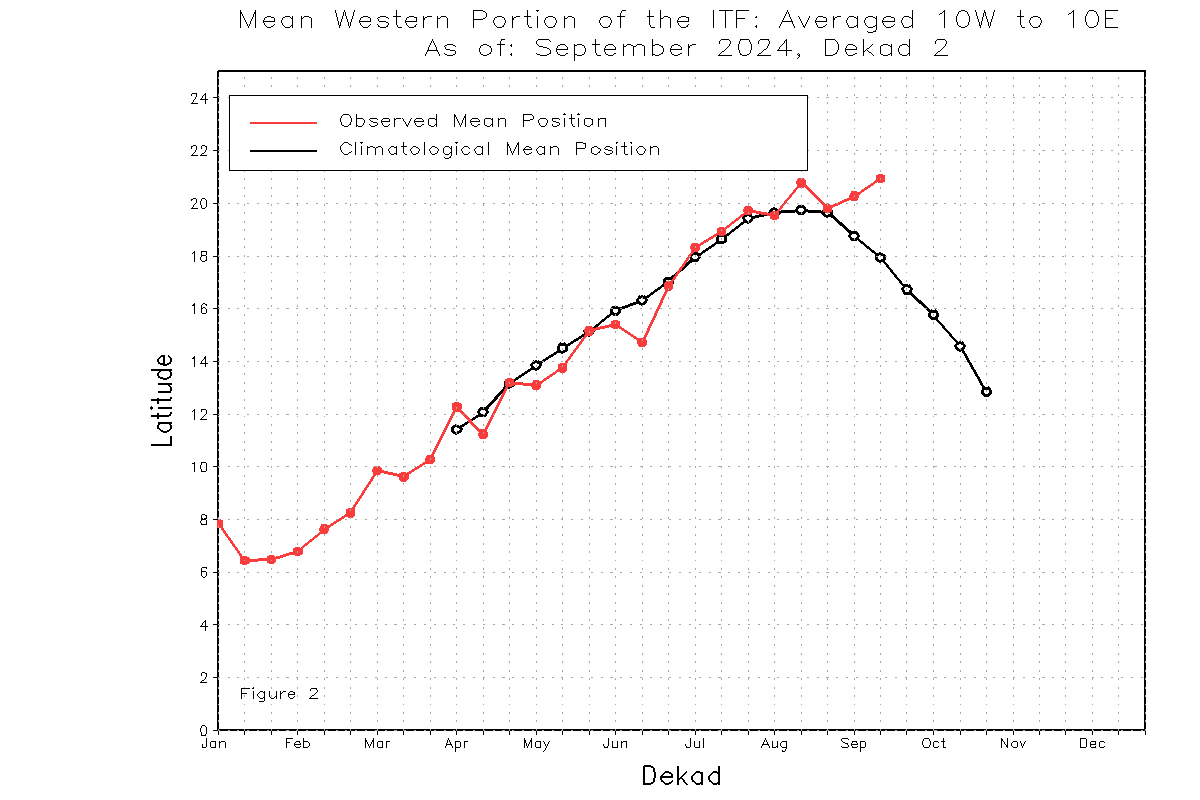
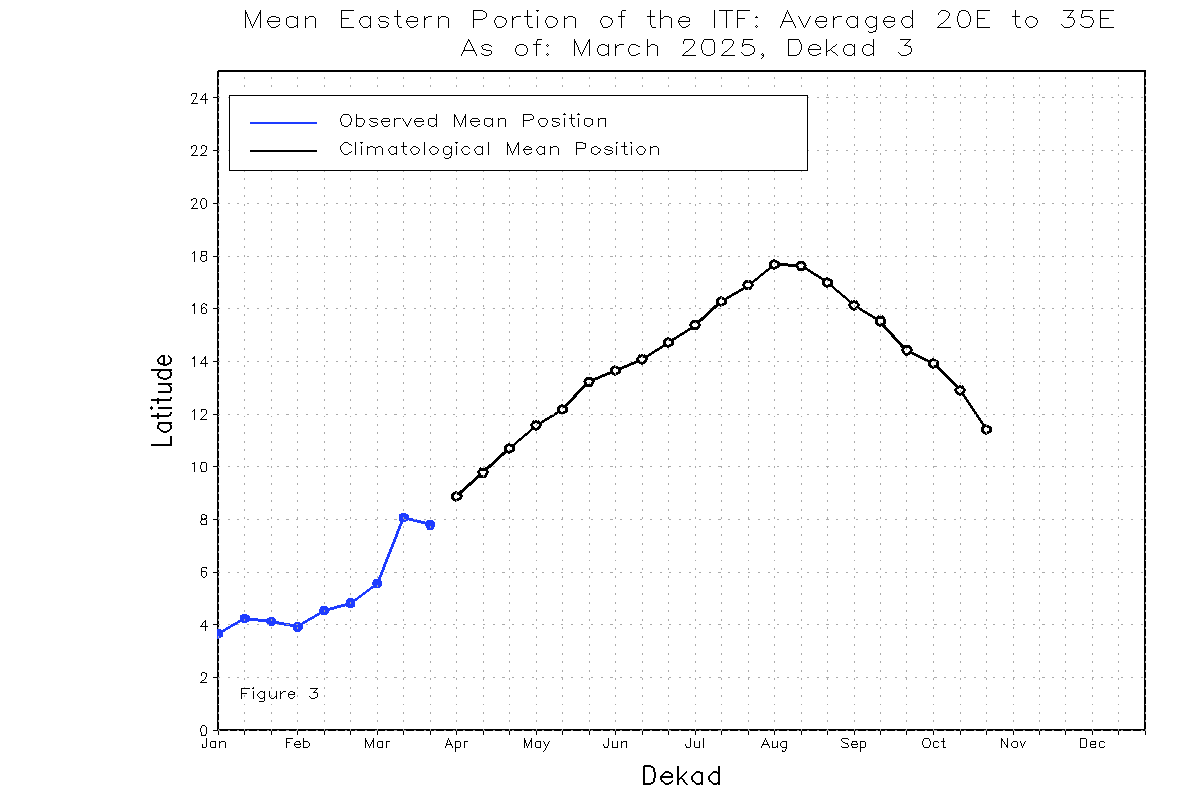
From June 21 to 30, the current Inter-Tropical Front (ITF) moved slightly southward in the western part and northward in the eastern part compared to the previous position. The western (10W-10E) part of the ITF was located approximately at 16.2N, which was below the climatological position by 0.8 degrees. Additionally, in the eastern (20E-35E) region, the ITF was approximately at 13.4N, falling short of the long-term average position by 1.3 degrees. Figure 1 shows the current position of the ITF during the 3rd dekad of June and its previous position during the 2nd dekad of June. Figures 2 and 3 are time series that illustrate the latitudinal positions of the western and eastern portions of the ITF, respectively, along with their seasonal evolutions since April 2025.
| |
Dekad
|
15W
|
10W
|
5W
|
0
|
5E
|
10E
|
15E
|
20E
|
25E
|
30E
|
35E
| |
January 1
|
10.6
|
7.9
|
7.2
|
7.6
|
7.8
|
5.4
|
3.7
|
4.1
|
4.6
|
2.8
|
3.2
| |
January 2
|
10.6
|
8.6
|
7.3
|
7.8
|
7.8
|
5.8
|
4.3
|
4.7
|
4.9
|
3.3
|
4.1
| |
January 3
|
11.5
|
8.6
|
7.9
|
8.2
|
8.5
|
7.2
|
4.7
|
5.2
|
4.9
|
2.7
|
3.7
| |
February 1
|
10.7
|
8.2
|
6.6
|
8.1
|
8.3
|
7.2
|
4.7
|
4.8
|
4.4
|
2.8
|
3.7
| |
February 2
|
11.5
|
10.5
|
9.6
|
9.0
|
8.8
|
7.5
|
4.9
|
5.6
|
5.7
|
3.7
|
3.2
| |
February 3
|
11.5
|
9.4
|
8.2
|
9.2
|
8.9
|
7.2
|
5.8
|
7.0
|
6.6
|
2.8
|
2.9
| |
March 1
|
12.1
|
10.7
|
11.0
|
10.5
|
10.1
|
6.6
|
6.0
|
6.1
|
6.8
|
4.4
|
5.0
| |
March 2
|
11.2
|
10.8
|
10.0
|
9.8
|
9.6
|
8.2
|
8.2
|
8.3
|
7.7
|
7.8
|
8.5
| |
March 3
|
12.6
|
12.1
|
11.6
|
11.6
|
11.2
|
8.8
|
7.3
|
7.5
|
7.7
|
7.3
|
8.7
| |
April 1
|
12.9
|
11.9
|
11.1
|
11.3
|
11.1
|
9.4
|
8.3
|
9.7
|
9.5
|
9.4
|
8.7
| |
April 2
|
13.3
|
12.4
|
12.8
|
11.7
|
11.1
|
8.8
|
8.1
|
9.9
|
9.6
|
9.7
|
9.7
| |
April 3
|
14.5
|
13.7
|
13.5
|
13.1
|
12.1
|
10.7
|
9.9
|
10.3
|
9.9
|
10.0
|
10.2
| |
May 1
|
15.0
|
14.2
|
13.9
|
13.7
|
12.7
|
9.9
|
8.7
|
9.6
|
9.4
|
9.3
|
9.6
| |
May 2
|
13.2
|
13.4
|
14.1
|
13.9
|
13.8
|
12.3
|
11.5
|
10.5
|
9.6
|
10.0
|
11.3
| |
May 3
|
15.1
|
17.8
|
14.5
|
14.7
|
14.2
|
12.7
|
11.6
|
11.6
|
10.8
|
11.8
|
12.6
| |
June 1
|
14.6
|
15.1
|
14.4
|
15.9
|
16.5
|
15.5
|
14.7
|
13.5
|
11.8
|
12.1
|
13.1
| |
June 2
|
15.7
|
17.7
|
15.8
|
15.9
|
18.1
|
14.1
|
13.3
|
12.8
|
12.4
|
13.3
|
14.3
| |
June 3
|
16.2
|
16.1
|
16.5
|
16.4
|
17.5
|
14.3
|
13.5
|
13.1
|
13.1
|
13.2
|
14.0
|
|