[Previous Article]
[Next Article]
Forecasts of Tropical Pacific SST Using a Comprehensive Coupled
OceanşAtmosphere Dynamical Model
contributed by Ming Ji, Arun Kumar and Ants Leetmaa
National Centers for Environmental Prediction,
NOAA, Camp Springs, Maryland
A nonşsimple coupled oceanşatmosphere model has been developed
for use for longşlead climate forecasts in the Coupled Model Project at
NOAA's National Centers for Environmental Prediction (NCEP) (Ji et al.
1994a,b). The NCEP Medium Range Forecast (MRF) atmospheric model is used
with a dynamic Pacific Basin ocean model originated at the Geophysical
Fluid Dynamics Laboratory. The MRF has a reduced spatial resolution and
is tuned for more realistic tropical circulation. The ocean thermal field,
including SST and subsurface temperature, is initialized using an ocean
data assimilation system (Ji et al. 1995). Research has shown that when
observed SST fields are prescribed, this coupled model's atmospheric response
is fairly reliable in the tropics but considerably less so in the extratropics.
The extratropical response is best during the warm or cold phase of ENSO
as reflected in the SST. Much attention has in fact been given to the prediction
of ENSO itselfşşthe tropical Pacific SST anomaly. Such a forecast is presented
here.
In the September and December 1993 issues of this Bulletin,
the expected forecast skill of the coupled model version used in 1993 (called
CMP6) was shown. A horseshoeşshaped spatial pattern of maximum model skill
was noted, with highest equatorial skill near the date line and higher
skill just north or south of the equator than immediately along it to the
east of 165oW. Mean skill for the NiZo 3 and NiZo 4 regions
was shown as a function of season and lead time. The model generally outperformed
persistence by a substantial margin. A seasonal dependence in skill was
noted, where forecasts were affected by a "spring barrier" as
found both in other dynamical as well as statistical predictive models.
Starting with the forecasts presented in the September
1994 issue, the NCEP coupled model was upgraded in several ways, including
a refinement of the flux climatology and the installation of a MOS correction
for the stress anomalies produced by the atmospheric model. Thus, skills
became higher than those cited above; e.g. the high skill horseshoe "thickened"
along the equator, extending farther eastward into the western part of
the NiZo 3 region. Figures 2-1 and 2ş2 of the September 1994 issue show
a comparison of hindcast skills between the newer (called CMP9) and the
previous model versions as a function of lead time for NiZo 3 and NiZo
4, respectively.
During the last few months, a still newer version of the
NCEP model has been developed, called CMP10 (Ji et al. 1996). A major difference
between CMP9 and CMP10 is in the heat flux coupling: CMP9 contained a negative
feedback procedure for coupling the anomalous net heat flux, while CMP10
uses anomaly coupling for the net heat flux forcing. While mean skills
are not as different between CMP9 and CMP10 as they are for CMP6 and CMP9,
CMP10 behaves more realistically for high amplitude SST anomalies. CMP9,
with its negative feedback mechanism, ran the danger of damping strong
ENSO events too much and/or too soon. A still further improved model version,
called CMP12, is soon to be operational.
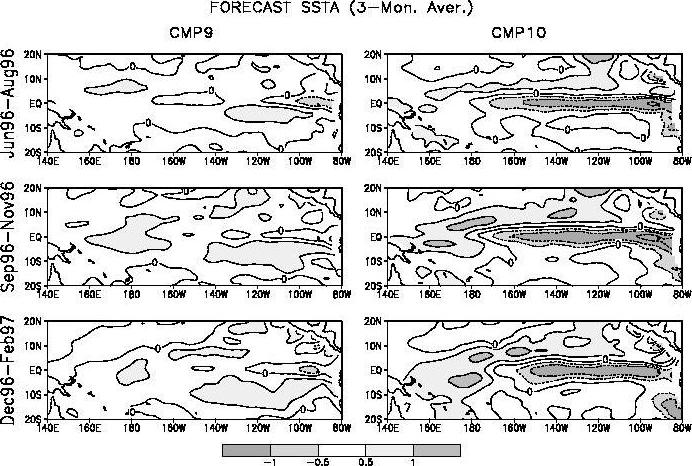
The CMP9 and CMP10 coupled model forecasts for the SST
anomaly field averaged over Jun-Jul-Aug 1996 (no lead), Sep-Oct-Nov 1996
(3 months lead) and Dec-Jan-Feb 1996-97 (6 months lead) are shown in Fig.
1, where the systematic model bias for hindcasts over the 1983ş95 period
has been subtracted. This forecast is actually the mean of an ensemble
of 7 to 11 individual cases, each based on a different one- to twoşweekşapart
initial ocean condition ranging from early April through early June 1996.
The CMP10 forecast suggests a continuation of cool conditions in the eastern
half of the basin through winter, although only in a meridionally narrow
band, and the winter forecast indicates warmth near the dateline. The CMP9
forecast calls for near to slightly above normal SST throughout the period.
Fig. 2 shows the NiZo 3 forecast in the form of a time series for the three
lead times used to form the 3-month forecast averages used in Fig. 1 for
both versions of the model.
The observed anomalous SST and subsurface equatorial temperature
field for the week centered on June 5 (Fig. 3) show a region of negative
subsurface sea temperature anomalies in the eastern tropical Pacific Basin.
Positive subsurface anomalies appear in the western Pacific, which may
presage a return to warm conditions farther east at the surface in 12-18
months (Smith et al. 1995). While near normal SST prevails in the central
basin, mild positive anomalies lie underneath.
Ji, M., A. Kumar and A. Leetmaa, 1994a: A multişseason
climate forecast system at the National Meteorological Center. Bull.
Am. Meteor. Soc., 75, 569ş577.
Ji, M., A. Kumar and A. Leetmaa, 1994b: An experimental
coupled forecast system at the National Meteorological Center: Some early
results. Tellus, 46A, 398-418.
Ji, M., A. Leetmaa and J. Derber, 1995: An ocean analysis
system for seasonal to interannual climate studies. Mon. Wea. Rev.,
123, 460-481.
Ji, M., A. Leetmaa and V.E. Kousky, 1996: Coupled model
forecasts of ENSO during the 1980s and 1990s at the National Meteorological
Center. J. Climate, 9, in press.
Smith, T.M., A. G. Barnston, M. Ji and M. Chelliah, 1995:
The impact of Pacific Ocean subsurface data on operational prediction of
tropical Pacific SST at the NCEP. Wea. Forecasting, 10, 708-714.
Fig. 1. NCEP (formerly NMC) coupled model SST
anomaly forecast fields for Jun-Jul-Aug 1996, Sep-Oct-Nov 1996, and Dec-Jan-Feb
1996-97. Each forecast is an average of three individual month ensemble
averages, which in turn are composed of 2 to 4 individual forecasts from
1 to 2şweekşapart initial SST conditions. Forecasts from both the CMP9
and CMP10 are shown.
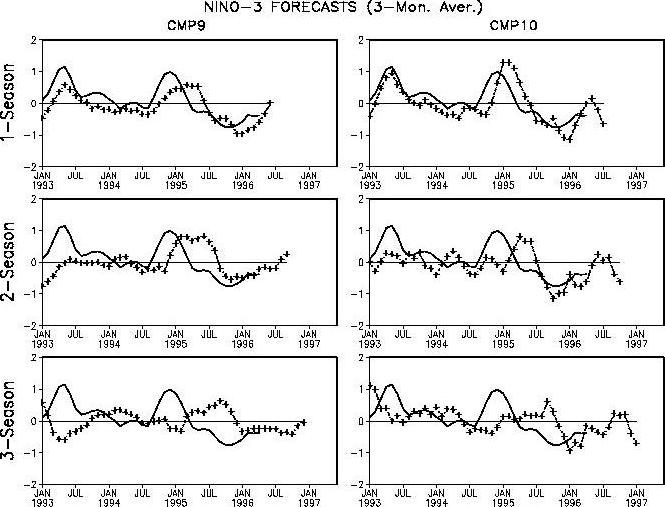
Fig. 2. NCEP coupled model SST anomaly forecast
time series for NiZo 3 for Jun-Jul-Aug 1996, Sep-Oct-Nov 1996, and Dec-Jan-Feb
1996-97 as well as intermediate 3-month periods at 1-month increments.
The broken line in each panel represents the SST anomaly forecast (oC),
and the solid line the observed SST anomaly. The predictions represent
the mean of three ensemble mean forecasts, each for one of the 3 most recent
months, produced by forecasts from two to three individual 1 to 2şweekşapart
initial conditions per month.
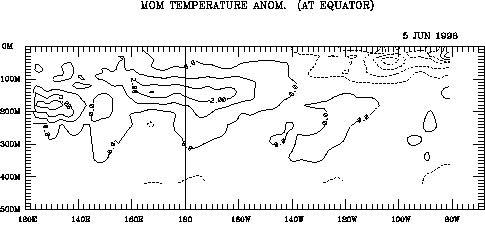
Fig. 3. Equatorial depthşlongitude section of
ocean temperature anomaly with respect to the 1983ş92 mean for the week
centered on May 29, 1996.