[Previous Article]
[Next Article]
Tropical Pacific SST Predictions with a Coupled
GCM
contributed by Ben Kirtman, Bohua Huang, J. Shukla and Zhengxin Zhu
Center for Ocean-Land-Atmosphere Studies, Calverton,
Maryland
The Center for Ocean-Land-Atmosphere Studies (COLA) has
recently developed an anomaly coupled prediction system, using sophisticated
dynamical ocean and atmosphere models, that produces skillful forecasts
of the tropical Pacific sea surface temperature anomaly (SSTA) up to 1.5
years in advance. The details of this coupled prediction system are described
by Kirtman and Schneider (1996) and a brief description of the overall
skill of the 30 hindcast predictions was given in the March 1995 issue
of this Bulletin. The atmospheric component is the COLA atmospheric general
circulation model (AGCM; Kinter et al. 1988) that includes a state-of-the-art
land surface model (Xue et al. 1991) and physical parameterizations of
radiation, convection, and turbulence. The AGCM is a global spectral model
that is horizontally truncated at triangular wavenumber 30 and has 18 unevenly
spaced sigma levels in the vertical. The oceanic component is a Pacific
basin version of the Geophysical Fluid Dynamics Laboratory (GFDL) ocean
model (Pacanowski et al. 1993). In the ocean model there are 20 levels
in the vertical with 16 levels in the upper 400 m. The zonal resolution
is 1.5o longitude and 0.5 o latitude between 20oN
and 20 oS. Further details of the ocean model are provided in
Huang and Schneider (1995).
We have separately tested the ocean and atmosphere component
models in order to evaluate their performance when forced by observed boundary
conditions and improvements have been made that are also incorporated into
the coupled prediction system. The effects of atmospheric model zonal wind
stress errors have been ameliorated by using the zonal wind at the top
of the boundary layer to redefine the zonal wind stress at the surface
(Huang and Shukla 1996). We have also developed an iterative procedure
for further adjusting the zonal wind stress, based on the simulated SSTA
errors (Kirtman and Schneider 1996), that improves initial conditions for
coupled forecasts (Kirtman et al. 1996).
The NiZo 3 SSTA root mean squared error (RMSE) and correlation
as a function of forecast lead time was shown in the March 1995 issue of
this Bulletin. These two verification measures are computed with respect
to the observed SSTA. The correlation in the NiZo 3 region remained above
0.6 for lead times of up to 12 months and was larger than that of the persistence
forecast for all lead times greater than 3 months.
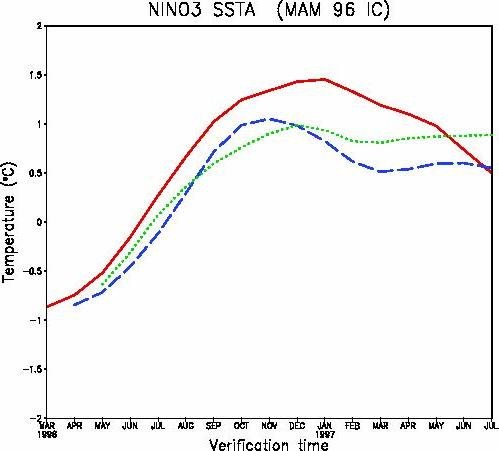
Figure 1 shows the NiZo 3 time series of the predicted
SSTA for three forecasts initialized on the first day of March, April and
May of 1996, respectively. Each forecast is run through July 1997. All
three forecasts show a consistent evolution with relatively cool SST in
boreal spring of 1996 followed by a fairly rapid transition to relatively
warm temperatures in boreal winter of 1996-97 that persists through 1997.
The predicted SSTAs are near normal during boreal summer of 1996. The April
and May 1996 forecasts plateau during boreal winter 1996-97 with some weakening
during spring, but remain warm through July 1997. The March 1996 forecast
has somewhat stronger anomalies during boreal winter 1996-97 and shows
a more rapid decline during spring and summer of 1997. The warming trend
through boreal winter 1996-97 seen in all three predictions is consistent
with the six forecasts initialized in September 1996 through February 1996
shown in the December 1995 and March 1996 issues of this Bulletin.
The horizontal structure of the ensemble mean (average
of all three forecasts) SSTA for boreal fall of 1996, winter 1996-97 and
spring of 1997 are shown in the three panels of Fig. 2. The spatial structure
and amplitude of the predicted SSTAs for fall 1996 and winter 1996-97 are
remarkably similar to forecasts initialized three months earlier shown
in the March 1996 issue of this Bulletin. The ensemble averaged forecast
indicates positive SSTA beginning in the boreal fall of 1996 with anomalies
in excess of 1EC over much of the central Pacific between 5ES-5EN during
winter 1996-97. By spring 1997 the ensemble mean indicates some weakening
of the positive SSTA. Given the consistency of the forecasts initialized
over the previous nine months, our confidence is relatively high that there
will be a warm ENSO event during the boreal winter of 1996-97.
Acknowledgments: This research is part of a larger
group effort at COLA to study the predictability of the coupled system.
Many members (D. DeWitt, M. Fennessy, J. Kinter, L. Marx and E. Schneider)
of this group have provided invaluable advice. L. Kikas assisted in managing
the data. This work was supported under NOAA grant NA26ŁGP0149 and NA46ŁGP0217
and NSF grant ATMŁ93Ł21354.
Huang, B., and J. Shukla, 1996: An examination of AGCM
simulated surface stress and low level winds over the tropical Pacific
ocean. Mon. Wea. Rev., 124, in press.
Huang, B., and E. K. Schneider, 1995: The response of
an ocean general circulation model to surface wind stress produced by an
atmospheric general circulation model. Mon. Wea. Rev., 123,
3059-3085.
Kinter, J. L. III, J. Shukla, L. Marx and E. K. Schneider,
1988: A simulation of winter and summer circulations with the NMC global
spectral model. J. Atmos. Sci., 45, 2486Ł2522.
Kirtman, B. P., J. Shukla, B. Huang, Z. Zhu, E. K. Schneider,
1996: Multiseasonal predictions with a coupled tropical ocean global atmosphere
system. Mon. Wea. Rev., 124, in press.
Kirtman, B. P. and E. K. Schneider 1996: Model based estimates
of equatorial Pacific wind stress. J. Climate, 124, 1077-1091.
Pacanowski, R. C., K. Dixon, A. Rosati, 1993: The GFDL
modular ocean model users guide, version 1.0. GFDL Ocean Group Tech. Rep.
No. 2.
Reynolds, R.W., and T. M. Smith, 1995: A high resolution
global sea surface temperature climatology. J. Climate, 8,
1571Ł1583.
Xue, Y., P. J. Sellers, J. L. Kinter III, and J. Shukla,
1991: A simple biosphere model for global climate studies. J. Climate,
4, 345Ł364.
Fig. 1. Time evolution of the NiZo 3 SSTA forecast.
The solid (dashed) [dotted] curve corresponds to the forecast initialized
in March (April) [May ] of 1996.
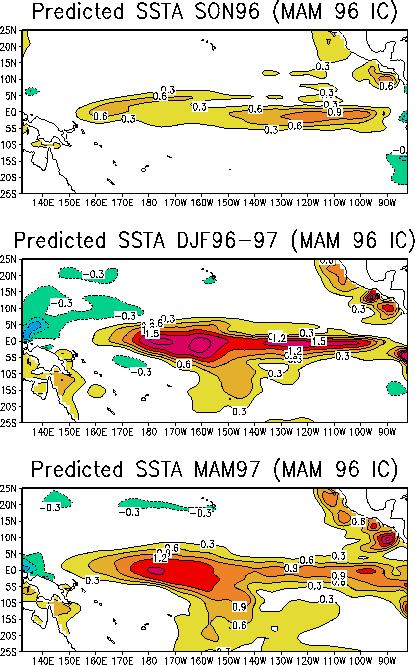
Fig. 2. The ensemble mean SSTA. The top panel
shows the predicted ensemble mean averaged over Sep-Oct-Nov 1996, the middle
panel Dec-Jan-Feb 1996-97, and the bottom panel Mar-Apr-May 1996-97.