[Previous Article]
[Next Article]
Forecasts of Tropical Pacific SST Using a Dynamical
Ocean Model Coupled to a Statistical Atmosphere
contributed by Magdalena Balmaseda1, David Anderson2
and Michael Davey3
1European Centre for Medium Range Weather Forecasts, Reading, UK
2Atmospheric, Oceanic and Planetary Physics, Oxford University, UK
3Hadley Center, UK Meteorological Office, Bracknell, UK
An intermediate dynamical oceanŁempirical atmosphere coupled
model is currently being used in the Atmospheric, Oceanic and Planetary
Physics Department at the University of Oxford to predict sea surface temperature
(SST) anomalies in the tropical Pacific. The model, whose detailed description
and performance are documented in Balmaseda et al. (1994), consists of
a tropical Pacific ocean model with two active layers coupled to a statistical
model that relates SST anomalies, heat content (HC) anomalies, and surface
wind stress anomalies. The anomalies are relative to monthly climatology.
The ocean model is first forced by observed wind stress (based on data
from Florida State University [FSU]; Goldenberg and O'Brien 1981) during
the period 1961Ł91. The output of this simulation run is used to build
the statistical atmospheric model, which assumes that the wind stress anomalies
are a linear function of the first 6 principal components (PCS) of the
model SST and HC anomalies, with seasonal variation.
The hindcast skill of the model has been tested using
a set of 252 hindcast experiments, each of 24 months duration, with initial
conditions taken from the simulation run at one month intervals during
the period 1970Ł91. The correlation skill (sk) and root mean square error
(RMSE) for hindcasts of SST anomalies versus observed values have been
calculated using ensemble means of hindcasts from three consecutive months.
The model shows good reliability in regions of the central
equatorial PacificŁŁin particular, in the regions NiZo 3 and Eq2 (130Ł170oW,
5oNŁ5oS). Figures 7Ł1a and 7-1b in the December,
1994 issue of this Bulletin show the correlation and RMSE skills, respectively,
for model hindcasts of the SST anomalies in the NiZo 3 and Eq2 regions.
Correlation skill at 6 months lead is about 0.59 for NiZo 3 and about 0.62
for Eq2, while at 12 months lead they are about 0.50 and 0.55, respectively.
The error in the initial conditions is quite high, because only wind information
is used to obtain the model initial state.
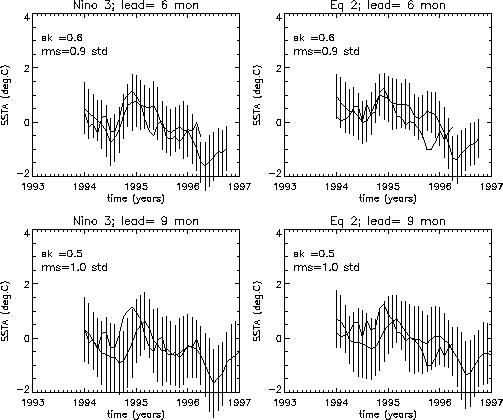
Figure 1 shows current forecasts of SST anomalies for
6 and 9 month lead times. The vertical bars are two RMSE in length, based
on the 1970Ł91 period. The forecasts for NiZo 3 (left column) and Eq2 (right
column) at both lead times show considerable recovery of the SSTs relative
to the strongest negative anomalies. The observations have also recovered
somewhat from their early winter 1995-96 lows. The recovery in the SST
forecasts follows minimum values that are lower than the minima in the
observed anomalies, especially for NiZo 3. At both lead times the forecast
anomalies have had the correct sign and have lagged the observed anomalies.
The last four individual forecasts, with initial conditions
from January to April 1996, are shown in Fig. 2 for NiZo 3 and Eq2. The
thick solid lines are the observed SST anomalies, and the thin solid lines
show the control run from which the initial conditions are taken. The trajectories
of the individual forecasts are in good agreement for both NiZo 3 and Eq2,
and indicate gradual warming from the cool model values of the first quarter
of the 1996.
Balmaseda, M.A., Anderson, D.L.T. and M.K. Davey, 1994:
ENSO prediction using a dynamical ocean model coupled to statistical atmospheres.
Tellus, 46A, 497-511.
Goldenberg, S.D. and J.J. O'Brien, 1981: Time and space variability of tropical Pacific wind stress. Mon Wea. Rev., 109, 1190Ł1207.
Fig. 1. Oxford coupled model forecasts of the
SST anomalies in the NiZo 3 (left column) and Eq2 (130-170oW;
right column) regions for 6 and 9 month leads. The latest forecast was
initialized from April 1996 data. The vertical bars represent the RMSEŁbased
confidence intervals for the relevant lead time, based on predictions for
1970Ł91. Each prediction is the average of forecasts from three consecutive
months. Correlation skill (sk) and RMSE values (fractions of observed standard
deviation, or std) are indicated in each panel. Thick lines indicate observed
SST anomalies.
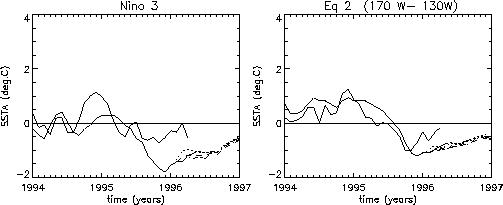
Fig. 2. Individual initial condition predictions
of SST anomalies in the NiZo 3 and Eq2 regions made with the Oxford coupled
model. The initial conditions are for January (dotted line), February (dashed
line), March (dashŁdot), and April (dash-dot-dot-dot) 1995. Each prediction
has a duration of 12 months. The ocean initial conditions (thin solid line)
are produced by forcing the ocean model with observed FSU winds and also
by sub-surface assimilated data. The thick solid line shows the observed
SST anomalies.