[Previous Article]
[Next Article]
Multiple Regression and Discriminant Analysis Predictions
of Jul-Aug-Sep 1996 Rainfall in the Sahel and Other
Tropical North African Regions
contributed by Andrew Colman1, Michael Davey1,
Michael Harrison2 and David Richardson2
1Ocean Applications Branch 2NWP Division
UK Meteorological Office, Bracknell, United
Kingdom
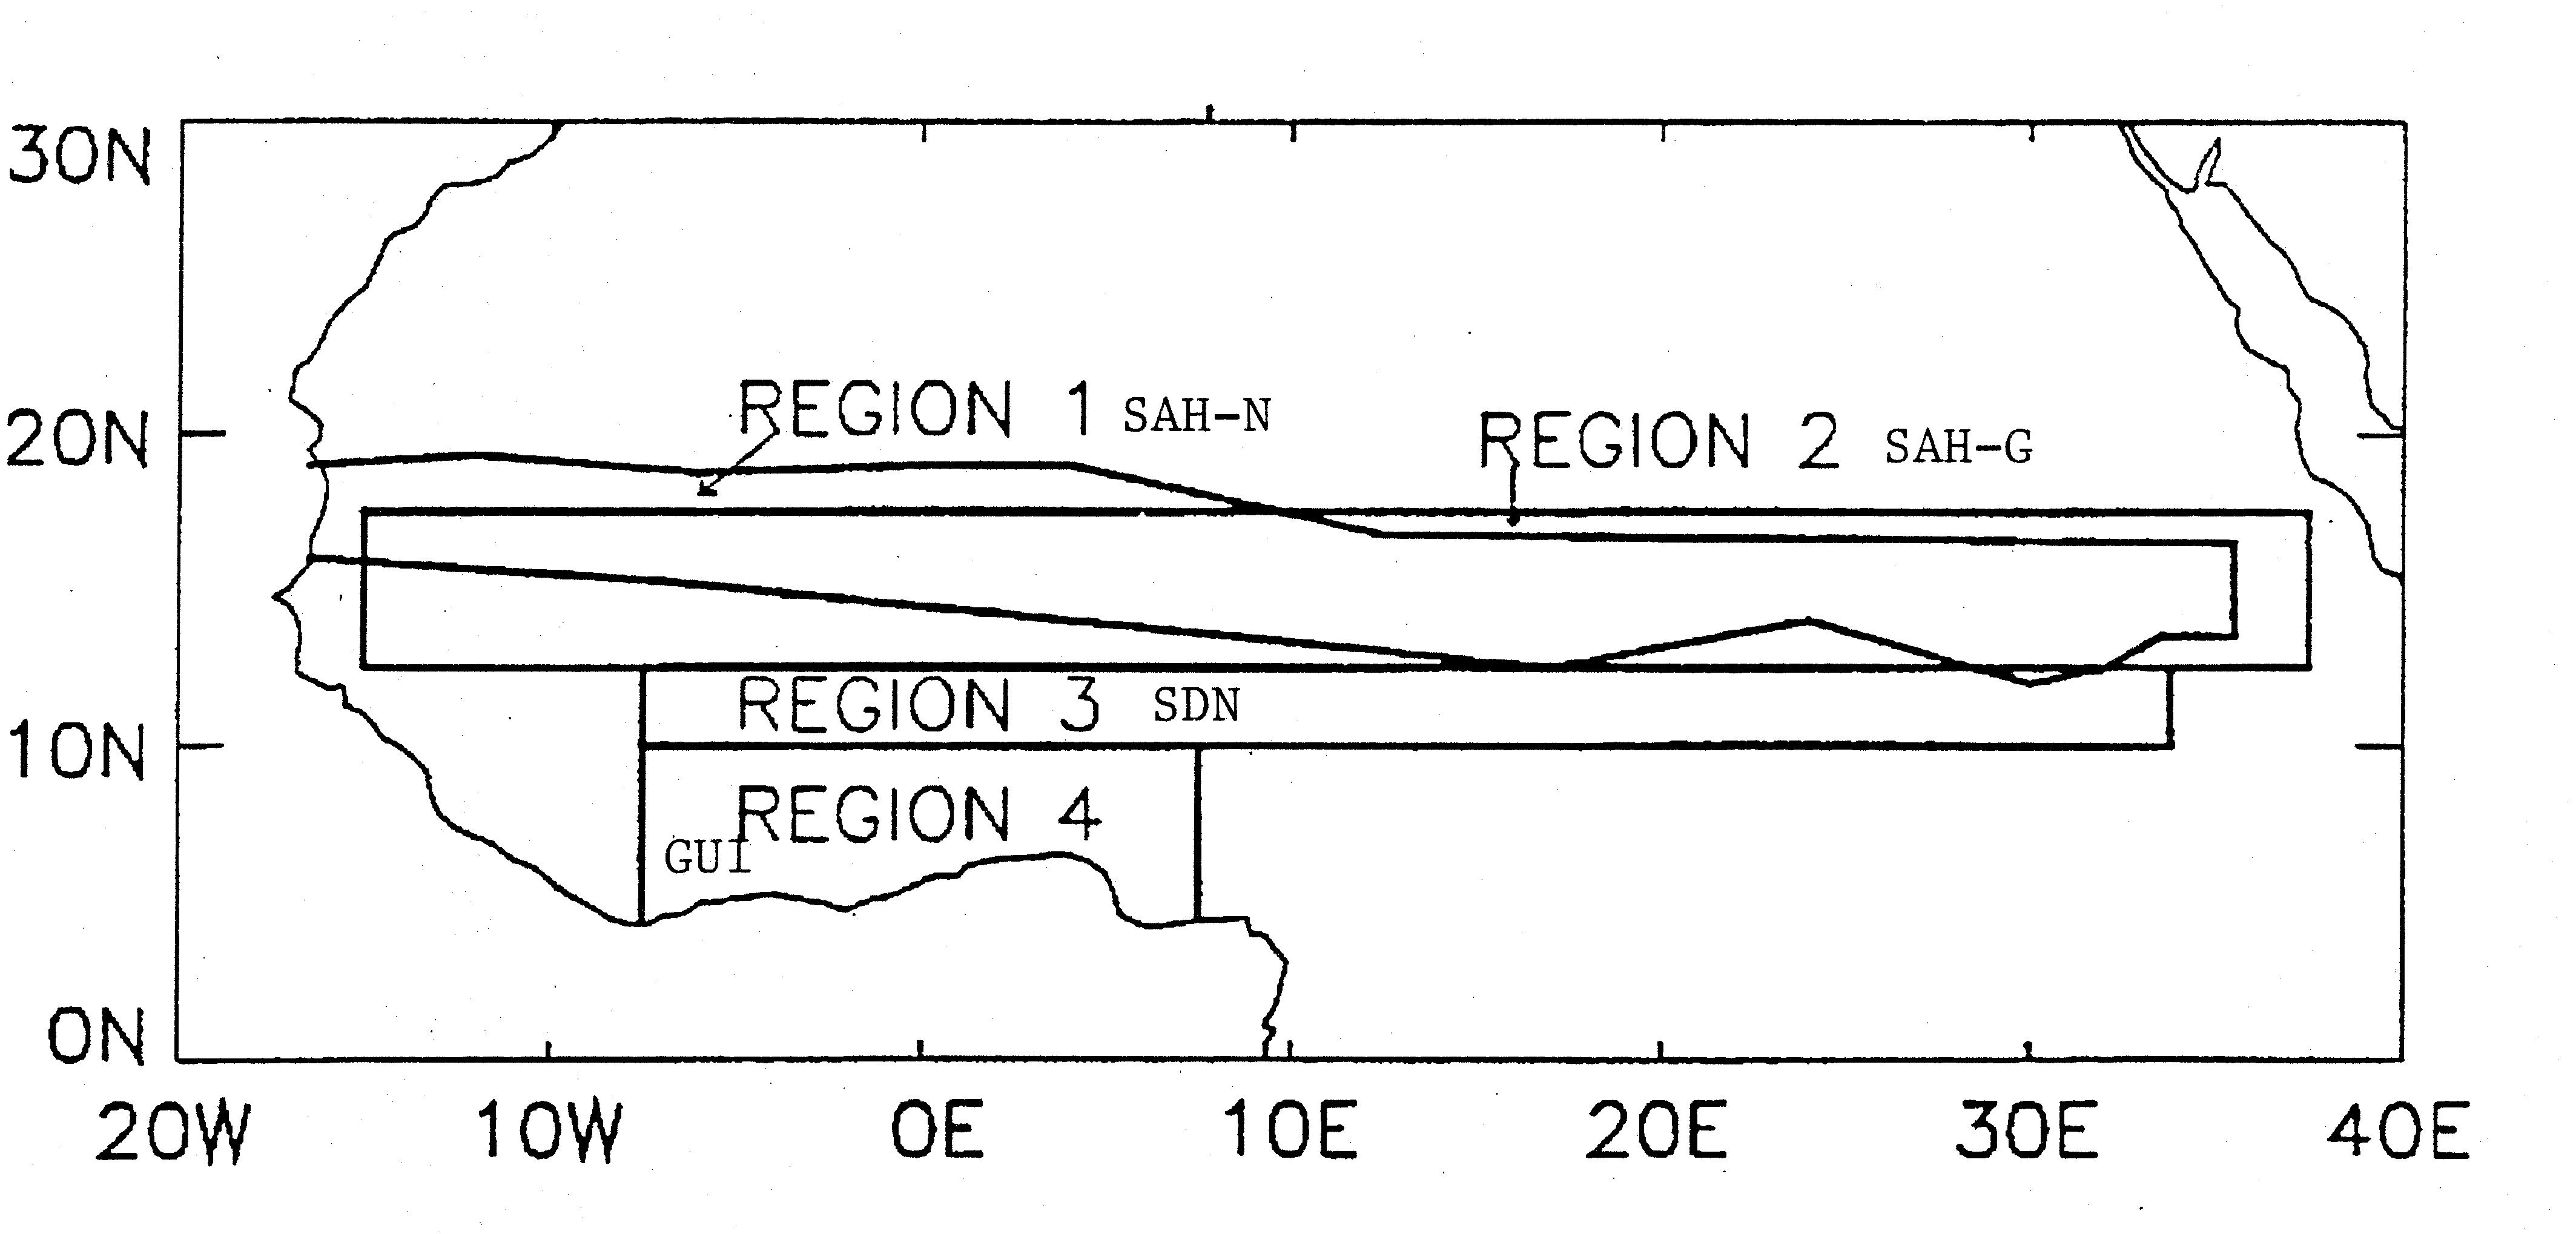
The Hadley Centre of the UK Meteorological Office has produced experimental forecasts for the JulŁAugŁSep rainfall in tropical North Africa using multiple linear regression and linear discriminant analysis since 1986 (see Ward and Folland 1991 or the March 1993 issue of this Bulletin for information on these two statistical methodologies). Specifically, forecasts have been experimentally issued for the Sahel region of Africa since 1986, based preliminarily on MarchŁApril SST predictors (for an early May forecast) and then updated with the availability of MayŁJune SST (for an early July forecast) for a more accurate zeroŁlead forecast for JulyŁSeptember rainfall. In 1992 the forecasts were expanded to cover four regions located from the Sahel southward to the Guinea Coast (Fig. 1).
African rainfall forecasts are made here using three distinct
components of SST forcing as predictors. The first is an interŁhemispheric
contrast (IHC) in SST anomaly. A warm Northern Hemisphere relative to Southern
Hemisphere tends to accompany increased rainfall in the Sahel and Soudan.
The second predictor is the local SST anomaly in the south tropical Atlantic,
which accompanies more rain in the Guinea Coast region, less in the Sahel,
and slightly less in the Soudan. Rainfall in the Guinea Coast region is
best predicted, however, by the SST anomaly immediately adjacent to the
west coast of Africa south of the Guinea Coast (Ward et al. 1993). The
third SST predictor is related to ENSO, as the warm phase of ENSO accompanies
reduced rainfall in the Sahel and especially the Soudan. The importance
of each of these SST predictors (which are conveniently expressed as EOFs
of the SST fields over various regions) for rainfall in each of the four
regions is shown by standardized regression coefficients in multiple regression,
which are discussed in the June 1993 issue of this Bulletin.
Independent forecast skill was estimated by developing
multiple regression coefficients on a different period than that used for
hindcast testing. Table 1 shows the skill of hindcasts for 1901Ł45 made
using a regression model based on 1946Ł92 data, and vice versa, for two
of the target regions.
Table 1. Independent hindcast skill (temporal correlation between forecasts and observations) in forecasting two of the four North African rainfall regions. The skill of persistence forecasts is shown in parentheses.
| Forecasting | Forecasting | |
|
1901-45 |
1946-92 |
|
|
Using 1946-92 |
Using 1901-45 |
|
|
Region |
Regression Model | Regression Model |
|
--------- |
--------- |
--------- |
|
SAH-N |
0.51 (0.10) |
0.68 (0.66) |
| GUI | 0.44 (0.02 | 0.53 (-0.33) |
The correlations are fairly good, suggesting usable forecast
skill. The high persistence skill for the SAHŁN region in the later period
arises because of the marked interdecadal component of variability, with
relative wetness before the early 1970s versus relative dryness after that
time.
The accuracy of the SAHŁN forecasts issued since their
inception in 1986 has generally been within one quint except for 1988 when
there was a sudden development of La Nina after the forecast was made and
the forecast was much too dry ("very dry" versus a verification
of "wet"), and for 1994 when the forecast was again too dry.
In early work with an AGCM, it was found the model could
simulate wet and dry Sahel years, driven by observed SSTs (Folland et al.
1991). Following a more recent period during which other UKMO models were
unable to repeat that success, further study using ensemble simulations
showed that the model rainfall anomaly over the Sahel region does indeed
respond appropriately to significant SST forcing, as during ENSO episodes
such as 1986-87 (warm), 1987-88 (rapid cooling), or 1988-89 (cold). For
example, almost twice as much rain was correctly forecast in 1988 as in
1987, with no overlap of any ensemble members between the two years. Further
detail on these findings are shown in the June 1995 issue of this Bulletin.
RealŁtime AGCM forecasts have been run with some success
for the last several years, using persisted SST anomalies from May to forecast
Jul-Aug-Sep northern African rainfall. The model forecasts have been considered
in conjunction with the multiple regression and discriminant analysis forecasts
even though the expected skill of the latter two are better known.
In MarchŁMay 1996, SST is above the 1961-90 average over
most of the globe. Anomalies are particularly positive in the tropical
south east Atlantic region (10E-20ES, 20EW-African coast), which usually
favors below average seasonal rainfall in the Sahel and Soudan (regions
1, 2 and 3) and above average rainfall in the Guinea coast region (region
4). In March the average SST anomaly in the Southern Hemisphere was 0.24EC
warmer than in the Northern Hemisphere, but this contrast decreased to
0.06EC in April. This interhemispheric contrast also favors drier than
average conditions in regions 1, 2 and 3. Historically, warm SST anomalies
in the central tropical Pacific are weakly associated with below normal
rainfall in the Sahel. Central Pacific anomalies are presently small, so
the effect of this factor is insignificant.
We expect that the 1996 seasonal rainfall in all four
forecast regions will be particularly sensitive to any changes in the substantial
south east Atlantic SST anomalies through the forecast period.
When linear discriminant analysis and linear multiple
regression are applied to the values of the MarchŁApril SST predictors
summarized above, resulting rainfall forecasts are as shown in Tables 2
and 3, respectively. To reduce noise, forecasts made using models with
two different training periods and (for Sahel, Soudan) two different sets
of predictors are averaged.
Table 2. Probability of July through September 1996 rainfall in each of five equiprobable (with respect to 1941Ł85 data) categories in four regions in tropical North Africa, according to linear discriminant analysis prediction models.
|
Very |
Very |
|||||
|
Dry |
Dry |
Avg |
Wet |
Wet |
||
|
1 |
SAH-n |
0.45 |
0.37 |
0.14 |
0.04 |
0.00 |
|
2 |
SAH-G |
0.52 |
0.30 |
0.11 |
0.05 |
0.03 |
|
3 |
SDN |
0.66 |
0.16 |
0.04 |
0.08 |
0.06 |
|
4 |
GUI |
0.01 |
0.04 |
0.23 |
0.36 |
0.36 |
Table 3. Prediction of July to September 1996 rainfall
in four regions in tropical North Africa, based on multiple linear regression
models.
| Region 1 | Region 2 | Region 3 | Region 4 | |
|
SAH-N |
SAH-G |
SDN |
GUI |
|
|
% of 1951-80 mean |
74 |
77 |
87 |
119 |
|
% of 1971-90 mean |
103 |
99 |
99 |
121 |
Experimental predictions have also been made using the
UKMO climate AGCM described above, using persisted April SST anomalies.
An ensemble of three predictions was used. Their results for 1996, and
the average of these, are expressed as a percentage of model climatology
in Table 4.
Table 4. Prediction of July to September 1996 rainfall in three regions in tropical North Africa, based on the UKMO climate AGCM. Top row shows the ensemble mean forecast, bottom three rows the forecasts of the individual ensemble members (% of model climatology).
|
Region 2 |
Region 3 |
Region 4 |
|
|
SAH-G |
SDN |
GUI |
|
|
Ensemble Mean |
92 |
99 |
90 |
|
Indiv. run #1 |
99 |
103 |
89 |
|
Indiv. run #2 |
94 |
101 |
94 |
|
Indiv. run #3 |
85 |
92 |
88 |
Because the predictive skill of the dynamical model in
these African regions has not been fully tested, the overall forecast is
based mainly on the linear discriminant and multiple regression results.
The discriminant analysis forecasts indicated that for regions 1, 2 and
3 the very dry category has the largest probability. For region 4 the largest
probabilities are for the wet and very wet categories. The multiple regression
prediction lies on the dry/very dry boundary for regions 1, 2 and 3, and
just above the wet/very wet boundary for region 4.
The statistical and dynamical model forecasts agree qualitatively
in region 2, raising confidence in the best estimate forecast shown below,
but disagree in region 3 (where the statistical methods predict below average
rainfall and the dynamical model average rainfall), and disagree in region
4 (where the statistical methods predict above average rainfall but the
dynamical model below average rainfall).
The SST anomalies have been increasing rapidly in the
sensitive south east Atlantic area. Historical data indicate that a rapid
increase to present levels is often followed by a rapid decrease. Such
a decrease through the July-September season would tend to produce rainfall
nearer to average in each region, so confidence in the forecast is reduced
by this factor.
Our best estimate forecast, based on the prediction
methods and the current evolution of SST, is:
o DRY/VERY DRY boundary for regions 1 and 2 (moderate confidence)
o DRY/VERY DRY boundary for region 3 (low to moderate confidence)
o WET for region 4 (low confidence)
Note: A forecast for a boundary between two categories
means that each of them is equally likely. Also note that although well
below average rainfall is forecast for regions 1, 2 and 3 relative to the
1951-80 mean, the forecast rainfalls are near average with respect to the
drier 1971Ł90 means.
Folland, C.K., J.A. Owen, M.N. Ward, and A.W. Colman,
1991: Prediction of seasonal rainfall in the Sahel region of Africa using
empirical and dynamical methods. J. Forecasting., 10, 21Ł56.
Nicholson, S.E., 1985: SubŁSaharan rainfall 1981Ł84. J.
Clim. Appl. Met., 24, 1388Ł1391.
Ward, M.W. and C.K. Folland, 1991: Prediction of seasonal
rainfall in the north Nordeste of Brazil using eigenvectors of seaŁsurface
temperature. Int. J. Climatol., 11, 711Ł743.
Ward, M.N., C.K. Folland, K. Maskell, A.W. Colman, D.P.
Rowell and K.B. Lane, 1993: Experimental Seasonal Forecasting of Tropical
Rainfall at the U.K. Meteorological Office. In: Prediction of Interannual
Climate Variations (J. Shukla, Ed.), NATO ASI Series, Vol. 16, SpringerŁVerlag,
Berlin, 197Ł216.
Fig. 1. Locations of the North African forecast
regions for Jul-Aug-Sep rainfall. Region 1 (SAH-N) is the Sahel as defined
by Nicholson (1985), for which forecasts have been made since 1986. Region
2 is a redefined Sahel (SAH-G), region 3 covers the Soudan zone (SDN) and
region 4 covers the Guinea Coast (GUI).