[Previous Article]
[Next Article]
CCA Forecast for Sahel Rainfall in Jul-Aug-Sep
1996
contributed by Wassila Thiao and Anthony Barnston
Climate Prediction Center, NOAA, Camp Springs,
Maryland
Severe and recurrent rainfall deficits across the African
continent during the past two to three decades have been detrimental to
the economy of the African nations. Thus, policy makers and funding agencies
often face tough challenges to make relief plans. There clearly is a need
for forecasts of short-term climate fluctuations, such as for seasonal
total rainfall one or more seasons in advance. The African Desk, established
at the Climate Prediction Center (CPC) of the NWS/NCEP, has been experimenting
with African seasonal forecasting in collaboration with the CPC. While
numerical approaches are being considered, work so far has focused more
on statistical methods. Here we apply canonical correlation analysis (CCA)
to produce an experimental forecast for rainfall anomalies in the Sahel
region of northern tropical Africa (10-25EN, 20EW-45EE) for the Jul-Aug-Sep
1996 period. The boreal summer months comprise the climatologically rainy
season in the Sahel, as this is when the highest temperatures and atmospheric
moisture content (i.e. the ITCZ) occur at these tropical regions of the
Northern Hemisphere.
The CCA method is a multivariate regression that relates
patterns in predictor fields to patterns in the predictand field. The prediction
design used here is the same as that of the CCA used as one of the tools
for operational climate prediction in the U.S. (Barnston 1994), based on
earlier work of Barnett and Preisendorfer (1987). Four consecutive 3-month
predictor periods are followed by a lead time and then a single 3-month
predictand, or target, period. Forecast skill experiments have indicated
that the global SST field serves best as a predictor. While additional
fields such as upper air geopotential height, tropical low-level wind or
outgoing longwave radiation might well enhance skill farther, data sets
of these fields do not extend far enough into the past to satisfy the CCA=s
need for a long-term (e.g. at least 25-year) data record from which to
identify the dominant relationships. The predictor and predictand data
sets used here begin in 1955. For the 1996 Sahel rainfall prediction shown
below, the predictor data are the global SST anomaly field over the four
3-month periods of Jun-Jul-Aug 1995, Sep-Oct-Nov 1995, Dec-Jan-Feb 1995-96,
and Mar-Apr-May 1996. Using data from 1955-94, relationships between the
prior year=s SST anomaly evolution and the target year=s Jul-Aug-Sep Sahel
rainfall anomaly patterns are linearly modeled by the CCA. The predictor
SST data for the current forecast are then projected onto the preferred
relationships derived from the past years, and a forecast for 1996 boreal
summer developed. Here the lead time is 1 month, because the latest predictor
data used are those of May 1996, preceding the beginning of the target
period by 1 month.
The predictor SST data were derived from a combination
of the COADS data (Slutz et al. 1985) and more recent OI data (Smith et
al. 1996). The predictand Sahel rainfall data come from the gridded global
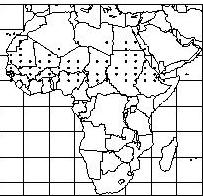
rainfall data set developed by M. Hulme (Hulme 1994), at 2.5 by 3.75E resolution,
resulting in 73 points in the Sahel (Fig. 1). A rainfall data set consisting
of individual stations has also been tested, with results shown in Thiao
et al. (1996) and Barnston et al. (1996). While skill results are roughly
similar between the two rainfall data sets for the Sahel because of the
sufficient station data density, the gridded data tend to show higher skill
in parts of Africa having sparser data. This may be because the gridded
data are developed using stations that have major gaps during some periods,
while the station data set completely excludes such stations.
The diagnostic data produced by CCA indicate that expected
skill is modest to moderate in predicting Jul-Aug-Sep precipitation at
1-month lead, with average region wide correlation skill of 0.33, and 0.60
or higher at some locations. A cross-validation design is used in obtaining
these skill estimates, where each year is held out of the developmental
data set in turn, and then used as the forecast target. Table 1 shows the
expected area-average skill in forecasting the Sahel as progressively longer
lead times. The skill expected at 1 month lead is lost only slowly as the
lead time is increased. This has favorable implications for longer lead
forecasts such as a forecast issued in January or February for the coming
rainy season. Even a full year in advance there is some skill, albeit quite
modest.
Table 1. Area averaged skill (expressed as a correlation) of CCA-based forecasts for Sahel region rainfall in Jul-Aug-Sep as a function of lead time. The fifth row denotes a forecast made more than a year in advance.
|
Latest |
Expected |
|
|
Lead Time |
Required |
Forecast |
|
(months) |
Predictor Data |
Skill |
|
1 |
May |
0.33 |
|
4 |
February |
0.31 |
|
7 |
November |
0.21 |
|
10 |
August |
0.19 |
|
13 |
May |
0.20 |
The spatial loading patterns of the leading CCA modes
suggest two major sources of skill in the SST field, each being expressed
as a separate CCA mode. The first is an interdecadal trend toward warmer
SST in the Indian Ocean, the extratropical South Atlantic and the eastern
tropical and Southern Hemisphere Pacific. Warming of the SST in those regions
has been associated with a decrease in the Jul-Aug-Sep Sahel precipitation,
especially from the late 1960s to the 1980s. The central north Pacific
SST has tended to change in the opposite direction during this same period.
The participation of the eastern tropical Pacific and oppositely-signed
central North Pacific SST in this predictor pattern implies a presence
of ENSO in the relationship with Sahel rainfall: during warm episodes rainfall
is lighter, and during cold episodes it is more plentiful. However, ENSO
does not appear to be the dominating aspect of the relationship. During
the past year we have actually had, on average, a pattern very slightly
opposite of the recent trend; i.e. without the anomalous warmth that
has typified the most recent 15-20 years as a whole. The occurrence of
a cold ENSO episode has undoubtedly contributed to this condition, but
we note that the episode has now nearly dissipated. Thus, this year=s pattern
tends to indicate near normal to slightly wetter than normal conditions
in the Sahel for the 1996 rainy season.
The second CCA-diagnosed source of skill is somewhat of
an interhemispheric difference in SST anomaly, particularly in the Atlantic
but also in the eastern and central Pacific (but not the Indian Ocean or
western Pacific). A similar relationship is discussed by Colman et al.
in the June 1995 issue of this Bulletin and in the present issue. When
the above-mentioned Southern Hemisphere oceans are warm, the Sahel rainy
season has tended to be deficient. While some degree of long-term trend
is present in this skill source (the Northern Hemisphere SST was warmer
during the 1955-1965 portion of our study period), it is less marked than
that of the first skill source discussed above. During the past year the
interhemispheric difference in SST has slightly favored more warmth in
the key regions of the Northern Hemisphere SST than those of the Southern
Hemisphere, which would indicate a weak tendency toward above average rainfall
this Jul-Aug-Sep in the Sahel.
Although 6 CCA modes are used in this prediction, the
above two account for the bulk of the expected skill. The resulting forecast
for Jul-Aug-Sep 1996 is shown in Fig. 2. Near to slightly above average
rainfall is predicted for much of the Sahel, with respect to the 1955-94
mean. Figure 3 shows the geographical distribution of expected skill
for the forecast, expressed as a temporal correlation coefficient between
forecasts and observations over the historical period of study. The regional
mean skill is 0.33. In some locations, expected correlation skill exceeds
0.60. The field significance of the skill map, computed using Monte Carlo
randomizations (indicating the probability that this skill map could have
occurred by chance), is 0.000; i.e. there is virtually no chance that these
levels of skill over this region are a fluke.
Where the skill is estimated at 0.50 or higher, confidence
in this forecast can be regarded as at least moderate. Where skill is below
0.50 but at least 0.30, confidence is modest but the forecast is still
usable. This forecast indicates mainly near to slightly above average rainfall
in many of the locations where skill is moderately high. This implies a
shift in the probability distribution against having a dry 1996 rainy season
at those locations. By the same token, a very wet season appears
unlikely for the region as a whole. The lower the expected skill, the more
the CCA tends to damp forecast amplitudes toward the mean. When skill is
appreciable (e.g. near the common borders of Mali, Niger and Burkina Faso
in the current case), a forecast for near-average conditions reflects neutral
or contradictory predictor patterns rather than a damping toward the mean
due to a weak relationhip with the predictors. The present forecast is
not far from normal because, as discussed above, the two dominant CCA modes
do not presently indicate extreme predictor conditions.
Note: All anomalies presented here are with respect
to the 1955-94 base period. Because of secular changes in SST and Sahel
rainfall, this may lead to conflicting anomalies with those cited in studies
that use different base periods, such as the Colman et al. article in this
issue of the Bulletin.
Barnston, A.G., W. Thiao and V. Kumar, 1996: Long-lead forecasts of seasonal precipitation in Africa using CCA. Wea. Forecasting, 11, in press
.
Hulme, M., 1994: Validation of large-scale precipitation
fields in general circulation models. In Global Precipitation and Climate
Change, M. Desbois and F. Desalmand, Ed., NATO ASI Series, Springer-Verlag,
Berlin, 466 pp.
Slutz, R., S.J. Lubler, J.D. Hiscox, S.D. Woodruff, R.J.
Jenne, D.H. Joseph, P.M. Steurer, and J.D. Elius, 1985: Comprehensive Ocean
Atmosphere Data Set. NOAA, Boulder, CO, 268 pp. [Available from Climate
Research Program, ERL, R/E/AR6, 325 Broadway, Boulder, CO 80303.]
Smith, T.M., R.W. Reynolds, and C.F. Ropelewski, 1994:
Optimal averaging of seasonal sea surface temperatures and associated confidence
intervals (1860-1989). J. Climate, 7, 949-964.
Thiao, W., A.G. Barnston and V. Kumar, 1996: Teleconnections
and seasonal rainfall prediction in Africa. Proceedings of the 20th
Annual Climate Diagnostics Workshop, Seattle, Washington, October 23-27,
1995, 413-416.
Fig. 1. The 73 grid points used as the rainfall
predictand for the Sahel CCA predictions.
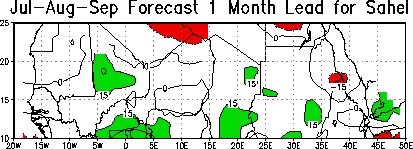
Fig. 2. The CCA-based rainfall anomaly forecast
for the Sahel region of northern tropical Africa for Jul-Aug-Sep 1996.
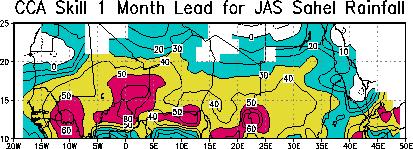
Fig. 3. Geographical distribution of the cross-validated
estimate of expected skill for the rainfall forecast shown in Fig. 2. Skill
is expressed as a correlation between predictions and observations over
an extended period.