[Previous Article]
[Table of Contents]
Brief Summary of NCEP's Canonical Correlation
Analysis (CCA), Optimal Climate Normals (OCN), and NCEP Coupled Model Forecastsfor
U.S. Surface Climate
contributed by Anthony Barnston
Climate Prediction Center, NOAA, Camp Springs,
Maryland
Because the CCA (Barnston 1994) and OCN (Huang et al.
1995) methods are now being used for the official operational long-lead
seasonal forecasts issued by the Climate Prediction Center of NCEP, they
will no longer be presented in detail in this Experimental Forecast Bulletin.
However, a brief summary of these forecasts, as well as that of the NCEP
coupled model (Ji et al. 1994a,b), for Jul-Aug-Sep 1996 and Jan-Feb-Mar
1997 is provided. For further information about the official NCEP forecasts,
the following U.S. Regional Climate Center (RCC) Offices may be contacted:
   Northeastern RCC      607-255-5950
   Southeastern RCC      803-737-0800
   Southern RCC          504-388-5021
   Midwest RCC           217-244-8226
   High Plains RCC       402-472-8294
   Western RCC           702-677-3106
The forecasts themselves are contained in the Climate
Outlook, available on Internet with address: http://nic.fb4.noaa.gov.
That same address can also be used to access the web site for this Bulletin,
as follows: http://nic.fb4.noaa.gov/products/predictions; then click on
Aproduct A-Z list@.
U.S. Surface Climate Forecasts for Jul-Aug-Sep >96
Temperature: CCA predicts anomalous warmth in much of
the East, eastern Midwest and Great Lakes, Texas, the Southwest, parts
of the far West, and Hawaii. OCN forecasts warmth in Florida and the Southeast,
the Mid-Atlantic, and small parts of the Pacific Northwest and the Southwest;
and cold in the nation=s midsection. The coupled model dynamical forecast
calls for warmth in Montana.
Precipitation: The OCN, CCA and the NCEP coupled model
predict only small patches of positive and negative anomalies that show
little agreement; thus no meaningful forecast is gleaned. CCA predicts
above-median rainfall in the southern Hawaiian islands.
U.S. Surface Climate Forecasts for Jan-Feb-Mar >97
Temperature: CCA predicts anomalous warmth in the eastern
half of the U.S. (Except Florida and Texas), central and northern Plains,
and part of the west; and somewhat cool in all of Hawaii except for Maui.
OCN forecasts warmth in most of the country, excluding the mid-section
and the much of the central northern tier. The NCEP coupled model does
not presently make forecasts this far in advance.
Precipitation: CCA predicts anomalous wetness in the southern
half of Texas, in parts of the Gulf coast (including western Florida);
and dryness along the northern tier especially from Montana to the Great
Lakes. OCN predicts above median rainfall in the southern Rockies and southern
Plains (Oklahoma, northern and central Texas) and Florida panhandle; dry
in much of the Northwest and a 5-state region centered on the Ohio Valley.
The NCEP coupled model does not presently make forecasts this far in advance.
Note: The above forecast descriptions include only regions
whose estimated cross-validated correlation skill exceeds 0.3. Highest
local skills are usually in the neighborhood of 0.6, but this varies with
season, lead time and forecast tool.
ENSO-Related SST
CCA (Barnston and Ropelewski 1992, Smith et al. 1995)
predicts slightly below normal SST conditions in Nino 3.4 (120-170oW,
5 oN-5 oS) through fall 1996, switching to a positive
anomaly by late winter 1996-97. A warm episode is suggested during 1997.
Specifically, the forecast calls for the following standardized anomalies
and cross-validated correlation skills:
| forecast | skill | |
| Jul-Aug-Sep 1996 |
-0.58 |
0.58 |
| Oct-Nov-Dec 1996 |
-0.35 |
0.52 |
| Jan-Feb-Mar 1997 |
0.10 |
0.61 |
| Apr-May-Jun 1997 |
0.71 |
0.62 |
| Jul-Aug-Sep 1997 |
1.27 |
0.27 |
The forecast for Jul-Aug-Sep 1996 is a skill-weighted
average of CCA and simple persistence of the anomaly observed in Mar-Apr-May,
because persistence and CCA skills are roughly equivalent for that forecast.
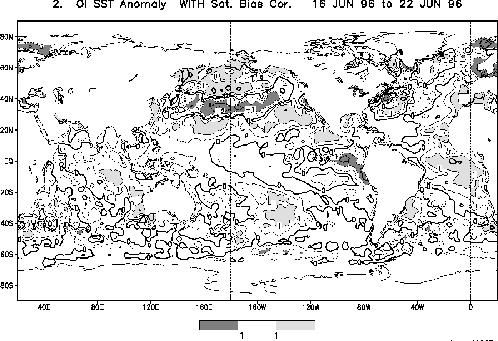
Longer lead forecasts reflect only CCA. The global field of SST anomaly
for June 9-15, 1996 (Fig. 1) shows the currently near normal (cold) SST
in the east-central (far eastern) equatorial Pacific.
References
Barnston, A.G., 1994: Linear statistical short-term climate
predictive skill in the Northern Hemisphere. J. Climate, 5,
1514-1564.
Barnston, A.G. and C.F. Ropelewski, 1992: Prediction of
ENSO episodes using canonical correlation analysis. J. Climate, 7,
1316Ł1345.
Huang, J., H.M. van den Dool and A.G. Barnston, 1996:
Long-lead seasonal temperature prediction using optimal climate normals.
J. Climate, 9, 809-817.
Ji, M., A. Kumar and A. Leetmaa, 1994a: A multiŁseason
climate forecast system at the National Meteorological Center. Bull.
Am. Meteor. Soc., 75, 569Ł577.
Ji, M., A. Kumar and A. Leetmaa, 1994b: An experimental
coupled forecast system at the National Meteorological Center: Some early
results. Tellus, 46A, 398-418.
Reynolds, R.W. and T.M. Smith, 1994: Improved global sea
surface temperature analysis using optimum interpolation. J. Climate,
7, 929Ł948.
Smith, T.M., A.G. Barnston, M. Ji and M. Chelliah, 1995:
The impact of Pacific Ocean subsurface data on operational prediction of
tropical Pacific SST at the NCEP. Wea. Forecasting, 10, 708-714.
Fig. 1. NCEP optimum interpolation (OI; Reynolds
and Smith 1994) global SST anomaly field for the week of June 9-15, 1996.