Tropical
Highlights - May 2000
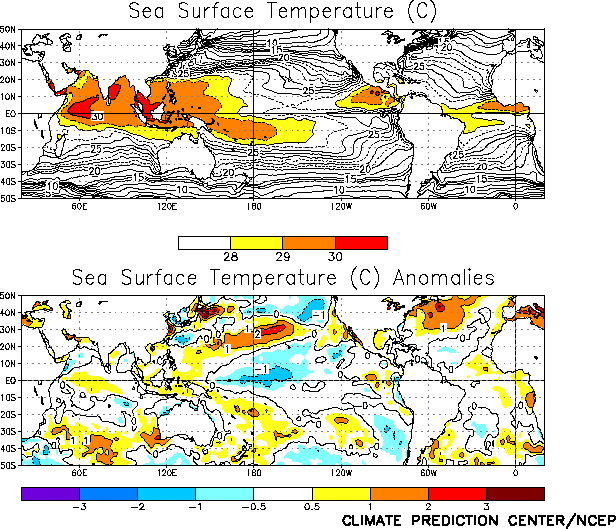
Negative sea surface temperature (SST) anomalies
have weakened across the tropical Pacific during the past few months, with equatorial SSTs
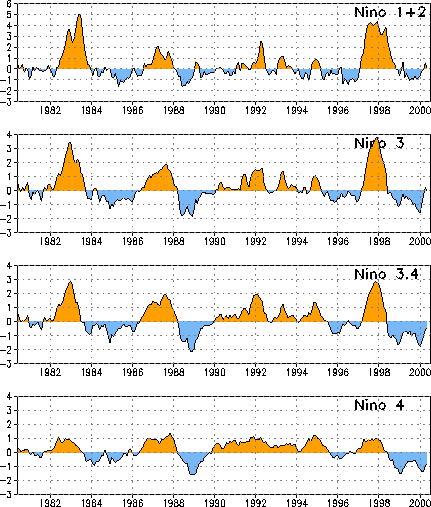
of more than 1.0°C below normal now confined to the region between 170°E and 160°W (Fig. T18). As a result, the Niño 3.4 and Niño 4 region
indices were only -0.5°C and -0.8°C, respectively, during May (Table
T2, Fig. T5). These were the smallest negative
values for these indices since May 1998 and November 1999, respectively (Fig. T5). Across the eastern Pacific SST anomalies returned
toward normal during May, after becoming positive in April (Table
T2).
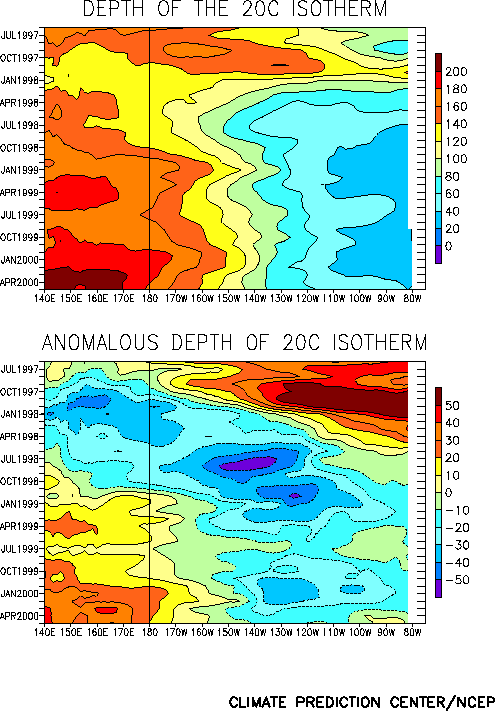
The oceanic thermocline remained much deeper than normal in the equatorial west-central
and western Pacific during the month (Fig. T15), with
temperatures again averaging more than 4.0°C above normal at thermocline depth (Fig. T17). Over the eastern Pacific, the thermocline
continued to deepen (Fig. T15), resulting in a lessening
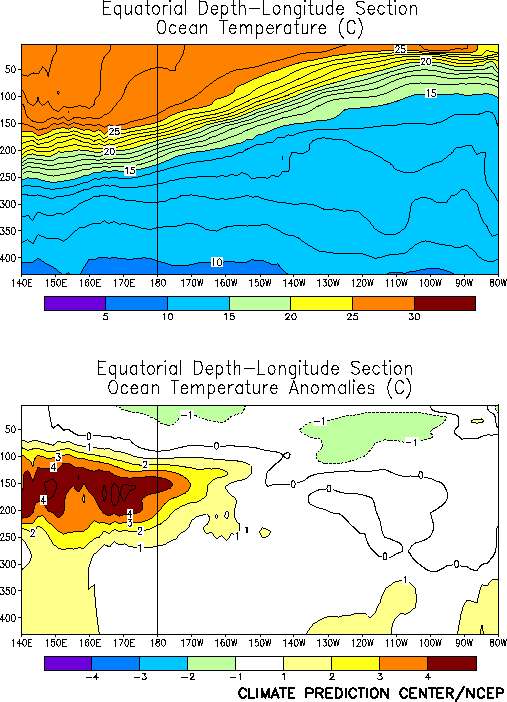
of negative temperature anomalies at thermocline depth (Fig. T17).
As a result subsurface temperatures more than 1.0°C below normal were confined to the
region between 100°W and 140°W. The recent evolution of the oceanic thermocline and
subsurface temperature anomalies is similar to that observed during March-May 1999, with
the major differences being an increase in the magnitude of the positive subsurface
temperature anomalies in the western Pacific and a decrease in the magnitude of the
negative anomalies in the eastern Pacific. This basic east-west dipole of subsurface
temperature anomalies, which is typical of the mature phase of La Niña episodes, has been
highly persistent since late 1998.
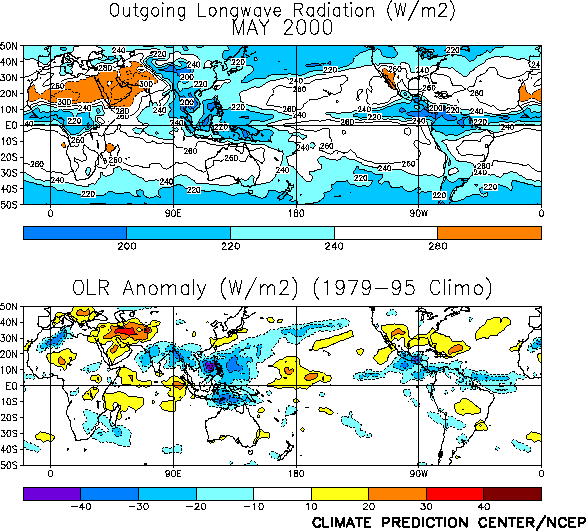
The pattern of tropical convection during May [as inferred from anomalous outgoing
longwave radiation (OLR)] remained consistent with cold episode conditions, with
suppressed convection over the western and central equatorial Pacific and enhanced
convection over Indonesia (Fig. T25). Elsewhere,
convection was enhanced over southeast Asia and India during the month (Fig. T25), implying a strong start to the Indian/Southeast
Asian summer monsoon system. Convection was also enhanced over southern Mexico/Central
America, in association with an amplified monsoon circulation in that region. Strong
monsoonal circulations in each of these regions are consistent with ongoing La Niña
conditions.
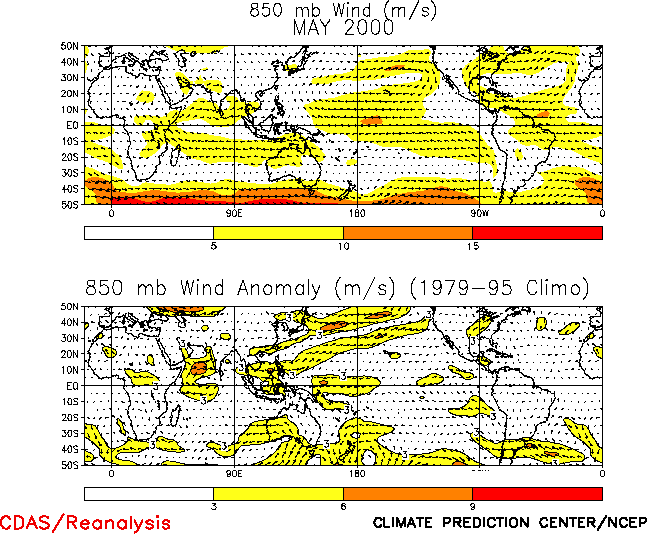
The pattern of tropical convection over the central and western Pacific was again
accompanied by an enhanced Walker circulation across the central equatorial Pacific (Fig. T29). However, consistent with the decrease in magnitude
of the negative SST anomalies, the low-level (850 hPa) easterly wind anomalies across the
central and western tropical Pacific decreased to 3-6 m s-1 between 150°E and
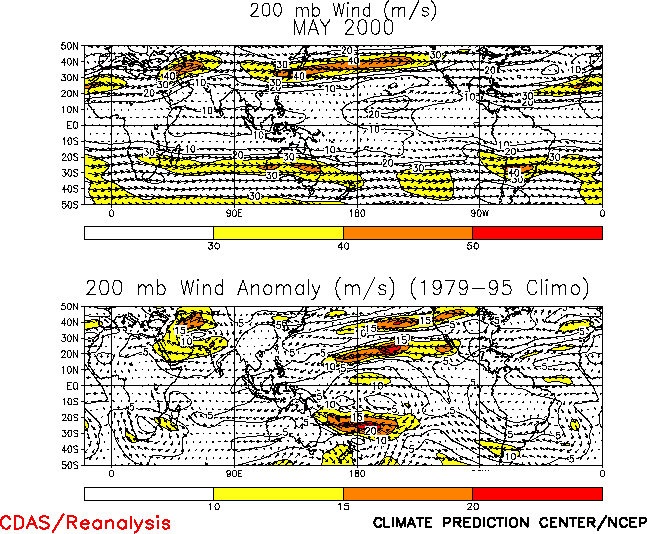
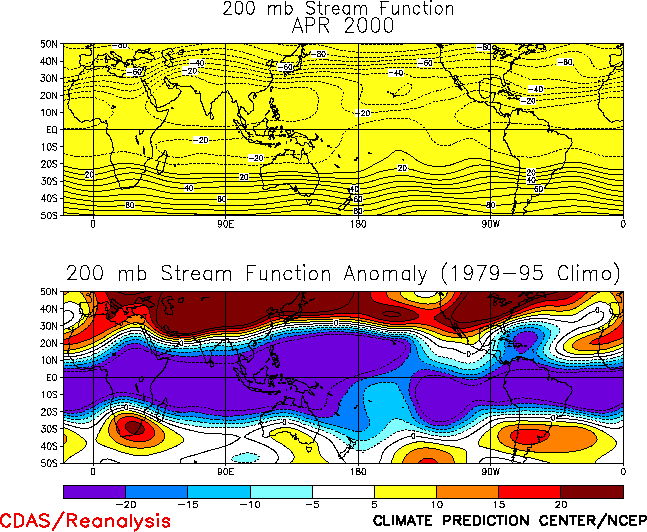
170°W (Fig. T20). At upper-levels (200-hPa),
well-developed mid-Pacific troughs were again observed over the low-latitudes of both
hemispheres, with anticyclonic circulation anomalies dominating the subtropics and lower
mid-latitudes of both hemispheres (Figs. T21, T22). This anomaly pattern has also persisted since mid-1998, in
association with ongoing La Niña conditions.
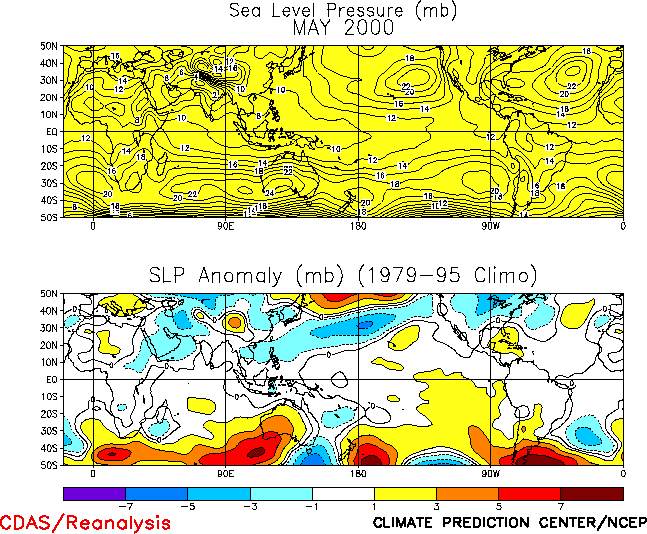
The sea level pressure (SLP) pattern across the Tropics during May featured positive
anomalies across the tropical central and eastern Pacific and weak negative anomalies over
Indonesia (Fig. T19). This pattern is consistent with
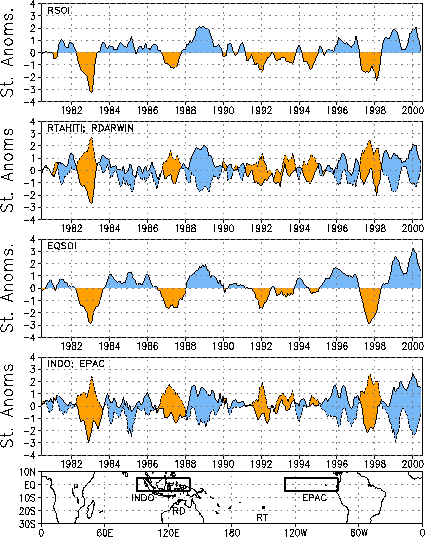
ongoing cold episodes, and was associated with a positive value of the equatorial Southern
Oscillation Index (SOI) (1.4) (Fig. T2). The May value of
the Tahiti-Darwin SOI was only 0.2 (Table T1, Fig. T2), as SLP at Darwin was above normal in association with a
strong mid-latitude ridge that extended into the subtropics over Australia (Fig. T19). |


