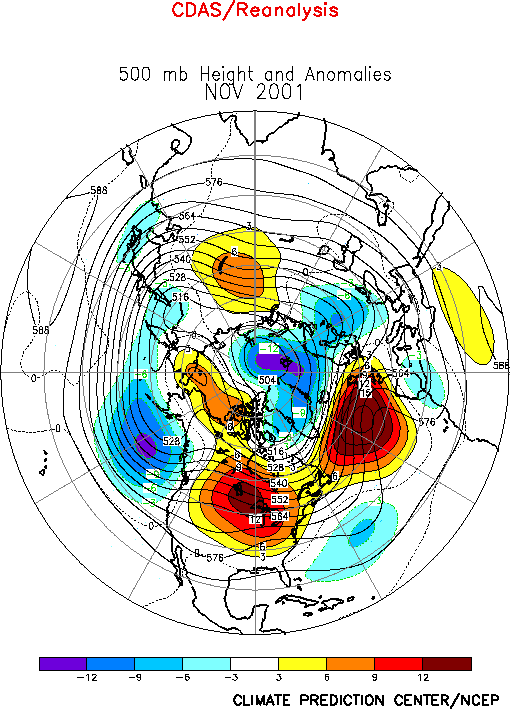
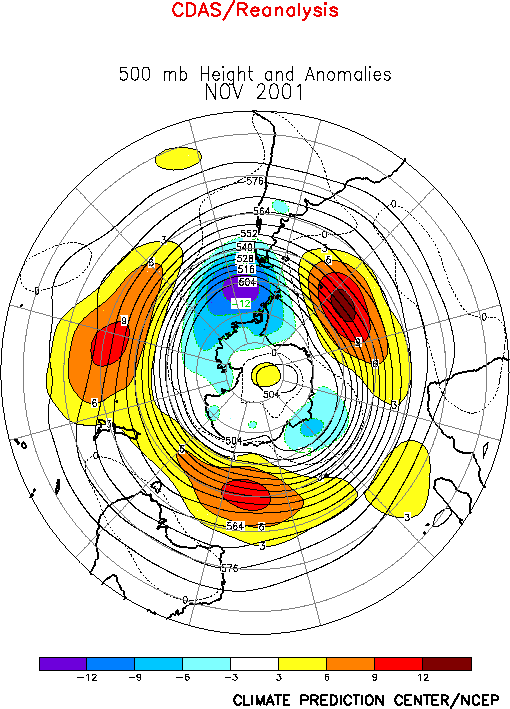
| The Northern Hemisphere circulation
featured above-average 500-hPa heights throughout North America, the high latitudes of the
North Atlantic, and central Russia during November (Fig. E10),
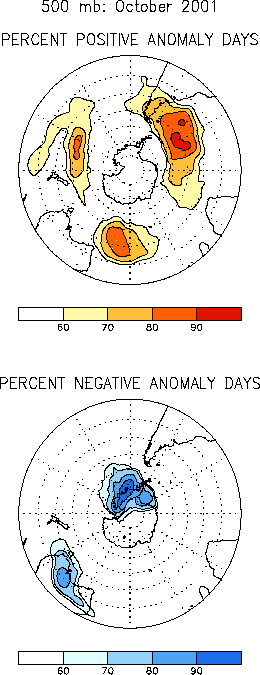
with positive height anomalies observed in the former two regions for at least 90% of the
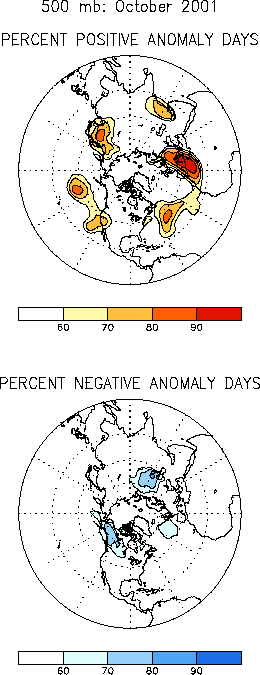
days during the month (Fig. E12). Persistent below-average
heights were evident during November over the eastern North Pacific, the low latitudes of
the North Atlantic from Florida eastward to the western Mediterranean Sea, the polar
region including Greenland, and eastern Europe. These combined anomalies reflected a
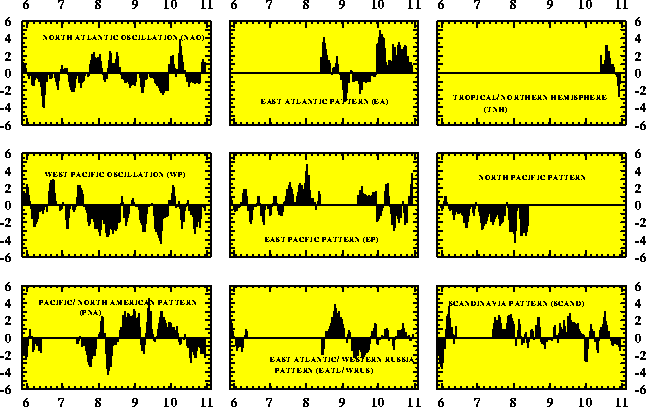
strong negative phase of the Tropical Northern Hemisphere (TNH) teleconnection pattern,
the positive phase of the North Atlantic Oscillation (NAO), and the negative phase of the
Scandinavia teleconnection pattern (Figs. E7, E8, Table E1). a. North America
The large positive height anomalies observed across
North America during November reflected an extremely persistent large-scale ridge over
much of the continent, along with a complete disappearance of the mean Hudson Bay Low from
its climatological position over eastern Canada and the eastern United States (Fig. E10). This anomalous circulation was associated with
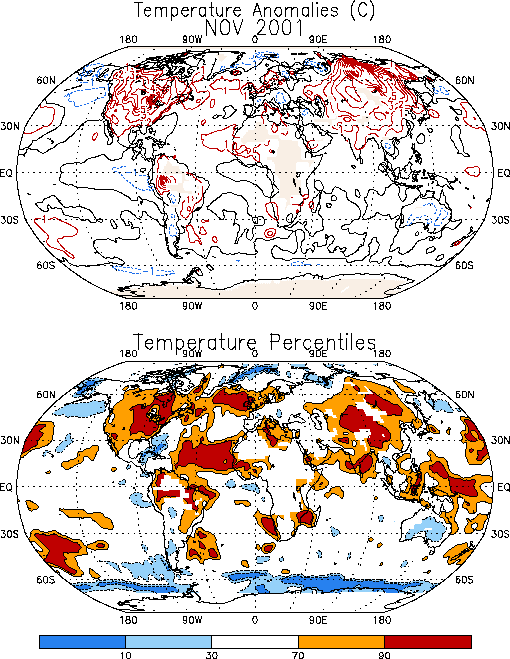
exceptionally warm surface temperatures over most of North America (Fig.
E1, top), with monthly anomalies generally exceeding the 70th
percentile (Fig. E1, bottom). The largest temperature
anomalies ranged from 3o-5oC above average across central Canada and
the central United States, and exceeded the 90th percentile.
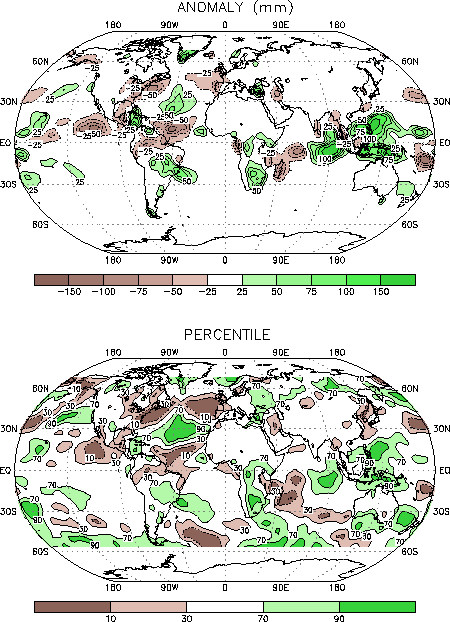
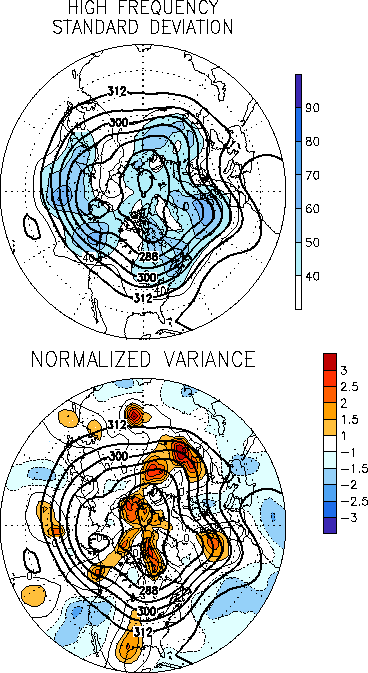
Over the east-central and northeastern U.S. the anomalous warmth was accompanied by
significantly below-average precipitation for a second consecutive month (Figs. E3, E6). During November this entire area
was situated just downstream of the mean upper level ridge axis in an area of upper-level
convergence (Fig. T23, top), large-scale sinking motion,
and reduced storminess (Fig. E14, right). Climatologically these regions are situated within and immediately
downstream of the mean upper-level trough axis, in areas of large-scale ascending motion
and considerable high-frequency variability.
2. Southern Hemisphere
The Southern Hemisphere circulation during November featured a
continuation of positive 500-hPa height anomalies throughout the middle latitudes, and
negative anomalies over the high latitudes of the eastern South Pacific (Fig. E16, E18, E19).
This circulation was accompanied for a second consecutive month by an anomalous
large-scale trough and below-average surface temperatures over most of central and
southern of Australia (Fig. E1).
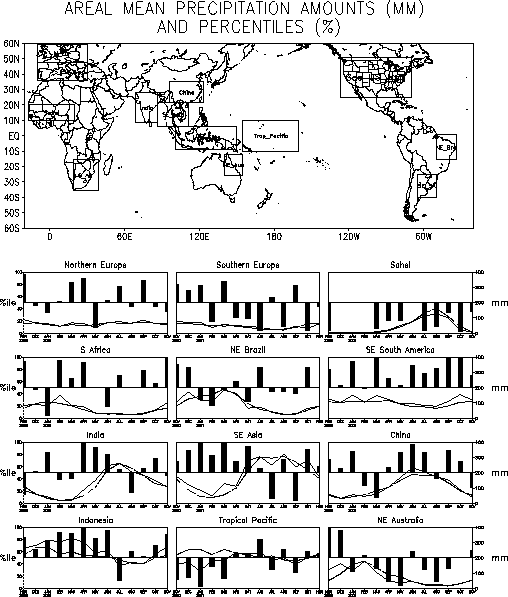
In southern Africa the November onset of the monsoon season (which lasts from
November-April) featured significantly above-average rainfall with area-average totals
exceeding the 90th percentile (Fig. E4). The
largest local rainfall anomalies also exceeded the 90th percentile, and were
found across the heavy agricultural and climatologically heavy rainfall regions of central
and eastern South Africa (Fig. E3, top).
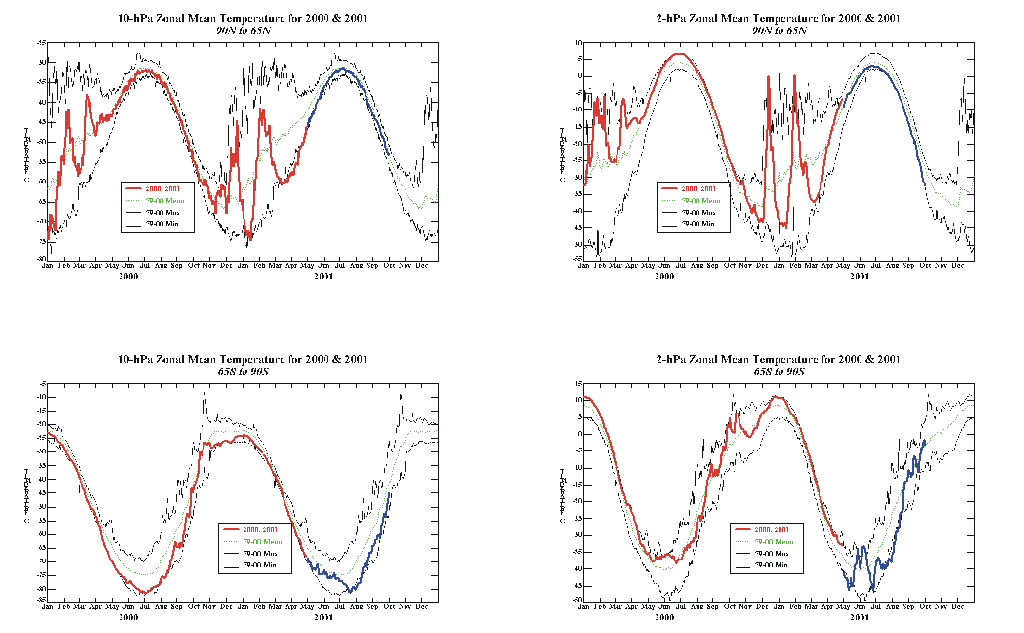
In the lower stratosphere daily 10-hPa temperatures in the polar region (between 65°S-90°S) remained near
the lowest values on record for November (Fig. S4), and the
Southern Hemisphere polar vortex reached a November record size of over 25 x 106
km2 (Fig. S8, middle). Consistent with these
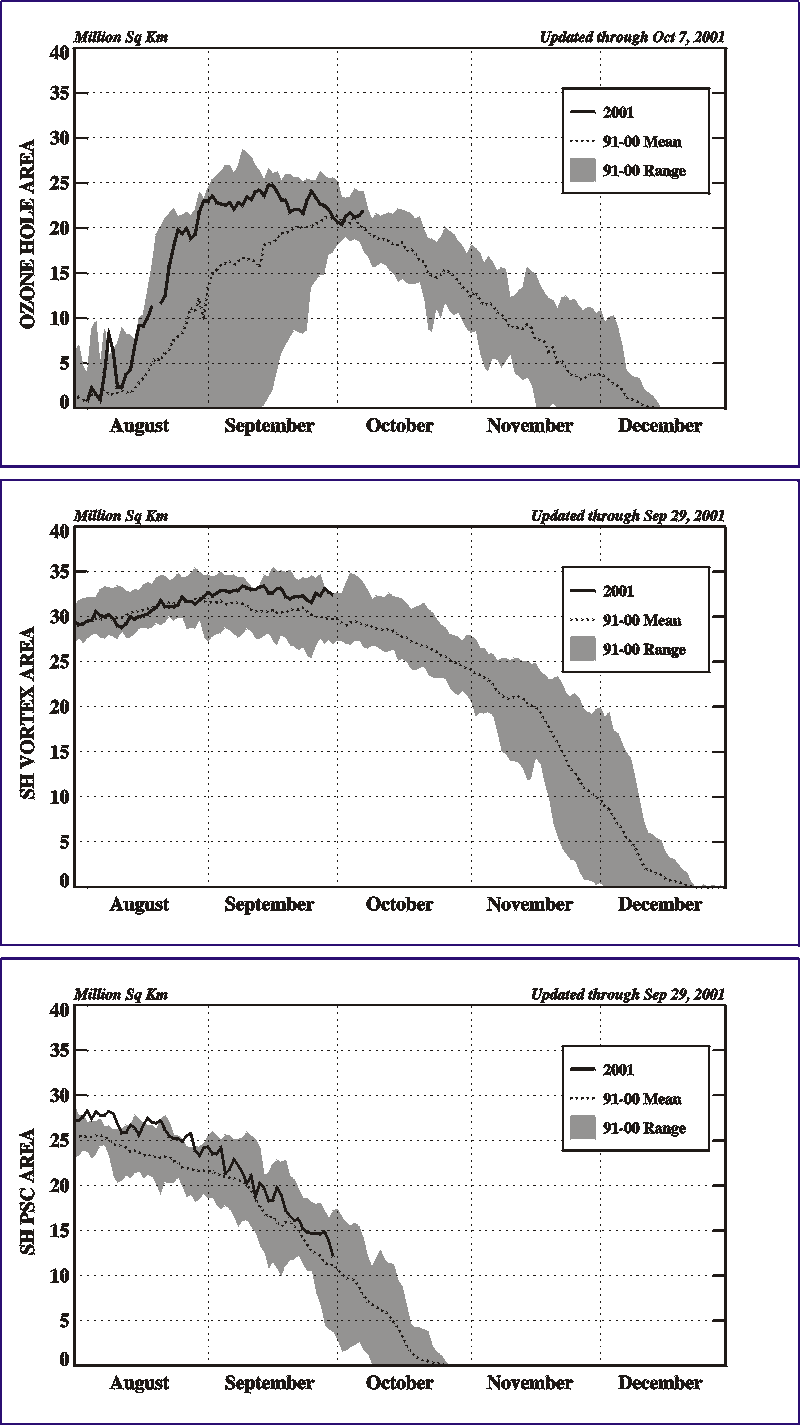
conditions the Antarctic ozone hole, defined by total column ozone values less than 220
Dobson Units (DU), remained the third largest (shaded region, Fig.
S6, bottom) in the historical record. The 2001 ozone hole developed in mid-August
and reached peak strength during September and October. In early November the ozone hole
was still quite large (15 x 106 km2), but by the end of the month
its coverage had decreased to 4 x 10⁶ km2 (Fig.
S8, top). The ozone hole then completely disappeared by the 10th of
December. |


