This 2020 eastern Pacific Hurricane Season Outlook is an official product of the National Oceanic and Atmospheric Administration (NOAA) Climate Prediction Center (CPC), and is produced in collaboration with hurricane specialists from the NOAA National Hurricane Center (NHC). The eastern Pacific hurricane region covers the eastern North Pacific Ocean east of 140°W and north of the equator.
Interpretation of NOAA's eastern Pacific hurricane season outlook
This outlook is general guide to the expected overall activity during the upcoming hurricane season. It is not a seasonal hurricane landfall forecast, and it does not imply levels of activity for any particular location.
Preparedness
Hurricane-related disasters can occur whether the season is active or relatively quiet. It only takes one hurricane (or even a tropical storm) to cause a disaster. It is crucial that residents, businesses, and government agencies of coastal and near-coastal regions prepare for every hurricane season regardless of this, or any other, seasonal outlook. The Federal Emergency Management Agency (FEMA), the NHC, the Small Business Administration, and the American Red Cross all provide important hurricane preparedness information on their web sites.
NOAA does not make seasonal hurricane landfall predictions
NOAA does not make seasonal hurricane landfall predictions. Hurricane landfalls are largely determined by the weather patterns in place as the hurricane approaches, which are predictable when the storm is within several days of making landfall.
Nature of this Outlook and the "likely" ranges of activity
This outlook is probabilistic, meaning the stated "likely" ranges of activity have a certain likelihood of occurring. The seasonal activity is expected to fall within these ranges in 7 out of 10 seasons with similar conditions and uncertainties to those expected this year. They do not represent the total possible range of activity seen in past similar years.
This outlook is based on climate model forecasts and on predictions of large-scale climate factors and conditions which are known to strongly influence seasonal eastern Pacific hurricane activity. The outlook also takes into account uncertainties inherent in such climate outlooks.
Sources of uncertainty in this seasonal outlook
1. Predicting El Niño and La Niña (also called ENSO) impacts is an ongoing scientific challenge facing climate scientists today. Such forecasts made during the spring generally have limited skill.
2. Uncertainty as to whether the eastern Pacific remains in a high-activity era during 2020, or if it has shifted to a low-activity era.
3. Predicting combined impacts associated with the Pacific-Decadal Oscillation (PDO) and the Atlantic Multi-Decadal Oscillation (AMO) remains a challenge, especially when they have competing phases.
4. Many combinations of named storms and hurricanes can occur for the same general set of climate conditions. For example, one cannot know with certainty whether a given climate signal will be associated with several short-lived storms or fewer longer-lived storms with greater intensity.
5. Weather patterns that are unpredictable on seasonal time scales can sometimes develop and last for weeks or months, possibly affecting seasonal hurricane activity.
2020 Eastern Pacific Hurricane Outlook Summary
a. Predicted Activity
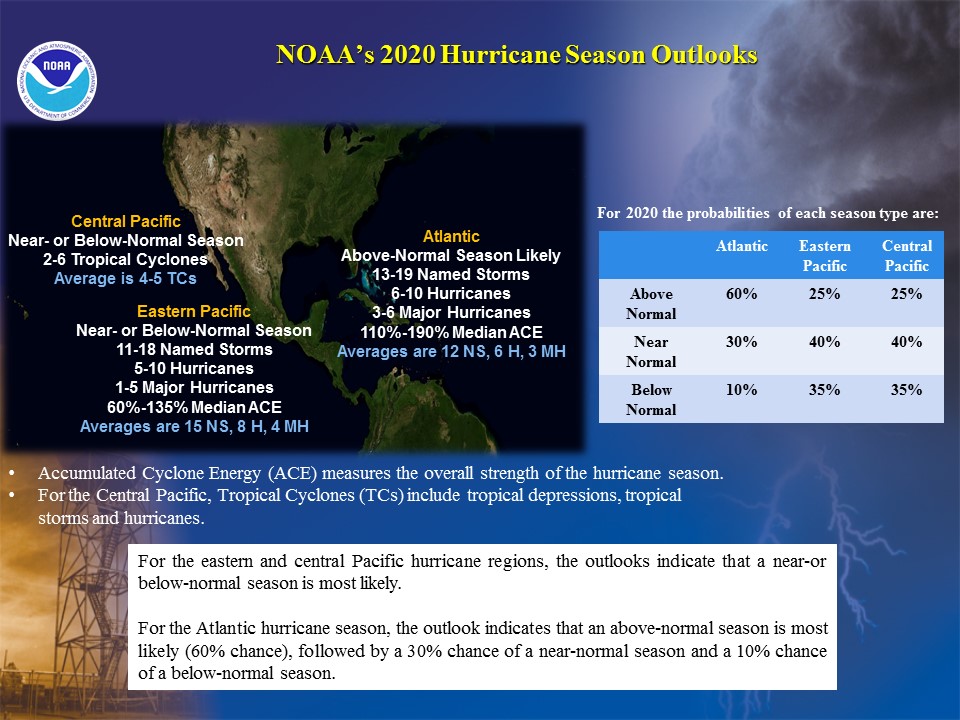
NOAA’s 2020 eastern Pacific Hurricane Season Outlook indicates a near- or below-normal season most likely (75% combined chance). There is a 40% chance of a near-normal season and a 35% chance of a below-normal season, followed by a 25% chance of an above-normal season. See NOAA definitions of above-, near-, and below-normal seasons. The eastern Pacific hurricane region covers the eastern North Pacific Ocean east of 140°W north of the equator.
The 2020 outlook calls for a 70% probability for each of the following ranges of activity:
- 11-18 Named Storms
- 5-10 Hurricanes
- 1-5 Major Hurricanes
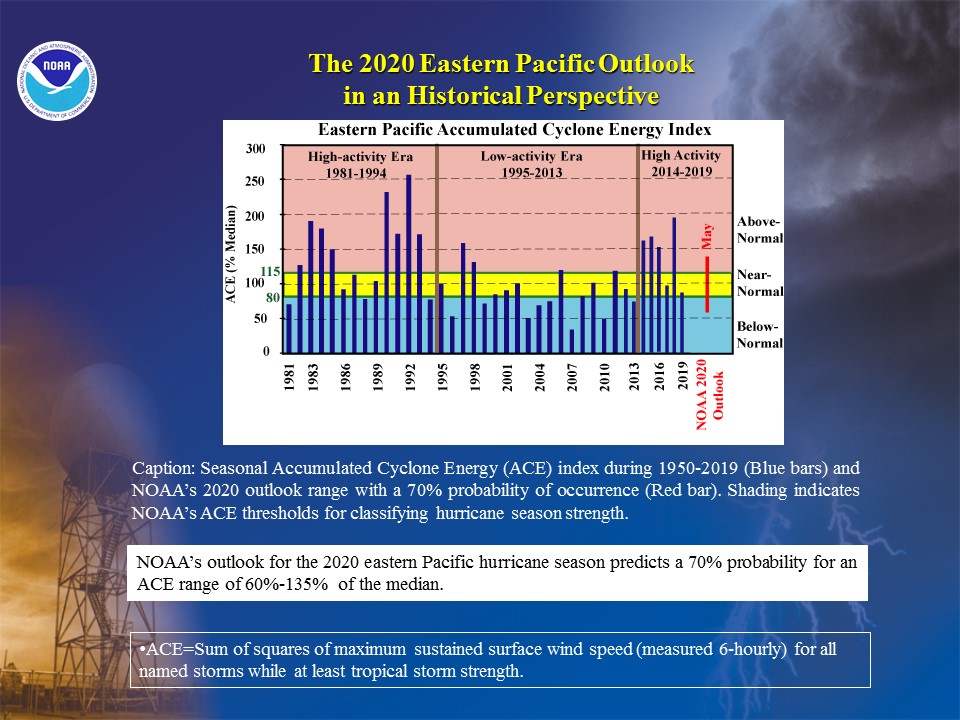
- Accumulated Cyclone Energy (ACE) range of 60%-135% of the median.
The activity is expected to fall within these ranges in 70% of seasons with similar climate conditions and uncertainties to those expected this year. These ranges do not represent the total possible activity seen in past similar years. The predicted ranges are centered slightly below the 1981-2010 averages of 15 named storms, 8 hurricanes, and 4 major hurricanes.
The eastern Pacific hurricane season officially runs from May 15th through November 30th. The peak months of the season are July-September (JAS).
There are no further updates to this outlook.
b. Reasoning behind the outlook
Two climate factors are expected to contribute to a near- or below-normal 2020 hurricane season across the eastern (and central) Pacific hurricane basins, as follows:
1) The current and predicted SST anomaly patterns indicate below- or near-average SSTs across the eastern Pacific hurricane region, and above-average SSTs across the Atlantic Main Development Region (MDR). Historically, this combination tends to be associated with near- or below-normal hurricane activity.
2) The most recent forecast from the NOAA Climate Prediction Center indicates a likely continuation of ENSO-neutral conditions (i.e., no El Niño or La Niña), or even the development of La Niña. The ENSO influence on eastern Pacific hurricane activity is highly dependent upon the background SST patterns across the eastern Pacific hurricane region and the Atlantic MDR. For the SST anomaly patterns above, both ENSO-neutral and La Niña tend to favor reduced eastern Pacific hurricane activity, often resulting in a near- or below-normal hurricane season.
DISCUSSION
1. Expected 2020 activity
NOAA’s 2020 eastern Pacific Hurricane Season Outlook indicates a near- or below-normal season most likely (75% combined chance). There is a 40% chance of a near-normal season and a 35% chance of a below-normal season, followed by a 25% chance of an above-normal season. See NOAA definitions of above-, near-, and below-normal seasons.
An important measure of the total seasonal activity is NOAA’s Accumulated Cyclone Energy (ACE) index, which accounts for the combined intensity and duration of named storms and hurricanes during the season. This 2020 outlook indicates a 70% chance that the ACE range will be 60%-135% of the median. An ACE value of 80%-115% of the median indicates a near-normal season. Values above this range reflect an above-normal season, and values below this range reflect a below-normal season.
The 2020 eastern Pacific hurricane season is predicted to produce (with 70% probability for each range) 11-18 named storms, of which 5-10 are expected to become hurricanes, and 1-5 of those are expected to become major hurricanes. These ranges are centered slightly below the official NHC 1981-2010 seasonal averages of 15 named storms, 8 hurricanes, and 4 major hurricanes.
Predicting the location, number, timing, and strength of hurricane landfalls are ultimately related to the daily weather patterns, storm genesis locations and steering patterns. These patterns are not predictable weeks or months in advance. As a result, it is currently not possible to reliably predict the number or intensity of landfalling hurricanes at these extended ranges, or whether a given locality will be impacted by a hurricane this season.
2. Science behind the 2020 Outlook
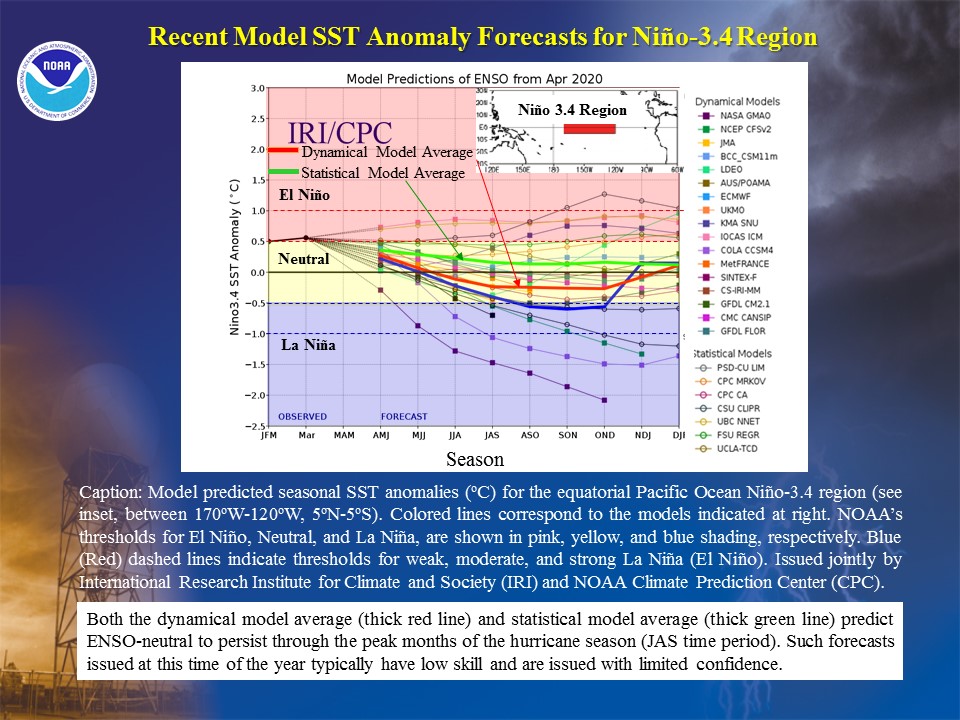
NOAA’s eastern Pacific hurricane season outlook is based on predictions of the main climate factors and their associated conditions known to influence the hurricane season. The outlook is based on extensive monitoring, analysis, research activities, a suite of statistical prediction tools, and dynamical models. The dynamical model predictions come from the NOAA Climate Forecast System (CFS), NOAA Geophysical Fluid Dynamics Lab (GFDL) FLOR model, the North American Multi-Model Ensemble (NMME), the United Kingdom Met Office (UKMET) GloSea5 model, and the European Centre for Medium-Range Weather Forecasting (ECMWF) model. ENSO forecasts are also provided from a suite of statistical and other dynamical models contained in the suite of Niño 3.4 SST forecasts, which is compiled by the IRI (International Research Institute for Climate and Society) and the NOAA CPC.
NOAA’s 2020 eastern Pacific hurricane season outlook reflects two main factors, as follows:
1) The predicted SST anomaly patterns indicate near-average SSTs across the eastern Pacific hurricane region, and above-average SSTs across the Atlantic MDR. These conditions project onto the negative phase of the Pacific Decadal Oscillation (PDO) and also onto the warm phase of the Atlantic Multi-Decadal Oscillation (AMO). Historically, this combination of climate patterns tends to be associated with low-activity eras, and with near- or below-normal eastern Pacific hurricane seasons. However, a main source of uncertainty for the 2020 outlook is whether the negative PDO pattern will persist through the hurricane season.
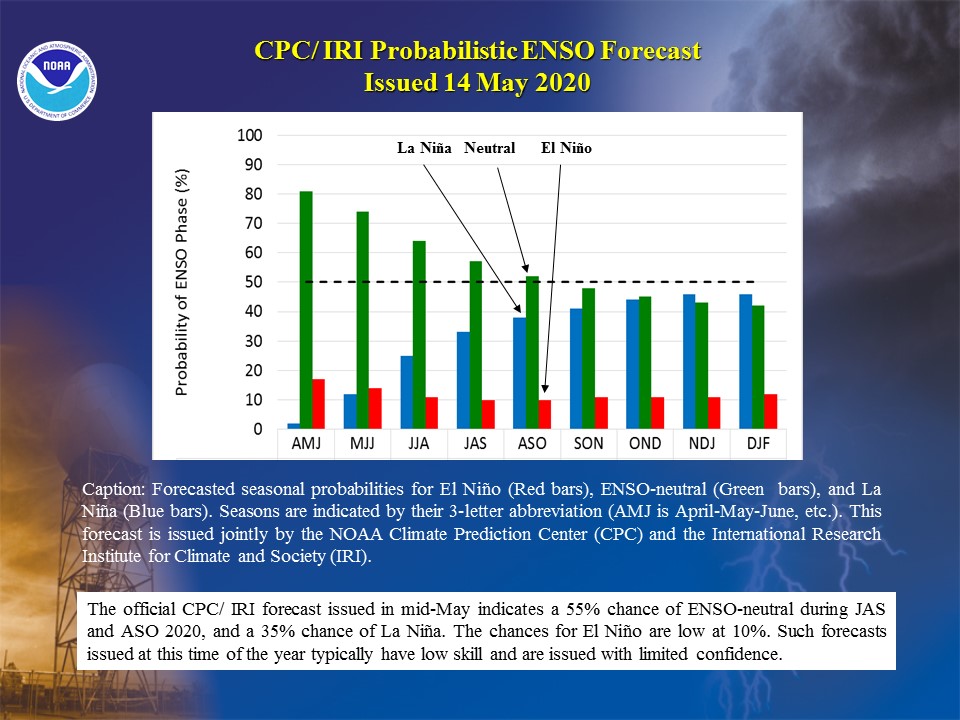
2) The most recent forecast from the CPC indicates a likely continuation (about a 55% chance) of ENSO-neutral conditions (i.e., no El Niño or La Niña) during JAS and ASO, or even the development of La Niña (about a 35% chance). Historically, during low-activity eras when the negative PDO and warm AMO are present, ENSO-neutral or La Niña tend to favor a near- or below-normal season. However, if the positive PDO pattern remerges, ENSO-neutral conditions could favor activity near or above the upper ends of our predicted ranges.
a. ENSO-neutral or La Niña most likely
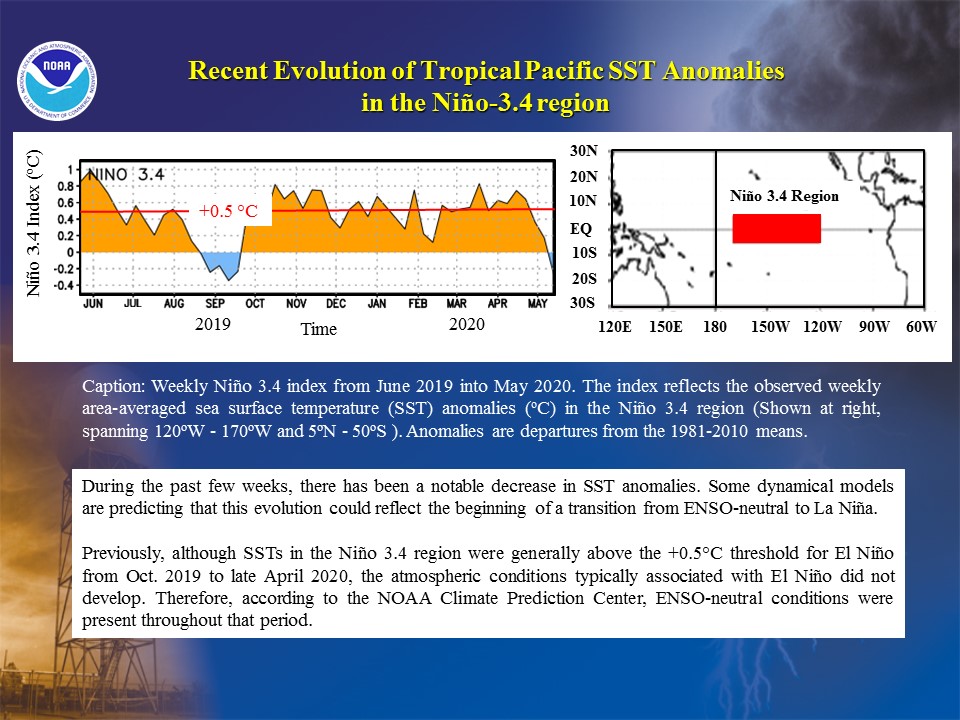
ENSO-neutral conditions are present. The latest weekly SSTs are near average across the central and eastern equatorial Pacific, and the SST index for the Niño 3.4 region is -0.3°C. The Niño 3.4 region spans the east-central equatorial Pacific between 120°W-170°W and 5°N-5°S.
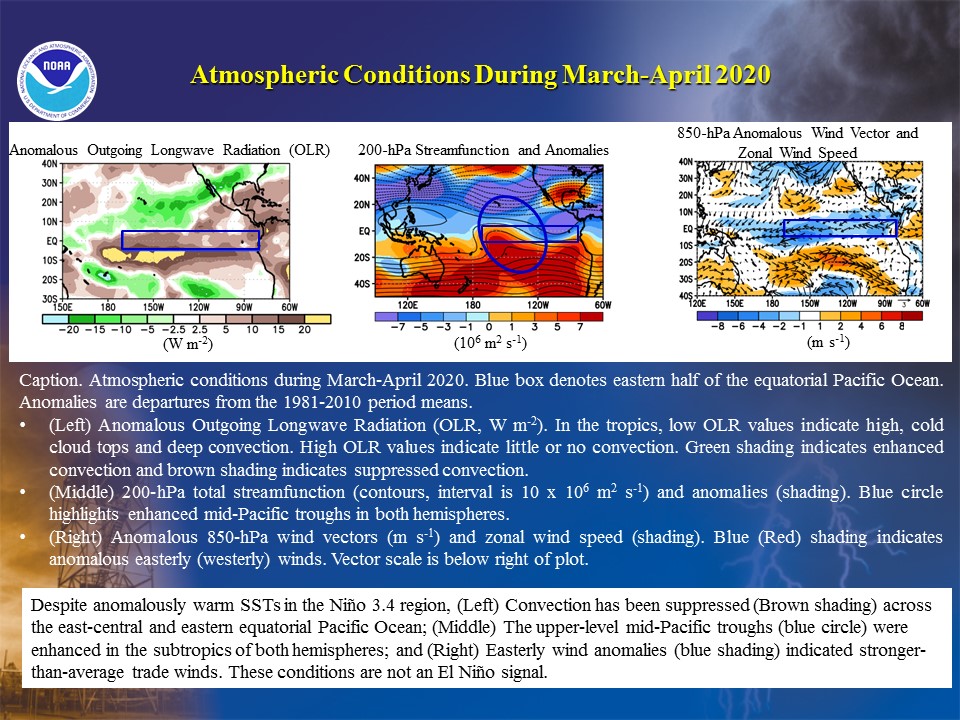
The Niño 3.4 index has recently cooled considerably. Previously this index was above +0.5°C during October 2019 through late April 2020. However, important El Niño impacts had been largely absent, which is why the CPC did not declare an El Niño. [NOAA classifies a weak El Niño as having a sustained Niño 3.4 index between +0.5°C and +1.0°C, along with consistent atmospheric impacts.] For example, during March-April 2020 convection was suppressed across the east-central and eastern equatorial Pacific Ocean, and the upper tropospheric circulation at 200-hPa featured enhanced mid-Pacific troughs in the subtropics of both hemispheres. Also, the easterly trade winds were stronger-than-average across the equatorial Pacific. None of these conditions reflect an El Niño, which by comparison would feature enhanced equatorial convection east of the date line, along with weaker mid-Pacific troughs at 200-hPa and westerly wind anomalies at 850-hPa.
Looking forward, model predicted SST anomalies in the Niño 3.4 region generally indicate ENSO-neutral (Niño 3.4 index between ± 0.5°C) throughout the hurricane season. The dynamical model average (red line) is on the cool side of zero, while the statistical model average (green line) is on the warm side of zero.
However, some of the dynamical models are indicating a transition to La Niña (Niño 3.4 index ≤ -0.5°C) as the summer progresses, which appears to be consistent with the enhanced trade winds and the recent decrease in SST anomalies across the equatorial Pacific Ocean. NOAA’s Climate Forecast system (CFS) is predicting La Niña during ASO 2020.
Based on current conditions, the recent oceanic evolution, model forecasts, and the low skill inherent in ENSO predictions made at this time of the year, NOAA’s latest ENSO outlook indicates about a 55% chance of ENSO-neutral during JAS and August-October (ASO), followed by a 35% chance of La Niña and only a 10% chance of El Niño.
b. Eastern North Pacific high- and low-activity eras
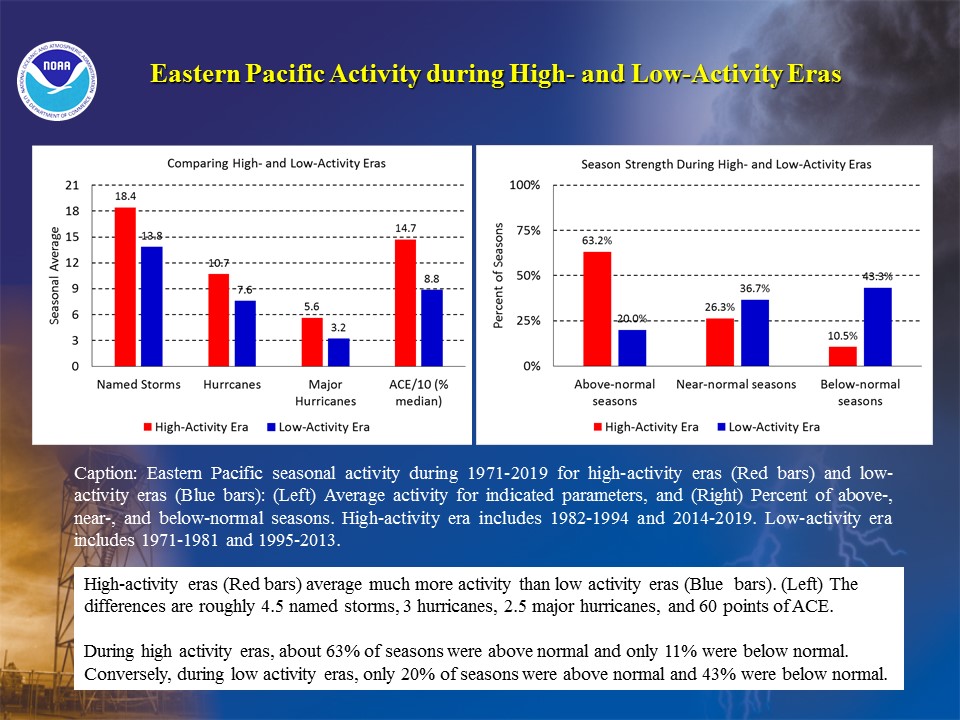
In addition to year-to-year fluctuations, eastern Pacific hurricane activity exhibits strong variability on decadal and multi-decadal time scales. Periods of increased activity (such as 1982-94 and 2014-19) are called high-activity eras, and periods of decreased activity (such as 1971-1981 and 1995-2013) are called low-activity eras. The differences in seasonal activity between these two eras are considerable. High-activity eras average about 4.6 more named storms, 3.1 more hurricanes, 2.4 more major hurricanes, and 59 more ACE points, than low-activity eras. As a result, above-normal seasons occur about three times more frequently during high-activity eras (63% of seasons compared to 20%), and below-normal seasons are about four times less frequent (11% compared to 43%).
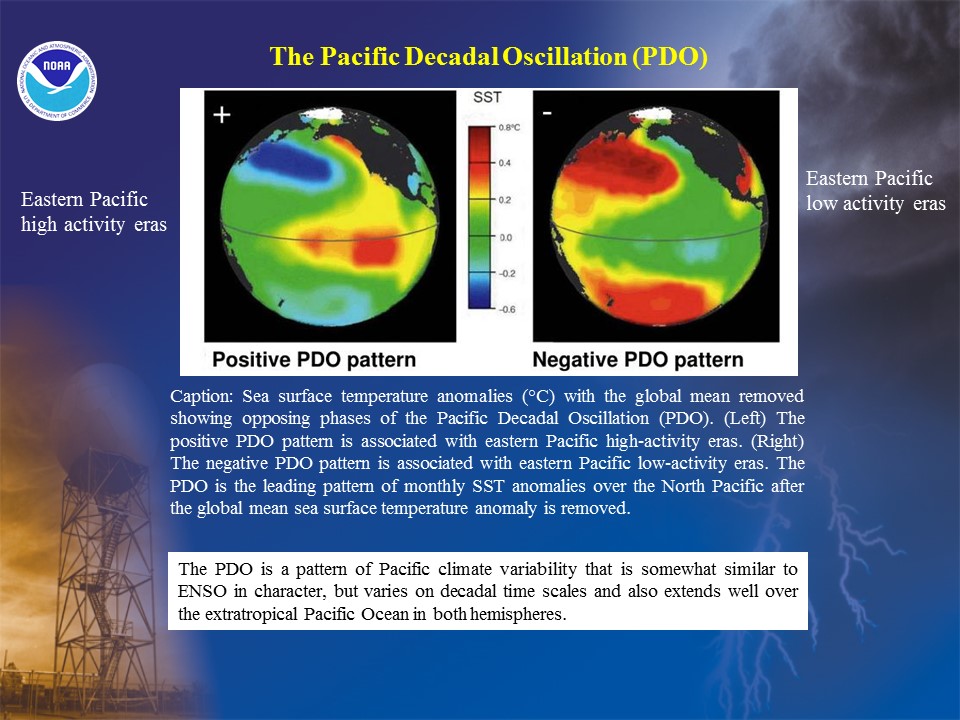
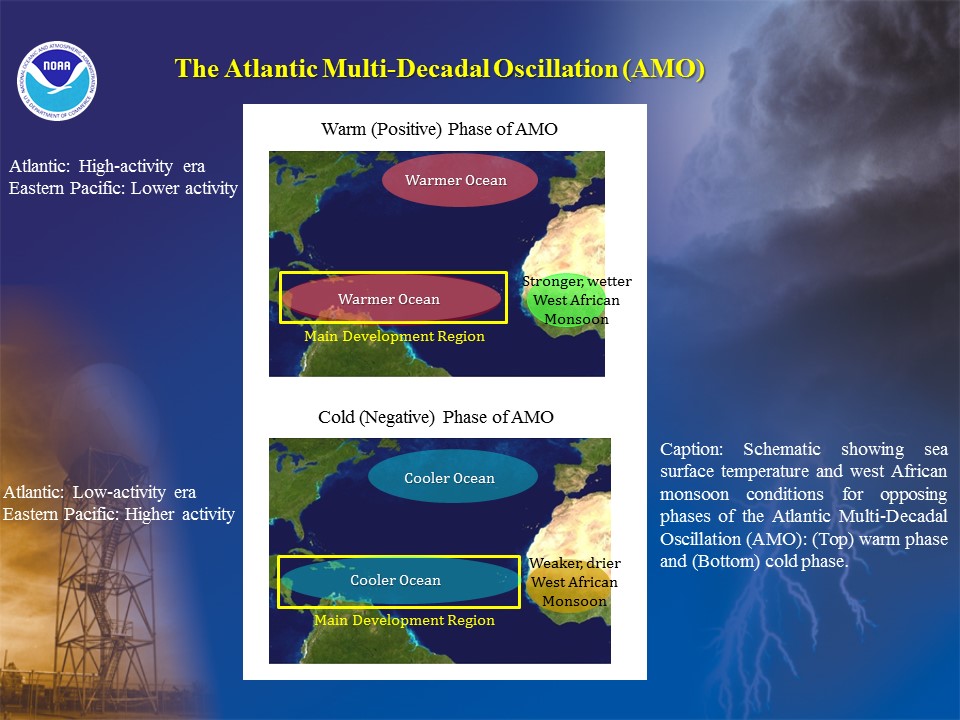
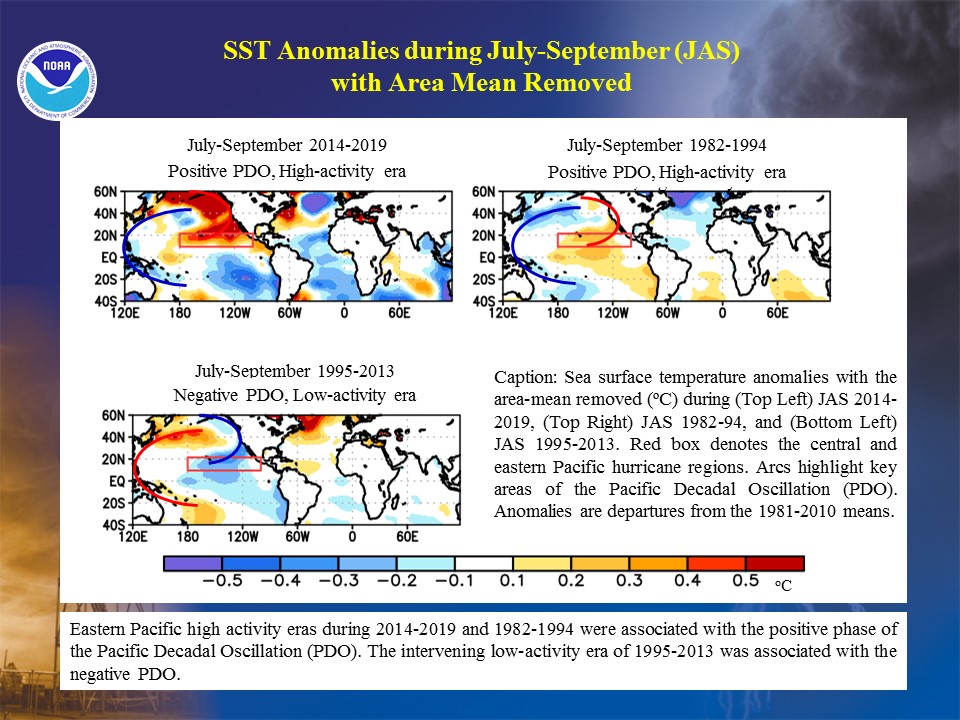
High- and low-activity eras are strongly related to global patterns of SST anomalies. It is upon these patterns that the inter-annual ENSO signal overlays. One such pattern is called the Pacific Decadal Oscillation (PDO). The PDO spans most of the North Pacific Ocean, and is associated with decadal fluctuations in hurricane activity. The positive (negative) phase of the PDO tends to be associated with high- (low-) activity eras. Another global SST pattern is the AMO. The cold (warm) phase of the AMO increases the likelihood of a high- (low-) activity era. The AMO helps to explain the inverse relationship in activity between the eastern Pacific and Atlantic basin, with a warm AMO favoring increased Atlantic activity and decreased eastern Pacific activity.
Looking at combinations of the AMO and PDO, the 1982-94 high-activity era was associated with a cold AMO and a positive PDO, while the 2014-19 high-activity era primarily featured a strong positive PDO. Conversely, the intervening 1995-2013 low-activity era featured a warm AMO and negative PDO.
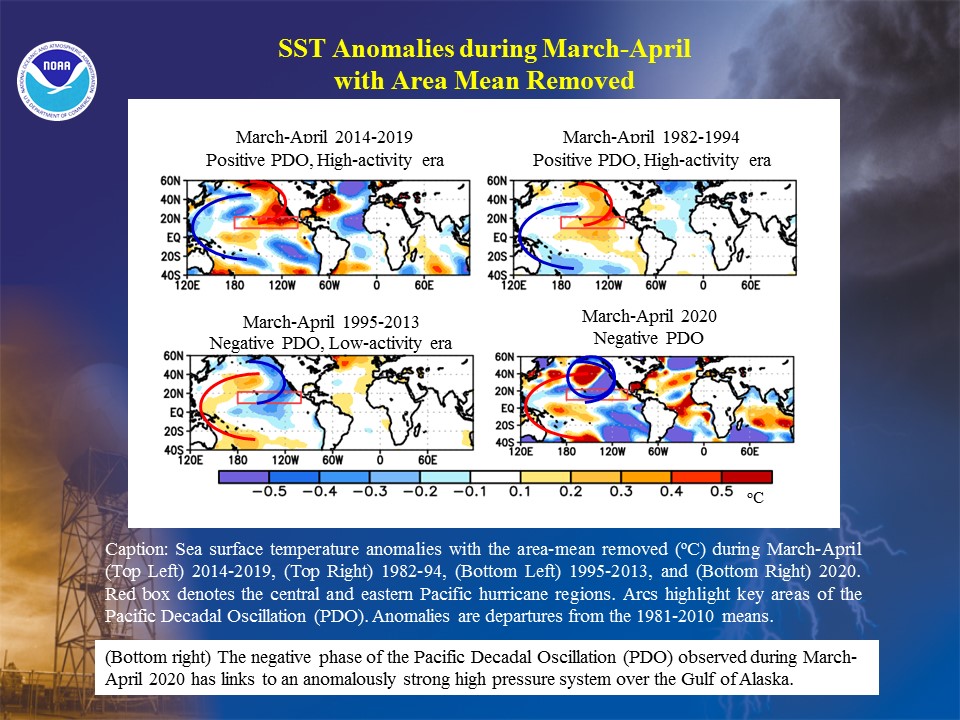
Regarding 2020, the current and predicted SST anomalies reflect the ongoing warm phase of the AMO, which has been present since 1995. They also reflect near- or below-average SSTs across the eastern Pacific hurricane region, which projects onto the negative phase of the PDO. This PDO signal is in marked contrast to the exceptionally warm SSTs and positive PDO seen in the eastern Pacific during the recent 2014-19 high-activity era.
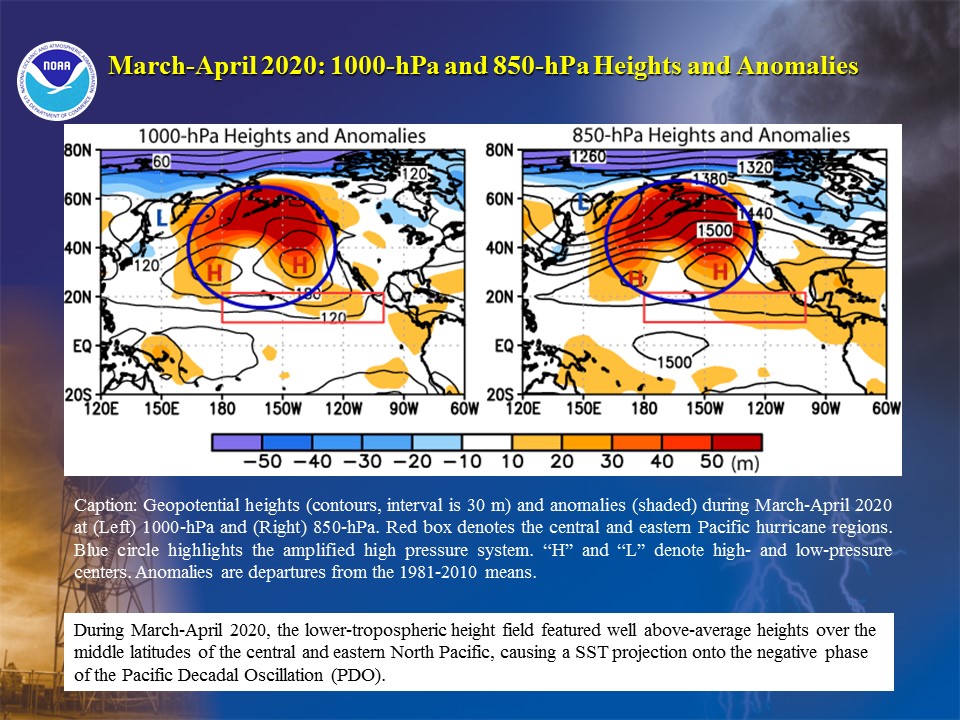
Confidence is not high that the negative PDO pattern will persist through the hurricane season. One reason is that SST forecasts made several months ahead tend to have limited skill. Another reason is that the current negative PDO signal partly reflects the synoptic-scale wind and pressure patterns associated with a highly-amplified High pressure system over the middle latitudes of the North Pacific. Therefore, the current conditions are not necessarily a longer-term transition to the negative PDO. These observations lead to larger uncertainty about the nature of the background climate signal upon which the ENSO signal will overlay during the peak months of the 2020 eastern Pacific hurricane season.
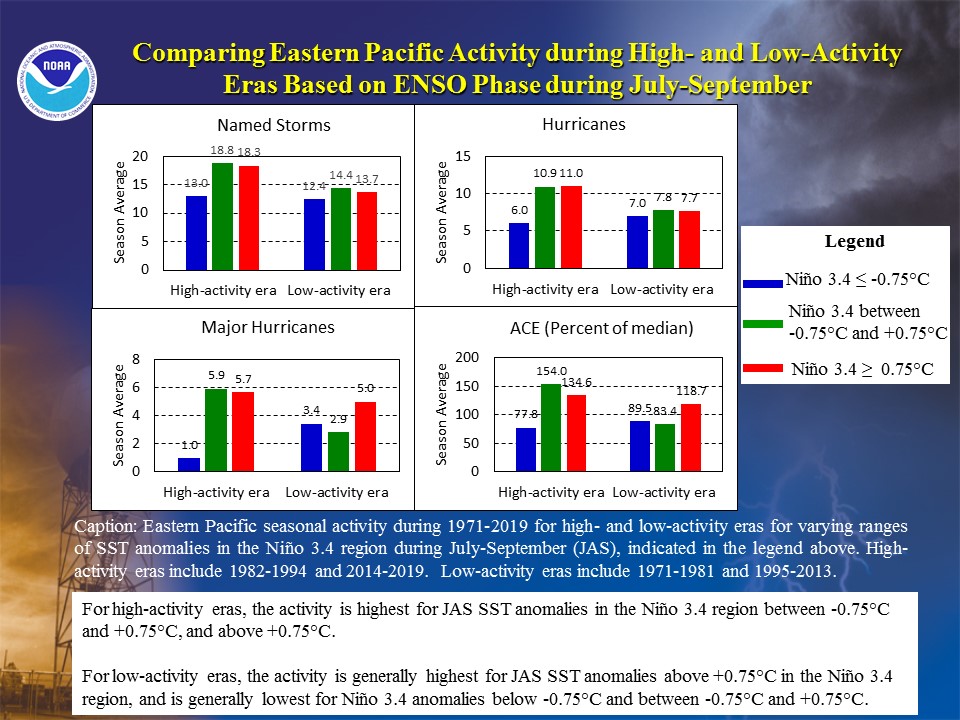
c. A closer look at ENSO during high- and low-activity eras
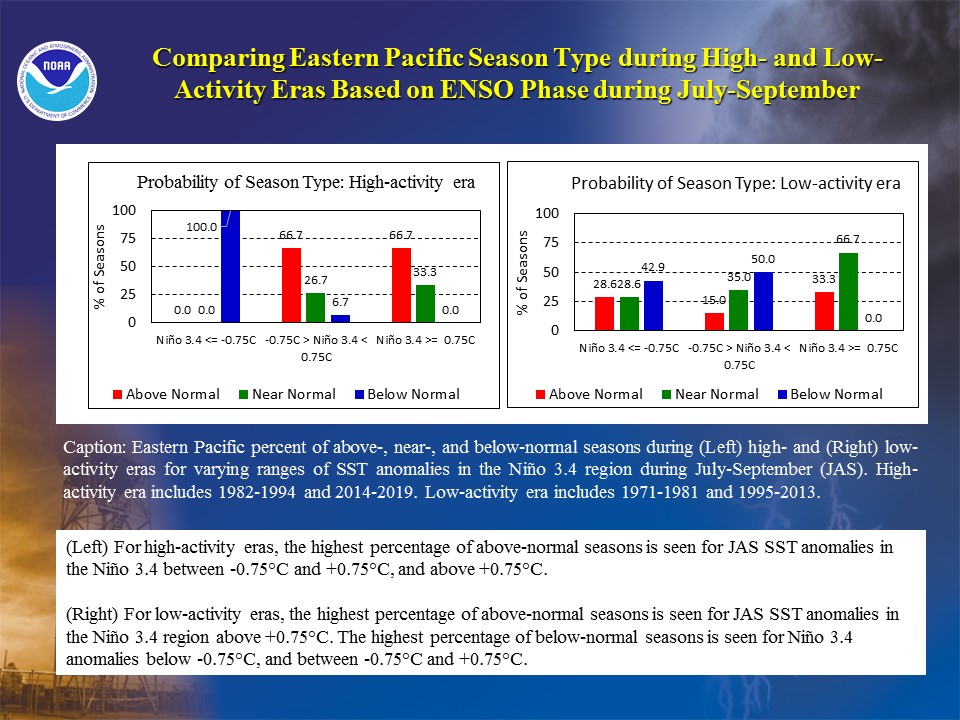
High- and low-activity era averages vary with ENSO phase, as seen for JAS Nino 3.4 SST anomalies ≤ -0.75°C, within ± 0.75°C, and ≥ 0.75°C. Although these ranges differ slightly from the official NOAA ENSO classifications, they are used to better isolate stronger El Niño and La Niña episodes from the weakest ones.
During high-activity eras, the highest levels of seasonal activity are seen for ENSO-neutral and El Niño years. These averages include 18-19 named storms, roughly 10-11 hurricanes, 6 major hurricanes, and an ACE between 135%-155% of the median. Consistent with these numbers, above-normal (near-normal) seasons are recorded in two-thirds (about 30%) of cases for both El Niño and ENSO-neutral. In contrast, for the single La Niña year in the high-activity era record, the seasonal activity included 13 named storms, 6 hurricanes, 1 major hurricane, and an ACE of 78% of median, all of which are well below the El Niño and ENSO-neutral averages.
During low-activity eras, the most major hurricanes (5) and highest ACE values (119% of median) on average are seen during El Niño years, and the fewest (roughly 3 major hurricanes and ACE of 80%-90% of the median) are seen for both La Niña and ENSO-neutral. The fewest named storms (12.4) and hurricanes (7.0) are seen during La Niña, with only slightly higher averages (14 named storms and 7.7 hurricanes) during both ENSO-neutral and El Niño.
For all parameters, the largest decreases during low-activity eras are seen for ENSO-neutral years, with average decreases of 4.5 named storms, 3 hurricanes, 3 major hurricanes, and 71 ACE points. El Niño years feature similar large decreases in both named storms and hurricanes, but only slight decreases in major hurricanes (0.7) and ACE (16 points).
During El Niño, the probabilities of above-normal (33%) and near-normal (67%) seasons during low-activity eras are essentially reversed compared to high-activity eras. For ENSO-neutral, the probability of an above-normal season drops sharply to near 15% during low-activity eras, and the probability of a below-normal season increases to near 50%. As a result, La Niña and ENSO-neutral have roughly similar probabilities for all three season classifications during low-activity eras.
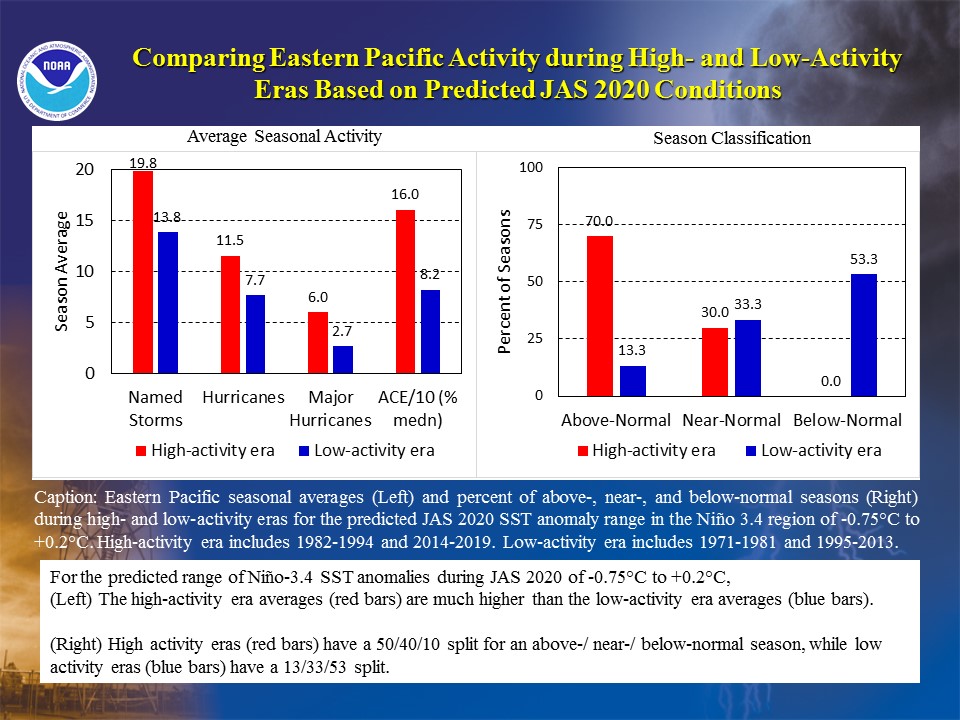
Looking specifically at the seasonal activity that is historically associated with the predicted Niño 3.4 conditions for this season, the results are again highly dependent on whether the eastern Pacific is in a high-activity era or a low-activity era. If the negative PDO signal persists, the average activity would be about 14 named storms, 8 hurricanes, 3 major hurricanes, and an ACE of 82% of median. In contrast, if the positive PDO signal returns, the averages would increase to almost 20 named storms, 11-12 hurricanes, 6 major hurricanes, and an ACE of 160% of median. These analogues highlight the uncertainty in this hurricane outlook, which arises primarily because of uncertainty in predictions of the PDO and ENSO. The predicted ranges of activity for 2020 are designed to capture not only the predicted conditions, but also their uncertainty.
NOAA FORECASTERS:
Climate Prediction Center
National Hurricane Center
|


