The 2025 eastern Pacific Hurricane Season outlook is an official product of the National Oceanic and Atmospheric Administration (NOAA) Climate Prediction Center (CPC), and is produced in collaboration with hurricane experts from NOAA’s National Hurricane Center (NHC) and the Atlantic Oceanographic and Meteorological Laboratory’s (AOML). The eastern Pacific hurricane region covers the eastern North Pacific Ocean east of 140°W and north of the equator.
Interpretation of NOAA's eastern Pacific Hurricane Season Outlook
This outlook is general guide to the expected overall activity during the upcoming hurricane season. It is not a seasonal hurricane landfall forecast, and it does not imply levels of activity for any particular location.
Preparedness
Hurricane-related disasters can occur during any season, even for years with low overall activity. It only takes one hurricane (or tropical storm) to cause a disaster. It is crucial that residents, businesses, and government agencies of coastal and near-coastal regions prepare for every hurricane season regardless of this, or any other, seasonal outlook. The Federal Emergency Management Agency (FEMA) through www.ready.gov (English) and www.listo.gov (Spanish), the NHC, the Small Business Administration, and the American Red Cross all provide important hurricane preparedness information on their web sites.
NOAA does not make seasonal hurricane landfall predictions
NOAA does not make seasonal hurricane landfall predictions. Hurricane landfalls are largely determined by the weather patterns in place as the hurricane approaches, which are only predictable when the storm is several days of making landfall.
Nature of this Outlook and the "likely" ranges of activity
This outlook is probabilistic, meaning the stated "likely" ranges of activity have a certain likelihood of occurring. The seasonal activity is expected to fall within these ranges in 7 out of 10 seasons with similar conditions and uncertainties to those expected this year. They do not represent the total possible ranges of activity seen in past similar years.
This outlook is based on model forecasts, and on predictions of large-scale factors and conditions that are known to strongly influence seasonal eastern Pacific hurricane activity. The outlook also takes into account uncertainties inherent in such outlooks.
Sources of uncertainty in this seasonal outlook
-
Predicting the El Niño-Southern Oscillation (ENSO) phases, which include El Niño and La Niña events and ENSO-neutral and their specific impacts on eastern Pacific hurricane activity is an ongoing scientific challenge facing scientists today. Such forecasts made during the spring generally have more uncertainty than those made closer to the peak of the East Pacific hurricane season (July-September: JAS).
-
Uncertainty as to whether the eastern Pacific has shifted to a long-term low-activity era, or that the recent quiescent period will be short lived and there will be a return to the high activity era that lasted from 2014-2019.
-
Predicting the combined impacts associated with the ENSO, Pacific Decadal Oscillation (PDO), and the Atlantic Multidecadal Oscillation (AMO) remains a challenge, especially when they have different temporal variability that sometimes results in competing influences.
-
Many combinations of named storms, hurricanes, and major hurricanes can occur for the same general set of conditions. For example, one cannot know with certainty whether a given signal will be associated with several short-lived storms or fewer longer-lived storms with greater intensity.
-
Shorter-term weather patterns that are unpredictable on seasonal time scales can sometimes develop and last for weeks or months within a season, possibly affecting seasonal hurricane activity.
2025 Eastern Pacific Hurricane Outlook Summary
a. Predicted Activity
NOAA's 2025 eastern Pacific Hurricane Season outlook indicates a below-normal season is most likely (50% chance). There is a 30% chance of a near-normal season and only a 20% chance of an above-normal season.See NOAA definitions of above-, near-, and below-normal seasons. The eastern Pacific hurricane region covers the eastern North Pacific Ocean east of 140°W and north of the equator.
The 2025 outlook calls for a 70% probability for each of the following ranges of activity:
- 12-18 Named Storms
- 5-10 Hurricanes
- 2-5 Major Hurricanes
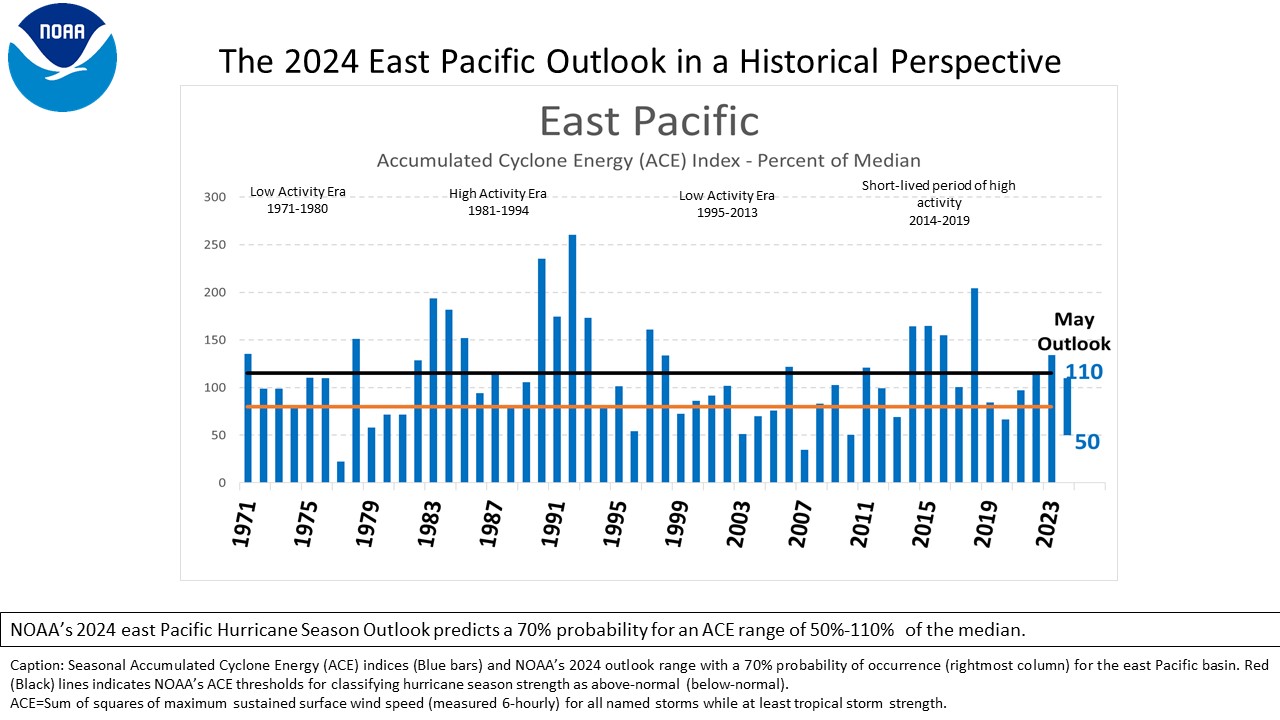
- Accumulated Cyclone Energy (ACE) range of 60%-130% of the median.
The activity is expected to fall within these ranges in 70% of seasons with similar conditions and uncertainties to those expected this year. These ranges do not represent the total possible activity seen in past similar years. The predicted ranges are centered below the 1991-2020 averages of 15 named storms, 8 hurricanes, and 4 major hurricanes.
The eastern Pacific hurricane season officially runs from May 15th through November 30th. The peak months of the season are July-September (JAS).
There will be no further updates to this outlook.
b. Reasoning behind the outlook
Two primary factors are expected to contribute to a below-normal 2025 hurricane season across the eastern Pacific hurricane basin, as follows:
-
The latest monthly sea-surface temperature (SST) anomalies reflect ENSO-neutral conditions, a negative PDO structure, and North Atlantic SSTs above-normal for much of the basin. There is some evidence of influence from the negative PDO related circulation pushing cooler waters southward. The cooler waters are expected to occur mainly west of 120°W, so that may limit intensity and duration of storms that do develop. SSTs across the Atlantic Main Development Region (MDR) are above normal, especially the western portions. Historically, this combination of cooler Pacific SSTs near the equator (Negative PDO) and warmer Atlantic (positive AMO) tends to be associated with below-normal hurricane activity in the eastern Pacific.
-
The most recent forecast from the NOAA Climate Prediction Center indicates ENSO-Neutral conditions are likely through the hurricane season. The ENSO influence on eastern Pacific hurricane activity is highly dependent upon the background SST patterns across the eastern Pacific hurricane region and the Atlantic MDR. In 2024, the combination of cooler SSTs near the equatorial Pacific and above-normal temperatures in the Atlantic MDR resulted in a below-normal eastern Pacific hurricane season. For 2025, the Atlantic MDR SSTs are predicted to be above normal, but the tropical Pacific is most likely to experience ENSO-neutral. However, many of the models do indicate negative Niño 3.4 index values (though not full La Niña conditions), so that contributes to a slight tilt toward below-normal activity.
DISCUSSION
1. Expected 2025 activity
NOAA’s 2025 eastern Pacific Hurricane Season Outlook ndicates a below-normal season is most likely (50% chance). There is a 30% chance of a near-normal season and only a 20% chance of an above-normal season.
The 2025 eastern Pacific hurricane season is predicted to produce (with a 70% probability for each range) 12-18 named storms, of which 5-10 are expected to become hurricanes, and 2-5 of those are expected to become major hurricanes. These ranges are centered near or below the 1991-2020 seasonal averages of 15 named storms, 8 hurricanes, and 4 major hurricanes.
An important measure of the total seasonal activity is NOAA’s Accumulated Cyclone Energy (ACE) index, which accounts for the combined intensity and duration of named storms and hurricanes during the season. This 2025 outlook indicates a 70% chance that the ACE range will be 60-130% of the median. An ACE value of 80%-120% of the median indicates a near-normal season. Values above this range reflect an above-normal season, and values below this range reflect a below-normal season.
Predictions of the location, number, timing, and intensity of hurricane landfalls are ultimately related to the daily weather patterns which determine storm genesis locations and steering patterns. These patterns are not predictable weeks or months in advance. As a result, it is currently not possible to reliably predict the number or intensity of landfalling hurricanes at these extended ranges, or whether a given locality will be impacted by a tropical storm or hurricane this season.
2. Science behind the Outlook
NOAA’s eastern Pacific Hurricane Season Outlook is based on predictions of the main factors and their associated relationships to the hurricane season, as well as direct output from numerical models. The outlook is based on extensive monitoring, analysis, research activities, a suite of statistical prediction tools, and dynamical models. The dynamical model predictions come from the NOAA Climate Forecast System (CFS), NOAA Geophysical Fluid Dynamics Lab (GFDL) HiFLOR and SPEAR-MED modes, the North American Multi-Model Ensemble (NMME), the United Kingdom Met Office (UKMET) GloSea6 model, and the European Centre for Medium-Range Weather Forecasting (ECMWF) Seas5 model. ENSO forecasts are also provided from the NMME dynamical models contained in the suite of Niño 3.4 SST forecasts, which is compiled by NOAA’s CPC.
NOAA’s 2025 eastern Pacific Hurricane Season Outlook reflects the following atmospheric and oceanic factors:
-
The predicted SST anomaly patterns across the eastern Pacific hurricane region indicate near-average SSTs with above-average SSTs across the Atlantic MDR. SST anomalies in the regions where many of the tropical storms and hurricanes form (110°W - 140°W) are warmer than average (cooler) in the east (west). For the Pacific, these conditions also project onto the negative phase of the Pacific Decadal Oscillation (PDO) and also onto the warm (positive) phase of the Atlantic Multidecadal Oscillation (AMO). Historically, this combination of atmospheric and oceanic patterns tends to be associated with below-normal activity in the eastern Pacific hurricane region. The exact interplay and net result of the interbasin relationships is uncertain and still a focus of ongoing research, and that uncertainty is reflected in the relatively moderate probabilities in this outlook.
-
The most recent forecast from the NOAA Climate Prediction Center indicates ENSO-Neutral conditions are most likely through the hurricane season. The ENSO influence on eastern Pacific hurricane activity is highly dependent upon the background SST patterns across the eastern Pacific hurricane region and the Atlantic MDR. In 2024, the combination of La Niña and above-normal temperatures in the Atlantic MDR resulted in a below-normal hurricane season. For 2025, the Atlantic MDR SSTs are predicted to be above normal, but the tropical Pacific is most likely to experience ENSO-neutral. Many of the models do indicate Niño 3.4 index values below normal, so that contributes to a slight tilt toward below-normal activity.
a. ENSO-Neutral favored
ENSO-neutral is the most likely outcome during the JAS period, though odds are at 63%, so there is still a possibility (~25%) that a weak La Niña could emerge, or that the atmosphere reflects La Niña forcing in some ways. The weekly SSTs are currently slightly below average across much of the central and eastern equatorial Pacific and the SST index for the Niño 3.4 region is -0.1 °C. The Niño 3.4 index has shown no significant trend since March of 2025.The wind and outgoing longwave radiation patterns over the central Pacific are also reflecting a breakdown of the atmospheric response to last winter’s forcings, which resembled La Niña, though the Oceanic Niño Index (ONI) values did not meet the threshold for enough consecutive 3-month seasons.
Looking forward, model-predicted SST anomalies in the Niño 3.4 region generally indicate ENSO-neutral conditions throughout the hurricane season. The dynamical model average (dashed black line) indicates ENSO-neutral through the late summer and autumn of 2025, with one modeling system indicating La Niña conditions early in the summer.
NOAA’s Climate Forecast System (CFS) and the North American Multi-Model Ensemble (NMME) are predicting ENSO-neutral. The CFS and NMME predict above-normal vertical wind shear over the eastern Pacific. The highest wind shear anomalies are expected to be located over the area from 110°W to 130°W, the region where most of the eastern Pacific hurricanes develop and track. Wind shear closer to Hawaii is expected to be near to, or lower than, normal. Vertical wind shear is one of the most important factors determining the level of seasonal activity with lower- (higher-) than-normal vertical wind shear associated with higher- (lower-) amounts of activity.
b. Eastern North Pacific high- and low-activity eras
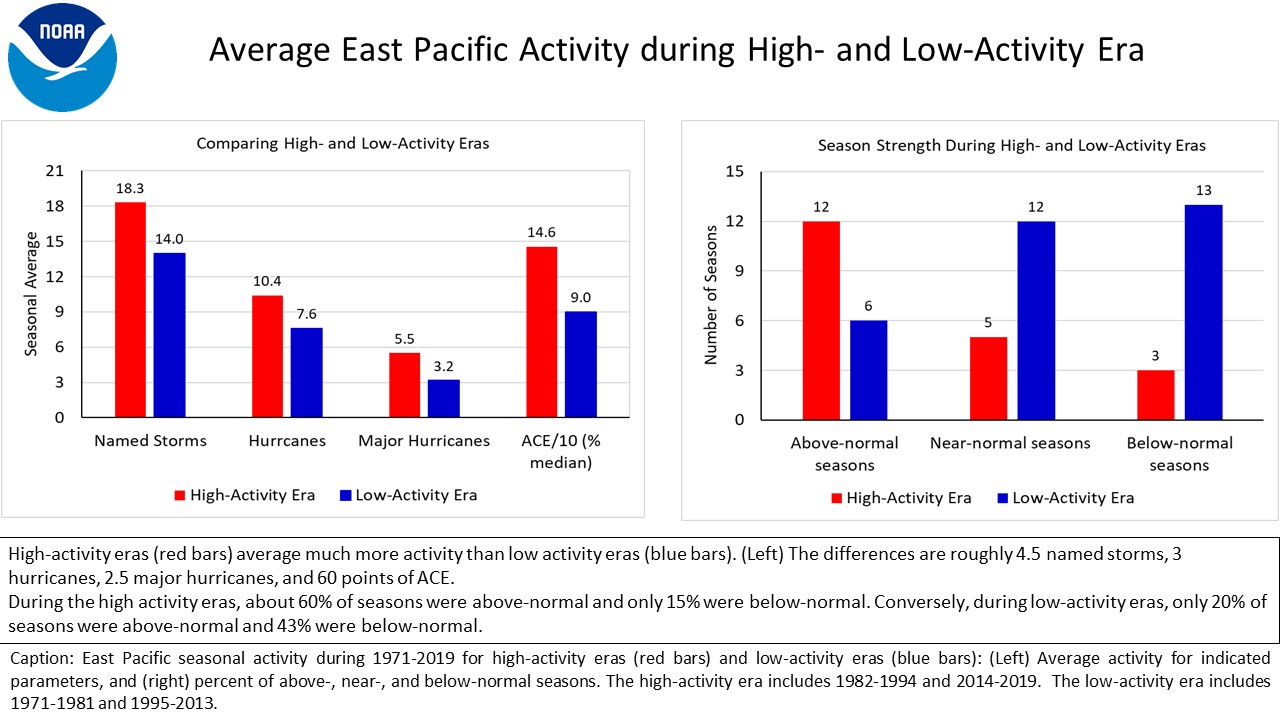
In addition to year-to-year fluctuations, eastern Pacific hurricane activity exhibits strong variability on decadal and multi-decadal time scales. Periods of decreased activity (such as 1971-1981 and 1995-2013) are called low-activity eras, and periods of increased activity (such as 1982-1994 and 2014-2019) are called high-activity eras. The differences in seasonal activity between these two eras for the eastern Pacific are considerable. High-activity eras average about 4.5 more named storms, 2.8 more hurricanes, 2.3 more major hurricanes, and 56% more ACE, than low-activity eras. During high-activity eras, above-normal seasons occur about three times more frequently (63% of seasons compared to 20%), and below-normal seasons are about four times less frequent (11% compared to 43%).
High- and low-activity eras in the eastern Pacific hurricane region are related to global patterns of SST anomalies that change slowly and last for many years. It is upon these patterns that the inter-annual ENSO signal overlays. One such pattern is called the PDO. The PDO spans most of the North Pacific Ocean, and is associated with decadal fluctuations in hurricane activity. The positive (negative) phase of the PDO tends to be associated with high- (low-) activity eras. Another SST pattern is the AMO, and when linked to wind patterns can be more broadly described as Atlantic Multidecadal Variability (AMV), measured through the Atlantic Meridional Mode (AMM). The cold (warm) phase of the AMO increases the likelihood of a high- (low-) activity era. The AMO helps to explain the inverse relationship in activity between the eastern Pacific and Atlantic basins, with a warm AMO/positive AMM favoring increased Atlantic activity and decreased eastern Pacific activity. The AMO is positive this year with warm SSTs in the North Atlantic.
The 1982-1994 high-activity era was associated with a cold AMO and a positive PDO, which was then followed by a low-activity era from 1995-2013 that featured a warm AMO and negative PDO. The period from 2014-2020 exhibited higher activity and primarily featured a strong positive PDO. Such a short period of years would not define an activity era. The variability in recent years points more to intraseasonal signals overriding the long-term signals. Of the years when the August PDO was negative, approximately 70% of those years were near normal or below normal for activity (18 of 24 since 1971). The current value of the PDO is -0.41, and the SST patterns from this spring are similar to many low-activity years. The SST patterns in 2022 and 2023 were also similar, but the eastern Pacific experienced near-normal activity and above-normal activity, respectively, during those years. That variation shows that interannual variability can override the decadal signals. There is high confidence that the current negative PDO pattern will persist through the hurricane season.
NOAA FORECASTERS
Climate Prediction Center
- Matthew Rosencrans, Physical Scientist, Matthew.Rosencrans{at}noaa.gov
- Dr. Hui Wang, Meteorologist; Hui.Wang{at}noaa.gov
- Dr. Daniel Harnos, Meteorologist; Daniel.Harnos{at}noaa.gov
- Lindsey Long, Meteorologist; Lindsey.Long{at}noaa.gov
National Hurricane Center
- Eric Blake, Senior Hurricane Specialist; Eric.S.Blake{at}noaa.gov
- Dr. Christopher Landsea, Meteorologist; Chris.Landsea{at}noaa.gov
Hurricane Research Division
- Stanley Goldenberg, Meteorologist; Stanley.Goldenberg{at}noaa.gov
|


