|
|
HOME > Monitoring and Data > Global Climate Data > Global Precipitation Time Series > Northeastern South America
|
| |

|
Northeastern South America
Accumulated Precipitation
Actual vs. Normal
Daily Precipitation (mm)
Last 90 Days
|
| |
|
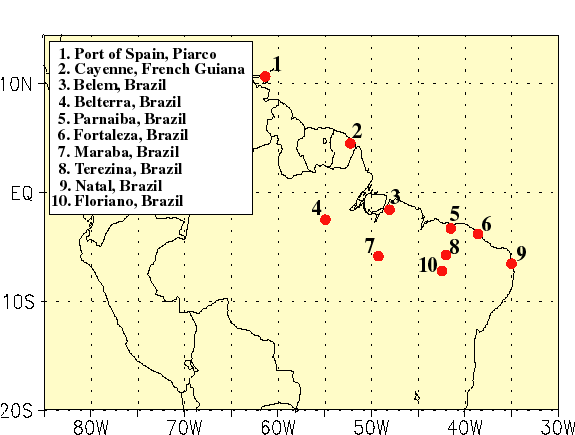
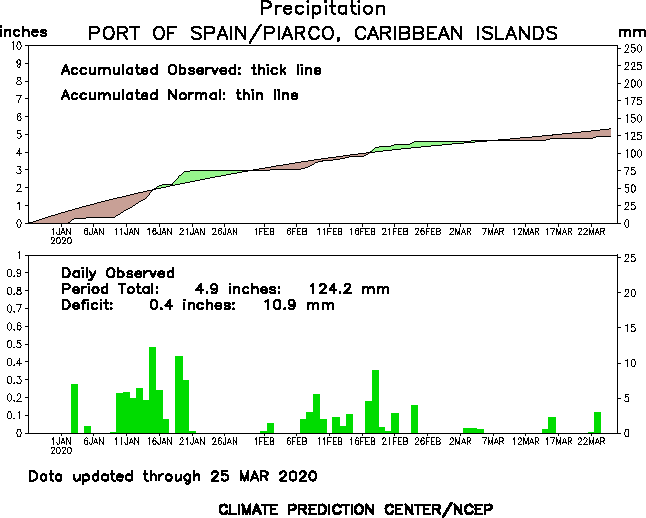
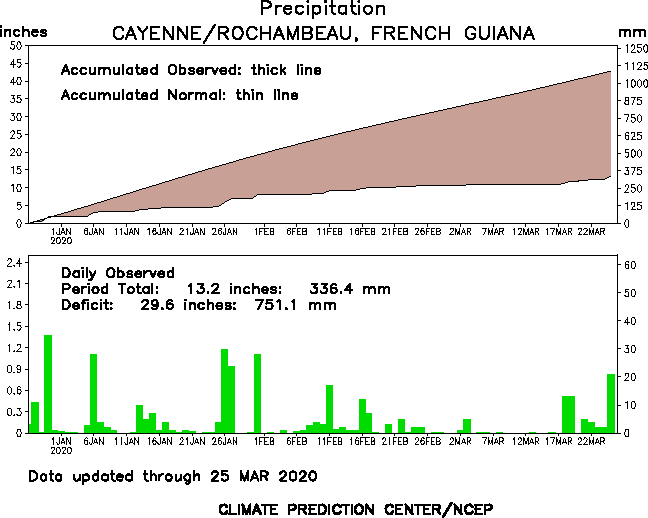
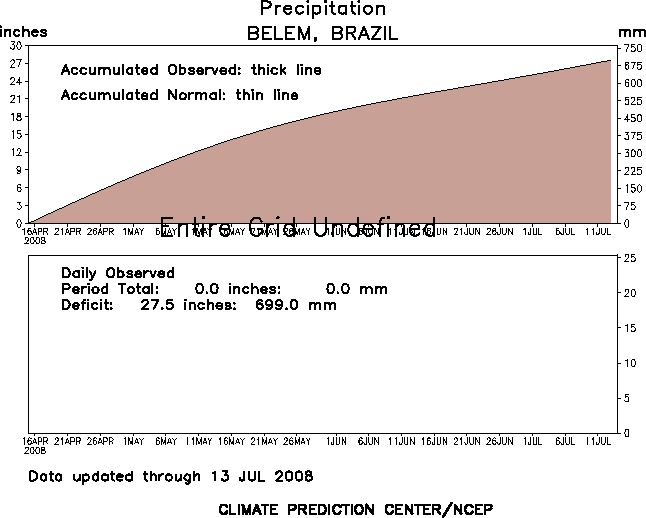
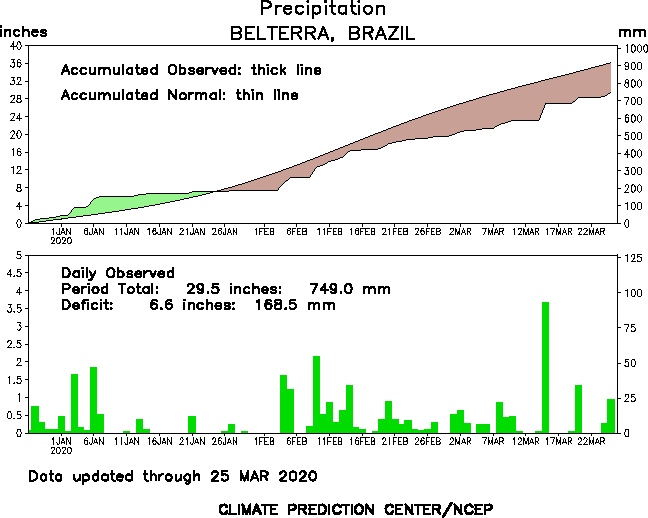
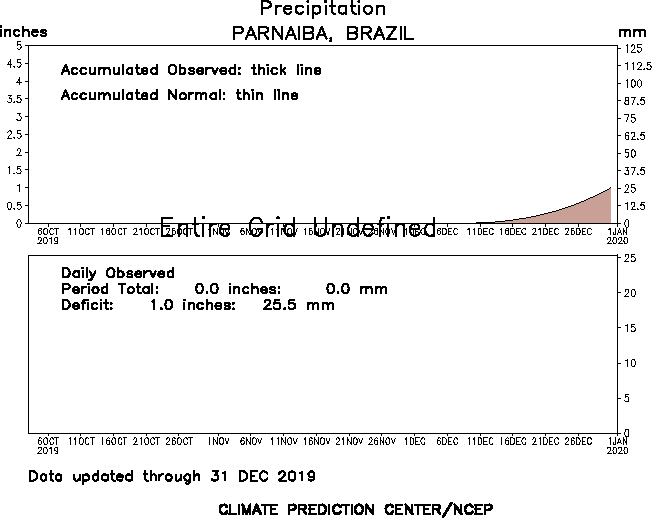
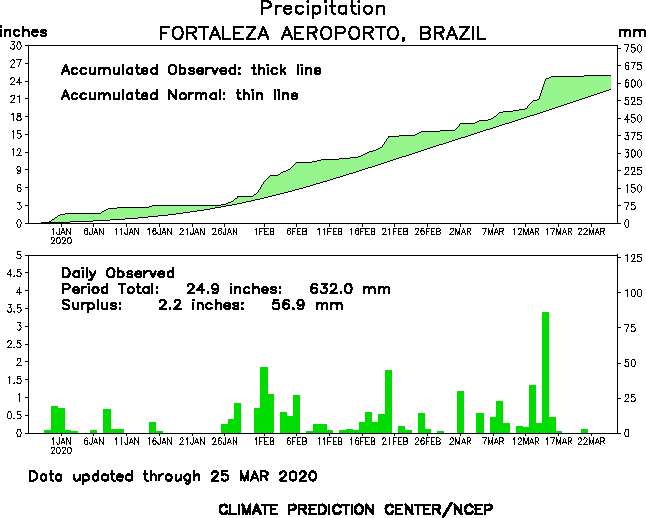
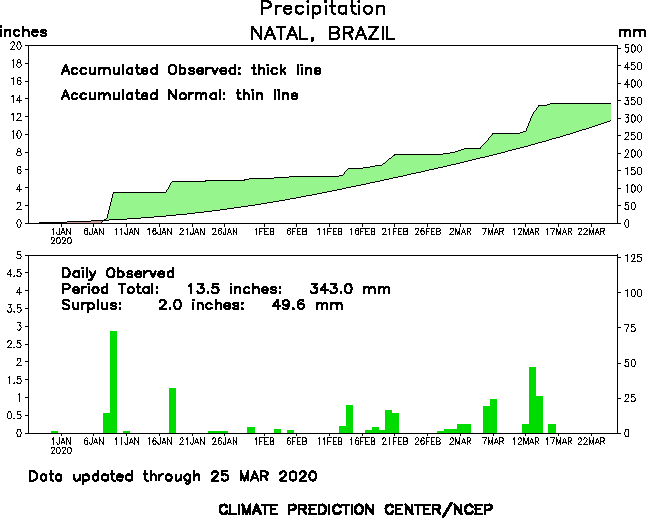
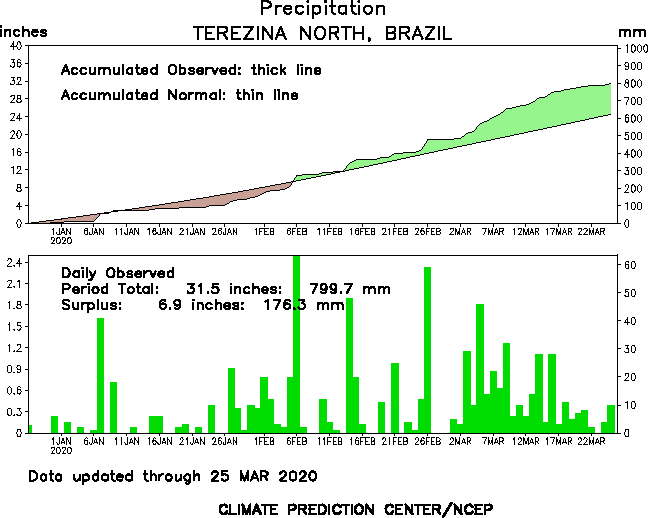
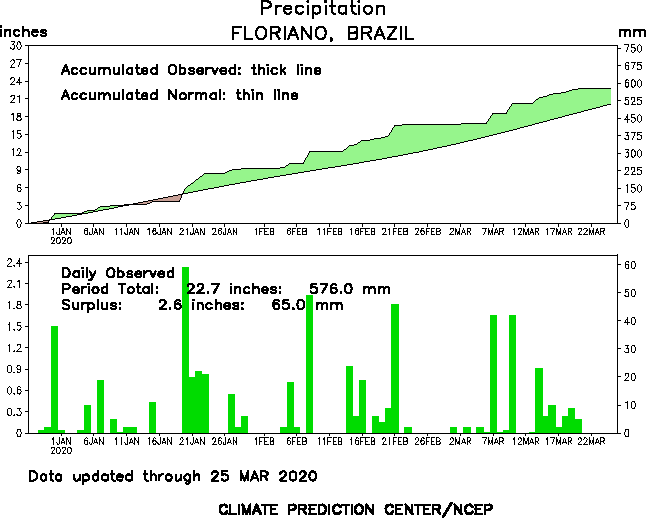
Click on the following locations to display time series of accumulated
precipitation for various locations throughout northeastern South America. In the time
series, the thick line depicts the accumulated actual precipitation and the dashed, thin
line shows the accumulated normal precipitation. Regions shaded green show precipitation
surpluses; regions shaded brown show precipitation deficits. Blank areas indicate missing
data.
|
|
1. Port of Spain, Piarco
2. Cayenne, French Guiana
3. Belem, Brazil
4. Belterra, Brazil
5. Parnaiba, Brazil
6. Fortaleza, Brazil
7. Maraba, Brazil
8. Natal, Brazil
9. Terezina, Brazil
10. Floriano, Brazil
|
|
|


